Corporate Headquarters 5

Logo at the Fresenius corporate head office in Bad Homburg.
Share
Services
Logo at the Fresenius corporate head office in Bad Homburg.
If no timeframe is specified, information refers to Q2/2019
1 Adjusted for IFRS 16 effect
2 Q2/18 and H1/18 adjusted for divestitures of Care Coordination activities at Fresenius Medical Care (FMC)
3 Net income attributable to shareholders of Fresenius SE & Co. KGaA
For a detailed overview of special items and adjustments please see the reconciliation tables on pages 20-32 of the PDF document.
Stephan Sturm, CEO of Fresenius, said: “We are reporting a good second quarter 2019, with healthy organic growth in all four business segments. Our investments in future growth are moving ahead according to plan, as we further strengthen the foundations for the long-term, successful development of Fresenius. So we are very confident about the second half and the coming years.”
Group sales growth guidance for 2019 raised
Based on the Group’s good H1/19 results and good prospects for the remainder of the year, Fresenius raises its 2019 Group sales growth guidance. Fresenius now projects sales growth1 of 4% to 7% in constant currency. Previously, Fresenius expected sales growth1 of 3% to 6% in constant currency. The company confirms its earnings guidance. Net income2,3 growth is expected to be ~0% in constant currency. The guidance for 2019 includes the related sales and dilutive earnings contributions of the NxStage acquisition.
Fresenius expects net debt/EBITDA4 at year-end to be around the upper-end of the original self-imposed target corridor of 2.5x to 3.0x. This includes the NxStage acquisition which is increasing the net debt/EBITDA ratio in 2019 by ~30 basis points and excludes IFRS 16 effects.
Due to the adoption of the IFRS 16 accounting standard (“IFRS 16 effect”), Fresenius’ self-imposed target corridor has shifted to 3.0x to 3.5x net debt/EBITDA on a reported basis.
1 On a comparable basis: FY/18 base: €33,009 million; FY/18 adjusted for divestitures of Care Coordination activities at FMC (H1/18); FY/19: adjusted for IFRS 16 effect
2 Net income attributable to shareholders of Fresenius SE & Co. KGaA
3 On a comparable basis: FY/18 base: €1,872 million; FY/18 before special items and adjusted for divestitures of Care Coordination activities at FMC (H1/18); FY/19: before special items (transaction-related expenses, revaluations of biosimilars contingent liabilities, gain related to divestitures of Care Coordination activities at FMC, expenses associated with the cost optimization program at FMC), adjusted for IFRS 16 effect
4 Both net debt and EBITDA calculated at expected annual average exchange rates; excluding further potential acquisitions
For a detailed overview of special items and adjustments please see the reconciliation tables on pages 20-32 of the PDF document.
6% sales growth1 in constant currency
Group sales were €8,761 million including an IFRS 16 effect of -€18 million. Group sales1 on a comparable basis increased by 8% (6% in constant currency) to €8,779 million (Q2/18: €8,124 million). Organic sales growth was 5%. Acquisitions/divestitures contributed net 1% to growth. In H1/19, Group sales were €17,256 million including an IFRS 16 effect of -€40 million. Group sales1 on a comparable basis increased by 8% (6% in constant currency) to €17,296 million (H1/18: €15,994 million). Organic sales growth was 5%. Acquisitions/divestitures contributed net 1% to growth. Positive currency translation effects of 2% were mainly driven by the U.S. dollar strengthening against the euro.
Net income2,3 growth in constant currency
Group EBITDA before special items was €1,703 million including an IFRS 16 effect of €242 million. Group EBITDA2 on a comparable basis decreased by 2% (-5% in constant currency) to €1,461 million (Q2/18: €1,495 million). In H1/19, Group EBITDA before special items was €3,404 million including an IFRS 16 effect of €462 million. Group EBITDA2 on a comparable basis increased by 2% (-1% in constant currency) to €2,942 million (H1/18: €2,889 million).
Group EBIT before special items was €1,118 million including an IFRS 16 effect of €37 million. Group EBIT2 on a comparable basis decreased by 5% (-7% in constant currency) to €1,081 million (Q2/18: €1,135 million). The EBIT margin2 on a comparable basis was 12.3% (Q2/18: 14.0%). A significant contributor was the reduction in patient attribution and a decreasing savings rate for ESCOs, based on recent reports for prior plan years (“ESCO effect”). Reported Group EBIT4 was €1,118 million. In H1/19, Group EBIT before special items was €2,248 million including an IFRS 16 effect of €56 million. Group EBIT2 on a comparable basis remained at previous year’s level (-3% in constant currency) at €2,192 million (H1/18: €2,185 million). The EBIT margin2 on a comparable basis was 12.7% (H1/18: 13.7%). Reported Group EBIT4 was €2,233 million.
Group net interest before special items was -€180 million including an IFRS 16 effect of -€58 million. On a comparable basis, net interest2 improved to -€122 million (Q2/18: -€140 million) mainly due to successful refinancing activities and lower interest rates. Reported Group net interest4 was -€179 million. In H1/19, Group net interest before special items was -€361 million including an IFRS 16 effect of -€106 million. On a comparable basis, net interest1 improved to -€255 million (H1/18: -€279 million). Reported Group net interest3 was -€363 million.
1 On a comparable basis: Q2/18 and H1/18 adjusted for divestitures of Care Coordination activities at FMC;
Q2/19 and H1/19 adjusted for IFRS 16 effect
2 On a comparable basis: Q2/19 and H1/19 before special items and adjusted for IFRS 16 effect;
Q2/18 and H1/18 adjusted for divestitures of Care Coordination activities at FMC
3 Net income attributable to shareholders of Fresenius SE & Co. KGaA
4 After special items and including IFRS 16 effect
For a detailed overview of special items and adjustments please see the reconciliation tables on pages 20-32 of the PDF document.
The Group tax rate before special items and adopting IFRS 16 was 22.8%. Group tax rate1 on a comparable basis was 22.8% (Q2/18: 23.3%). In H1/19, the Group tax rate before special items and adopting IFRS 16 was 23.1%. In H1/19, Group tax rate1 on a comparable basis was 23.1% (H1/18: 22.1%).
Noncontrolling interest before special items was €253 million including an IFRS 16 effect of €7 million. Noncontrolling interest1 on a comparable basis was €260 million (Q2/18:
€290 million). In H1/19, Noncontrolling interest before special items was €524 million including an IFRS 16 effect of €20 million. Noncontrolling interest1 on a comparable basis was €544 million (H1/18: €560 million), of which 93% was attributable to the Noncontrolling interest in Fresenius Medical Care.
Group net income2 before special items was €471 million including an IFRS 16 effect of -€9 million. Group net income1,2 on a comparable basis increased by 1% (0% in constant currency) to €480 million (Q2/18: €473 million). Reported Group net income2,3 was €471 million. Earnings per share2 before special items were €0.85 including an IFRS 16 effect of -€0.01. Earnings per share1,2 on a comparable basis increased by 1% (0% in constant currency) to €0.86 (Q2/18: €0.85). Reported Earnings per share2,3 were €0.85.
In H1/19, Group net income2 before special items was €928 million including an IFRS 16 effect of -€17 million. Group net income1,2 on a comparable basis increased by 2% (0% in constant currency) to €945 million (H1/18: €924 million). Reported Group net income2,3 was €924 million. In H1/19, Earnings per share2 before special items were €1.67 including an IFRS 16 effect of -€0.03. Earnings per share1,2 on a comparable basis increased by 2% (0% in constant currency) to €1.70 (H1/18: €1.66). Reported Earnings per share2,3 were €1.66.
Continued investment in growth
2019 is an investment year for the Fresenius Group. Fresenius is making good progress in all of its investment initiatives to secure long-term sustainable growth. Spending on property, plant and equipment was €565 million (Q2/18: €451 million). This corresponds to 6% of sales. In H1/19, spending on property, plant and equipment was €1,006 million (H1/18: €831 million), primarily for the modernization and expansion of dialysis clinics, production facilities as well as hospitals and day clinics. This corresponds to 6% of sales.
Total acquisition spending was €234 million (Q2/18: €194 million) including the acquisition of Clínica Medellín in Colombia by Fresenius Helios, among others. In H1/19, total acquisition spending was €2,157 million (H1/18: €386 million), mainly for the acquisition of NxStage by Fresenius Medical Care.
1 On a comparable basis: Q2/19 and H1/19 before special items and adjusted for IFRS 16 effect;
Q2/18 and H1/18 adjusted for divestitures of Care Coordination activities at FMC
2 Net income attributable to shareholders of Fresenius SE & Co. KGaA
3 After special items and including IFRS 16 effect
Cash flow development
Group operating cash flow was €1,205 million including an IFRS 16 effect of €182 million. On a comparable basis, Group operating cash flow was €1,023 million (Q2/18: €1,020 million) with a margin of 11.7% (Q2/18: 12.2%). Free cash flow before acquisitions and dividends adjusted for IFRS 16 was €467 million (Q2/18: €580 million). Free cash flow after acquisitions and dividends adjusted for IFRS 16 was -€437 million (Q2/18: €1,331 million). The IFRS 16 effect amounts to €182 million respectively. Correspondingly, cash flow from financing activities decreased by €182 million.
In H1/19, Group operating cash flow was €1,494 million including an IFRS 16 effect of €353 million. On a comparable basis, Group operating cash flow was €1,141 million (H1/18: €1,256 million) with a margin of 6.6% (H1/18: 7.6%). Free cash flow before acquisitions and dividends adjusted for IFRS 16 was €128 million (H1/18: €425 million) mainly due to increasing investments. Free cash flow after acquisitions and dividends adjusted for IFRS 16 was -€2,719 million (H1/18: €942 million). The IFRS 16 effect amounts to €353 million respectively. Correspondingly, cash flow from financing activities decreased by €353 million.
Solid balance sheet structure
The Group’s total assets were €64,929 million including an IFRS 16 effect of €5,587 million. Adjusted for IFRS 16, Group total assets1 increased by 5% (4% in constant currency) to €59,342 million (Dec. 31, 2018: €56,703 million). Current assets1 remained flat (remained flat in constant currency) to €14,851 million (Dec. 31, 2018: €14,790 million). Non-current assets1 increased by 6% (6% in constant currency) to €44,491 million (Dec. 31, 2018: € 41,913 million).
Total shareholders’ equity was €25,382 million including an IFRS 16 effect of -€186 million. Adjusted for IFRS 16, total shareholders’ equity increased by 2% (2% in constant currency) to €25,568 million (Dec. 31, 2018: €25,008 million). The equity ratio was 39.1%. Adjusted for IFRS 16, the equity ratio was 43.1% (Dec. 31, 2018: 44.1%).
Group debt was €26,879 million including an IFRS 16 effect of €5,773 million. Adjusted for IFRS 16, Group debt increased by 11% to €21,106 million (11% in constant currency) (Dec. 31, 2018: € 18,984 million). Group net debt was €25,416 million including an IFRS 16 effect of €5,773 million. Adjusted for IFRS 16, Group net debt increased by 21% (21% in constant currency) to € 19,643 million (Dec. 31, 2018: € 16,275 million) mainly due to the acquisition of NxStage by Fresenius Medical Care.
As of June 30, 2019, the net debt/EBITDA ratio increased to 3.21x1,2,3,4 (December 31, 2018: 2.71x2,4). Including the IFRS 16 effect, the reported net debt/EBITDA ratio increased to 3.64x2,3,4.
1 Adjusted for IFRS 16 effect
2 At LTM average exchange rates for both net debt and EBITDA; pro forma closed acquisitions/divestitures
3 Including acquisition of NxStage
4 Before special items
For a detailed overview of special items and adjustments please see the reconciliation tables on pages 20-32.
Increased number of employees
As of June 30, 2019, the number of employees was 288,459 (Dec. 31, 2018: 276,750).
Business Segments
Fresenius Medical Care (Figures according to Fresenius Medical Care press release)
Fresenius Medical Care is the world's largest provider of products and services for individuals with renal diseases. As of June 30, 2019, Fresenius Medical Care was treating 339,550 patients in 3,996 dialysis clinics. Along with its core business, the company provides related medical services in the field of Care Coordination.
Adjusted for the Q2/18 contribution from the divested Care Coordination activities, the IFRS 16 effect and the contribution from NxStage, sales of Fresenius Medical Care increased by 8% (5% at constant currency) to €4,284 million (Q2/18: €3,956 million). Organic sales growth was 4%. Positive currency translation effects of 3% were mainly related to the U.S. dollar strengthening against the euro. In H1/19, sales adjusted for the H1/18 contribution from the divested Care Coordination activities, the IFRS 16 effect and the contribution from NxStage increased by 9% (5% at constant currency) to €8,409 million (H1/18: €7,680 million). Organic sales growth was 5%.
EBIT4 decreased by 12% (-17% in constant currency) to €491 million (Q2/19: €558 million) The EBIT margin4 decreased to 11.5% (Q2/18: 14.1%). A significant contributor was the reduction in patient attribution and a decreasing savings rate for ESCOs, based on recent reports for prior plan years (“ESCO effect”).
1 On an adjusted basis: before special items (transaction-related expenses, gain related to divestitures of Care Coordination activities, expenses associated with the cost optimization program), adjusted for IFRS 16 effect, excluding effects from NxStage transaction
2 Q2/18 and H1/18 adjusted for divestitures of Care Coordination activities
3 Net income attributable to shareholders of Fresenius Medical Care AG & Co. KGaA
4 Q2/18 and H1/18 before special items and after adjustments; Q2/19 and H1/19 before special items (transaction-related expenses, gain related to divestitures of Care Coordination activities, expenses associated with the cost optimization program), adjusted for IFRS 16 effect, excluding effects from NxStage transaction
For a detailed overview of special items and adjustments please see the reconciliation tables on pages 20-32.
In H1/19, EBIT6 decreased by 2% (-7% in constant currency) to €1,042 million (H1/18: €1,064 million). The EBIT margin4 decreased to 12.4% (H1/18: 13.9%).
Net income1,2 decreased by 9% (-14% in constant currency) to €279 million (Q2/18: €308 million). A significant contributor was the ESCO effect. In H1/19, net income1,2 decreased by 1% (-6% in constant currency) to €597 million (H1/18: €604 million).
Operating cash flow was €700 million3 (Q2/18: €656 million) with a margin of 16.0% (Q2/18: 15.6%). In H1/19, operating cash flow was €635 million (H1/18: €611 million) with a margin of 7.6% (H1/18: 7.5%).
For FY/19, Fresenius Medical Care expects adjusted sales to grow by 3% to 7%5,6 in constant currency. Adjusted net income1 is expected to develop in the range of -2% to +2%5,7 in constant currency.
For further information on the IFRS 16 reconciliation of Fresenius Medical Care, please see page 18 in the PDF document.
For further information, please see Fresenius Medical Care’s press release at www.freseniusmedicalcare.com.
1 Net income attributable to shareholders of Fresenius Medical Care AG & Co. KGaA
2 Q2/18 and H1/18 before special items and after adjustments; Q2/19 and H1/19 before special items (transaction-related expenses, gain related to divestitures of care coordination activities, expenses associated with the cost optimization program), adjusted for IFRS 16 effect, excluding effects from NxStage transaction
3 €852 million including an IFRS 16 effect of €152 million
4 €928 million including an IFRS 16 effect of €293 million
5 FY/18 before special items, Q2/18 and H1/18 adjusted for divestitures of Care Coordination activities;
FY/19 before special items (transaction-related expenses, gain related to divestitures of care coordination activities, expenses associated with the cost optimization program), adjusted for IFRS 16 effects, excluding effects from NxStage transaction
6 FY/18 base: €16,026 million
7 FY/18 base: €1,341 million
For a detailed overview of special items and adjustments please see the reconciliation tables on pages 20-32 in the PDF document.
Fresenius Kabi
Fresenius Kabi offers intravenously administered generic drugs, clinical nutrition and infusion therapies for seriously and chronically ill patients in the hospital and outpatient environments. The company is also a leading supplier of medical devices and transfusion technology products. In the biosimilars business, Fresenius Kabi develops products with a focus on oncology and autoimmune diseases.
Sales of Fresenius Kabi increased by 5% (5% in constant currency) to €1,691 million (Q2/18: €1,604 million). Organic sales growth was 4%. In H1/19, sales increased by 6% (4% in constant currency) to €3,392 million (H1/18: €3,207 million). Organic sales growth was 4%. Positive currency translation effects of 2% were mainly related to the U.S. dollar strengthening against the euro.
Sales in North America increased by 4% (organic growth: -1%) to €573 million (Q2/18: €549 million). In H1/19, sales in North America increased by 5% (organic growth:
-1%) to €1,196 million (H1/18: €1,140 million). The anticipated easing of shortage situations, intensified competition in individual molecules, and a prescribing trend towards non-opioids pain management were the main headwinds.
Sales in Europe grew by 2% (organic growth: 1%) to €572 million (Q2/18: €563 million). In H1/19, sales in Europe increased by 2% (organic growth: 2%) to €1,145 million (H1/18: €1,120 million).
Sales in Asia-Pacific increased by 15% (organic growth: 15%) to €374 million (Q2/18: €326 million). In H1/19, sales in Asia-Pacific increased by 14% (organic growth: 13%) to €715 million (H1/18: €627 million).
Sales in Latin America/Africa increased by 4% (organic growth: 13%) to €172 million (Q2/18: €166 million). In H1/19, sales in Latin America/Africa increased by 5% (organic growth: 15%) to €336 million (H1/18: €320 million).
EBIT1 increased by 7% (4% in constant currency) to €308 million (Q2/18: €289 million) with an EBIT margin1 of 18.2% (Q2/18: 18.0%). In H1/19, EBIT1 increased by 10% (6% in constant currency) to €611 million (H1/18: €557 million) with an EBIT margin1 of 18.0% (H1/18: 17.4%).
Net income1,2 increased by 14% (12% in constant currency) to €211 million (Q2/18: €185 million). In H1/19, net income1,2 increased by 17% (12% in constant currency) to €414 million (H1/18: €355 million).
Operating cash flow3 was €201 million (Q2/18: €228 million). The cash flow margin was 11.9% (Q2/18: 14.2%). In H1/19, operating cash flow3 was €333 million (H1/18: €454 million). The cash flow margin was 9.8% (H1/18: 14.2%).
Fresenius Kabi confirms its outlook for FY/19 and expects organic sales growth4 of 3% to 6% and EBIT growth5 in constant currency of 3% to 6%.
For further information on the IFRS 16 reconciliation of Fresenius Kabi, please see page 18 of the PDF document.
1 On a comparable basis: before special items and adjusted for IFRS 16 effect
2 Net income attributable to shareholders of Fresenius SE & Co. KGaA
3 Adjusted for IFRS 16 effect (operating cash flow after special items)
4 On a comparable basis: FY/18 base: €6,544 million; FY/19 before special items (acquisition-related expenses, revaluations of biosimilars contingent liabilities) and adjusted for IFRS 16 effect
5 On a comparable basis: FY/18 base: €1,139 million; FY/18 before special items; FY/19 before special items (acquisition-related expenses, revaluations of biosimilars contingent liabilities) and adjusted for IFRS 16 effect.
For a detailed overview of special items and adjustments please see the reconciliation tables on pages 20-32 of the PDF document.
Fresenius Helios
Fresenius Helios is Europe's leading private hospital operator. The company comprises Helios Germany and Helios Spain (Quirónsalud). Helios Germany operates 86 hospitals, ~125 outpatient centers and treats approximately 5.3 million patients annually. Quirónsalud operates 50 hospitals, 62 outpatient centers and around 300 occupational risk prevention centers, and treats approximately 13.3 million patients annually.
Sales of Fresenius Helios remained at previous year’s level (increased by 6%1 organic growth: 5%) to €2,349 million (Q2/18: €2,343 million). In H1/19, sales also remained at previous year’s level (increased by 5%1; organic growth: 4%) to €4,660 million (H1/18: €4,674 million).
Sales of Helios Germany decreased by 3% (increased by 5%1; organic growth: 5%) to €1,506 million (Q2/18: €1,547 million). Organic sales growth was positively influenced by pricing effects and a strong case mix. In H1/19, sales of Helios Germany decreased by 4% (increased by 3%1; organic growth: 3%) to €2,991 million (H1/18: €3,121 million).
Sales of Helios Spain increased by 6% (organic growth: 4%) to €842 million (Q2/18: €796 million) despite the negative effect related to the Easter holidays. In H1/19, sales of Helios Spain increased by 7% (organic growth: 6%) to €1,668 million (H1/18: €1,553 million).
1 Adjusted for the post-acute care business transferred to Fresenius Vamed as of July 1, 2018
2 Adjusted for IFRS 16 effect
3 Net income attributable to shareholders of Fresenius SE & Co. KGaA
For a detailed overview of special items and adjustments please see the reconciliation tables on pages 20-32 of the PDF document.
EBIT1 of Fresenius Helios decreased by 6% (-4% ) to €274 million (Q2/18: €293 million) with an EBIT margin of 11.7% (Q2/18: 12.5%). In H1/19, EBIT1 of Fresenius Helios decreased by 5% (-4%2) to €540 million (H1/18: €571 million) with an EBIT margin of 11.6% (H1/18: 12.2%).
EBIT1 of Helios Germany decreased by 8% (-4%2) to €154 million (Q2/18: €168 million) with an EBIT margin of 10.2% (Q2/18: 10.9%). In H1/19, EBIT1 of Helios Germany decreased by 12% (-10%2) to €303 million (H1/18: €345 million) with an EBIT margin of 10.1% (H1/18: 11.1%). Whilst EBIT and margin have further stabilized, investments for preparatory structural measures continue to weigh on Helios Germany’s financial performance.
Despite the negative Easter effect, EBIT1 of Helios Spain increased by 1% to €125 million (Q2/18: €124 million) with an EBIT margin of 14.8% (Q2/18: 15.6%). In H1/19, EBIT1 of Helios Spain increased by 7% to €244 million (H1/18: €227 million).
Net income1,3 decreased by 7% to €183 million (Q2/18: €197 million). In H1/19, net income1,3 also decreased by 7% to €359 million (H1/18: €388 million).
Operating cash flow1 was €197 million (Q2/18: €162 million) with a margin of 8.4% (Q2/18: 6.9%). In H1/19, operating cash flow1 was €288 million (H1/18: €259 million) with a margin of 6.2% (H1/18: 5.5%). The increase is mainly attributable to the decrease in days sales outstanding (DSO) at Helios Spain.
Fresenius Helios confirms its outlook for FY/19 and expects organic sales growth of 2% to 5% and an EBIT1 growth of -5% to -2%.
For further information on the IFRS 16 reconciliation of Fresenius Helios, please see page 18.
1 Adjusted for IFRS 16 effect
2 Adjusted for the post-acute care business transferred to Fresenius Vamed as of July 1, 2018
3 Net income attributable to shareholders of Fresenius SE & Co. KGaA
For a detailed overview of special items and adjustments please see the reconciliation tables on pages 20-32 of the PDF document.
Fresenius Vamed
Fresenius Vamed manages projects and provides services for hospitals and other health care facilities worldwide and is a leading post-acute care provider in Central Europe. The portfolio ranges along the entire value chain: from project development, planning, and turnkey construction, via maintenance and technical management to total operational management.
Sales of Fresenius Vamed increased by 76% (31%1) to €467 million (Q2/18: €266 million). Organic sales growth was 27%, acquisitions contributed 3%1 to growth. Positive currency translation effects increased sales by 1%. Sales in the service business grew by 106% (35%1) to €344 million (Q2/18: €167 million), supported by an intensified collaboration with Fresenius Helios. Sales of the project business increased by 24% to €123 million (Q2/18: €99 million). In H1/19, sales increased by 76% (32%1) to €907 million (H1/18: €515 million). Organic sales growth was 29%, acquisitions contributed 3%1 to growth. Both the service and the project business showed strong growth momentum.
EBIT2 increased by 67% to €20 million (Q2/18: €12 million) with an EBIT margin of 4.3% (Q2/18: 4.5%). EBIT2 additionally adjusted for the acquisition of Helios’ German post-acute care business was €8 million (-33% YoY) with an EBIT margin of 2.3% - the decrease was mainly driven by phasing effects in the project business. In H1/19, EBIT2 increased by 72% to €31 million (H1/18: €18 million) with an EBIT margin of 3.4% (H1/18: 3.5%). EBIT2 additionally adjusted for the acquisition of Helios’ German post-acute care business was €15 million (-17% YoY) with an EBIT margin of 2.2%.
Net income2,3 increased by 86% to €13 million (Q2/18: €7 million). In H1/19, net income2,3 increased by 73% to €19 million (H1/18: €11 million).
Order intake decreased by -41% to €115 million (Q2/18: €195 million) but increased by 9% to €498 million in H1/19 (H1/18: €455 million). As of June 30, 2019, order backlog was at €2,690 million (Dec 31, 2018: €2,420 million).
Operating cash flow2 decreased to -€42 million (Q2/18: -€14 million) with a margin of -9.0% (Q2/18: -5.3%). In H1/19, Operating cash flow2 decreased to -€65 million (H1/18:
-€56 million) with a margin of -7.2% (H1/18: -10.9%).
Fresenius Vamed confirms its outlook for FY/19 and expects organic sales growth of ~10% and EBIT growth2 of 15% to 20%.
For further information on the IFRS 16 reconciliation of Fresenius Vamed, please see page 18 of the PDF document.
1 Adjusted for German post-acute care business acquired from Fresenius Helios as of July 1, 2018
2 Adjusted for IFRS 16 effect
3 Net income attributable to shareholders of VAMED AG
For a detailed overview of special items and adjustments please see the reconciliation tables on pages 20-32 of the PDF document.
Conference Call
As part of the publication of the results for the second quarter 2019, a conference call will be held on July 30, 2019 at 1:30 p.m. CEDT (7:30 a.m. EDT). You are cordially invited to follow the conference call in a live broadcast over the Internet at www.fresenius.com/media-calendar. Following the call, a replay will be available on our website.
For additional information on the performance indicators used please refer to our website www.fresenius.com/alternative-performance-measures.
This release contains forward-looking statements that are subject to various risks and uncertainties. Future results could differ materially from those described in these forward-looking statements due to certain factors, e.g. changes in business, economic and competitive conditions, regulatory reforms, results of clinical trials, foreign exchange rate fluctuations, uncertainties in litigation or investigative proceedings, and the availability of financing. Fresenius does not undertake any responsibility to update the forward-looking statements in this release.
If no timeframe is specified, information refers to Q2/2019
1 Adjusted for IFRS 16 effect
2 Q2/18 and H1/18 adjusted for divestitures of Care Coordination activities at Fresenius Medical Care (FMC)
3 Net income attributable to shareholders of Fresenius SE & Co. KGaA
For a detailed overview of special items and adjustments please see the reconciliation tables on pages 20-32 of the PDF document.
Group sales growth guidance for 2019 raised
Based on the Group’s good H1/19 results and good prospects for the remainder of the year, Fresenius raises its 2019 Group sales growth guidance. Fresenius now projects sales growth1 of 4% to 7% in constant currency. Previously, Fresenius expected sales growth1 of 3% to 6% in constant currency. The company confirms its earnings guidance. Net income2,3 growth is expected to be ~0% in constant currency. The guidance for 2019 includes the related sales and dilutive earnings contributions of the NxStage acquisition.
Fresenius expects net debt/EBITDA4 at year-end to be around the upper-end of the original self-imposed target corridor of 2.5x to 3.0x. This includes the NxStage acquisition which is increasing the net debt/EBITDA ratio in 2019 by ~30 basis points and excludes IFRS 16 effects.
Due to the adoption of the IFRS 16 accounting standard (“IFRS 16 effect”), Fresenius’ self-imposed target corridor has shifted to 3.0x to 3.5x net debt/EBITDA on a reported basis.
1 On a comparable basis: FY/18 base: €33,009 million; FY/18 adjusted for divestitures of Care Coordination activities at FMC (H1/18); FY/19: adjusted for IFRS 16 effect
2 Net income attributable to shareholders of Fresenius SE & Co. KGaA
3 On a comparable basis: FY/18 base: €1,872 million; FY/18 before special items and adjusted for divestitures of Care Coordination activities at FMC (H1/18); FY/19: before special items (transaction-related expenses, revaluations of biosimilars contingent liabilities, gain related to divestitures of Care Coordination activities at FMC, expenses associated with the cost optimization program at FMC), adjusted for IFRS 16 effect
4 Both net debt and EBITDA calculated at expected annual average exchange rates; excluding further potential acquisitions
For a detailed overview of special items and adjustments please see the reconciliation tables on pages 20-32 of the PDF document.
6% sales growth1 in constant currency
Group sales were €8,761 million including an IFRS 16 effect of -€18 million. Group sales1 on a comparable basis increased by 8% (6% in constant currency) to €8,779 million (Q2/18: €8,124 million). Organic sales growth was 5%. Acquisitions/divestitures contributed net 1% to growth. In H1/19, Group sales were €17,256 million including an IFRS 16 effect of -€40 million. Group sales1 on a comparable basis increased by 8% (6% in constant currency) to €17,296 million (H1/18: €15,994 million). Organic sales growth was 5%. Acquisitions/divestitures contributed net 1% to growth. Positive currency translation effects of 2% were mainly driven by the U.S. dollar strengthening against the euro.
Net income2,3 growth in constant currency
Group EBITDA before special items was €1,703 million including an IFRS 16 effect of €242 million. Group EBITDA2 on a comparable basis decreased by 2% (-5% in constant currency) to €1,461 million (Q2/18: €1,495 million). In H1/19, Group EBITDA before special items was €3,404 million including an IFRS 16 effect of €462 million. Group EBITDA2 on a comparable basis increased by 2% (-1% in constant currency) to €2,942 million (H1/18: €2,889 million).
Group EBIT before special items was €1,118 million including an IFRS 16 effect of €37 million. Group EBIT2 on a comparable basis decreased by 5% (-7% in constant currency) to €1,081 million (Q2/18: €1,135 million). The EBIT margin2 on a comparable basis was 12.3% (Q2/18: 14.0%). A significant contributor was the reduction in patient attribution and a decreasing savings rate for ESCOs, based on recent reports for prior plan years (“ESCO effect”). Reported Group EBIT4 was €1,118 million. In H1/19, Group EBIT before special items was €2,248 million including an IFRS 16 effect of €56 million. Group EBIT2 on a comparable basis remained at previous year’s level (-3% in constant currency) at €2,192 million (H1/18: €2,185 million). The EBIT margin2 on a comparable basis was 12.7% (H1/18: 13.7%). Reported Group EBIT4 was €2,233 million.
Group net interest before special items was -€180 million including an IFRS 16 effect of -€58 million. On a comparable basis, net interest2 improved to -€122 million (Q2/18: -€140 million) mainly due to successful refinancing activities and lower interest rates. Reported Group net interest4 was -€179 million. In H1/19, Group net interest before special items was -€361 million including an IFRS 16 effect of -€106 million. On a comparable basis, net interest1 improved to -€255 million (H1/18: -€279 million). Reported Group net interest3 was -€363 million.
1 On a comparable basis: Q2/18 and H1/18 adjusted for divestitures of Care Coordination activities at FMC;
Q2/19 and H1/19 adjusted for IFRS 16 effect
2 On a comparable basis: Q2/19 and H1/19 before special items and adjusted for IFRS 16 effect;
Q2/18 and H1/18 adjusted for divestitures of Care Coordination activities at FMC
3 Net income attributable to shareholders of Fresenius SE & Co. KGaA
4 After special items and including IFRS 16 effect
For a detailed overview of special items and adjustments please see the reconciliation tables on pages 20-32 of the PDF document.
The Group tax rate before special items and adopting IFRS 16 was 22.8%. Group tax rate1 on a comparable basis was 22.8% (Q2/18: 23.3%). In H1/19, the Group tax rate before special items and adopting IFRS 16 was 23.1%. In H1/19, Group tax rate1 on a comparable basis was 23.1% (H1/18: 22.1%).
Noncontrolling interest before special items was €253 million including an IFRS 16 effect of €7 million. Noncontrolling interest1 on a comparable basis was €260 million (Q2/18:
€290 million). In H1/19, Noncontrolling interest before special items was €524 million including an IFRS 16 effect of €20 million. Noncontrolling interest1 on a comparable basis was €544 million (H1/18: €560 million), of which 93% was attributable to the Noncontrolling interest in Fresenius Medical Care.
Group net income2 before special items was €471 million including an IFRS 16 effect of -€9 million. Group net income1,2 on a comparable basis increased by 1% (0% in constant currency) to €480 million (Q2/18: €473 million). Reported Group net income2,3 was €471 million. Earnings per share2 before special items were €0.85 including an IFRS 16 effect of -€0.01. Earnings per share1,2 on a comparable basis increased by 1% (0% in constant currency) to €0.86 (Q2/18: €0.85). Reported Earnings per share2,3 were €0.85.
In H1/19, Group net income2 before special items was €928 million including an IFRS 16 effect of -€17 million. Group net income1,2 on a comparable basis increased by 2% (0% in constant currency) to €945 million (H1/18: €924 million). Reported Group net income2,3 was €924 million. In H1/19, Earnings per share2 before special items were €1.67 including an IFRS 16 effect of -€0.03. Earnings per share1,2 on a comparable basis increased by 2% (0% in constant currency) to €1.70 (H1/18: €1.66). Reported Earnings per share2,3 were €1.66.
Continued investment in growth
2019 is an investment year for the Fresenius Group. Fresenius is making good progress in all of its investment initiatives to secure long-term sustainable growth. Spending on property, plant and equipment was €565 million (Q2/18: €451 million). This corresponds to 6% of sales. In H1/19, spending on property, plant and equipment was €1,006 million (H1/18: €831 million), primarily for the modernization and expansion of dialysis clinics, production facilities as well as hospitals and day clinics. This corresponds to 6% of sales.
Total acquisition spending was €234 million (Q2/18: €194 million) including the acquisition of Clínica Medellín in Colombia by Fresenius Helios, among others. In H1/19, total acquisition spending was €2,157 million (H1/18: €386 million), mainly for the acquisition of NxStage by Fresenius Medical Care.
1 On a comparable basis: Q2/19 and H1/19 before special items and adjusted for IFRS 16 effect;
Q2/18 and H1/18 adjusted for divestitures of Care Coordination activities at FMC
2 Net income attributable to shareholders of Fresenius SE & Co. KGaA
3 After special items and including IFRS 16 effect
Cash flow development
Group operating cash flow was €1,205 million including an IFRS 16 effect of €182 million. On a comparable basis, Group operating cash flow was €1,023 million (Q2/18: €1,020 million) with a margin of 11.7% (Q2/18: 12.2%). Free cash flow before acquisitions and dividends adjusted for IFRS 16 was €467 million (Q2/18: €580 million). Free cash flow after acquisitions and dividends adjusted for IFRS 16 was -€437 million (Q2/18: €1,331 million). The IFRS 16 effect amounts to €182 million respectively. Correspondingly, cash flow from financing activities decreased by €182 million.
In H1/19, Group operating cash flow was €1,494 million including an IFRS 16 effect of €353 million. On a comparable basis, Group operating cash flow was €1,141 million (H1/18: €1,256 million) with a margin of 6.6% (H1/18: 7.6%). Free cash flow before acquisitions and dividends adjusted for IFRS 16 was €128 million (H1/18: €425 million) mainly due to increasing investments. Free cash flow after acquisitions and dividends adjusted for IFRS 16 was -€2,719 million (H1/18: €942 million). The IFRS 16 effect amounts to €353 million respectively. Correspondingly, cash flow from financing activities decreased by €353 million.
Solid balance sheet structure
The Group’s total assets were €64,929 million including an IFRS 16 effect of €5,587 million. Adjusted for IFRS 16, Group total assets1 increased by 5% (4% in constant currency) to €59,342 million (Dec. 31, 2018: €56,703 million). Current assets1 remained flat (remained flat in constant currency) to €14,851 million (Dec. 31, 2018: €14,790 million). Non-current assets1 increased by 6% (6% in constant currency) to €44,491 million (Dec. 31, 2018: € 41,913 million).
Total shareholders’ equity was €25,382 million including an IFRS 16 effect of -€186 million. Adjusted for IFRS 16, total shareholders’ equity increased by 2% (2% in constant currency) to €25,568 million (Dec. 31, 2018: €25,008 million). The equity ratio was 39.1%. Adjusted for IFRS 16, the equity ratio was 43.1% (Dec. 31, 2018: 44.1%).
Group debt was €26,879 million including an IFRS 16 effect of €5,773 million. Adjusted for IFRS 16, Group debt increased by 11% to €21,106 million (11% in constant currency) (Dec. 31, 2018: € 18,984 million). Group net debt was €25,416 million including an IFRS 16 effect of €5,773 million. Adjusted for IFRS 16, Group net debt increased by 21% (21% in constant currency) to € 19,643 million (Dec. 31, 2018: € 16,275 million) mainly due to the acquisition of NxStage by Fresenius Medical Care.
As of June 30, 2019, the net debt/EBITDA ratio increased to 3.21x1,2,3,4 (December 31, 2018: 2.71x2,4). Including the IFRS 16 effect, the reported net debt/EBITDA ratio increased to 3.64x2,3,4.
1 Adjusted for IFRS 16 effect
2 At LTM average exchange rates for both net debt and EBITDA; pro forma closed acquisitions/divestitures
3 Including acquisition of NxStage
4 Before special items
For a detailed overview of special items and adjustments please see the reconciliation tables on pages 20-32.
Business Segments
Fresenius Medical Care (Figures according to Fresenius Medical Care press release)
Fresenius Medical Care is the world's largest provider of products and services for individuals with renal diseases. As of June 30, 2019, Fresenius Medical Care was treating 339,550 patients in 3,996 dialysis clinics. Along with its core business, the company provides related medical services in the field of Care Coordination.
Adjusted for the Q2/18 contribution from the divested Care Coordination activities, the IFRS 16 effect and the contribution from NxStage, sales of Fresenius Medical Care increased by 8% (5% at constant currency) to €4,284 million (Q2/18: €3,956 million). Organic sales growth was 4%. Positive currency translation effects of 3% were mainly related to the U.S. dollar strengthening against the euro. In H1/19, sales adjusted for the H1/18 contribution from the divested Care Coordination activities, the IFRS 16 effect and the contribution from NxStage increased by 9% (5% at constant currency) to €8,409 million (H1/18: €7,680 million). Organic sales growth was 5%.
EBIT4 decreased by 12% (-17% in constant currency) to €491 million (Q2/19: €558 million) The EBIT margin4 decreased to 11.5% (Q2/18: 14.1%). A significant contributor was the reduction in patient attribution and a decreasing savings rate for ESCOs, based on recent reports for prior plan years (“ESCO effect”).
1 On an adjusted basis: before special items (transaction-related expenses, gain related to divestitures of Care Coordination activities, expenses associated with the cost optimization program), adjusted for IFRS 16 effect, excluding effects from NxStage transaction
2 Q2/18 and H1/18 adjusted for divestitures of Care Coordination activities
3 Net income attributable to shareholders of Fresenius Medical Care AG & Co. KGaA
4 Q2/18 and H1/18 before special items and after adjustments; Q2/19 and H1/19 before special items (transaction-related expenses, gain related to divestitures of Care Coordination activities, expenses associated with the cost optimization program), adjusted for IFRS 16 effect, excluding effects from NxStage transaction
For a detailed overview of special items and adjustments please see the reconciliation tables on pages 20-32.
In H1/19, EBIT6 decreased by 2% (-7% in constant currency) to €1,042 million (H1/18: €1,064 million). The EBIT margin4 decreased to 12.4% (H1/18: 13.9%).
Net income1,2 decreased by 9% (-14% in constant currency) to €279 million (Q2/18: €308 million). A significant contributor was the ESCO effect. In H1/19, net income1,2 decreased by 1% (-6% in constant currency) to €597 million (H1/18: €604 million).
Operating cash flow was €700 million3 (Q2/18: €656 million) with a margin of 16.0% (Q2/18: 15.6%). In H1/19, operating cash flow was €635 million (H1/18: €611 million) with a margin of 7.6% (H1/18: 7.5%).
For FY/19, Fresenius Medical Care expects adjusted sales to grow by 3% to 7%5,6 in constant currency. Adjusted net income1 is expected to develop in the range of -2% to +2%5,7 in constant currency.
For further information on the IFRS 16 reconciliation of Fresenius Medical Care, please see page 18 in the PDF document.
For further information, please see Fresenius Medical Care’s press release at www.freseniusmedicalcare.com.
1 Net income attributable to shareholders of Fresenius Medical Care AG & Co. KGaA
2 Q2/18 and H1/18 before special items and after adjustments; Q2/19 and H1/19 before special items (transaction-related expenses, gain related to divestitures of care coordination activities, expenses associated with the cost optimization program), adjusted for IFRS 16 effect, excluding effects from NxStage transaction
3 €852 million including an IFRS 16 effect of €152 million
4 €928 million including an IFRS 16 effect of €293 million
5 FY/18 before special items, Q2/18 and H1/18 adjusted for divestitures of Care Coordination activities;
FY/19 before special items (transaction-related expenses, gain related to divestitures of care coordination activities, expenses associated with the cost optimization program), adjusted for IFRS 16 effects, excluding effects from NxStage transaction
6 FY/18 base: €16,026 million
7 FY/18 base: €1,341 million
For a detailed overview of special items and adjustments please see the reconciliation tables on pages 20-32 in the PDF document.
Fresenius Kabi
Fresenius Kabi offers intravenously administered generic drugs, clinical nutrition and infusion therapies for seriously and chronically ill patients in the hospital and outpatient environments. The company is also a leading supplier of medical devices and transfusion technology products. In the biosimilars business, Fresenius Kabi develops products with a focus on oncology and autoimmune diseases.
Sales of Fresenius Kabi increased by 5% (5% in constant currency) to €1,691 million (Q2/18: €1,604 million). Organic sales growth was 4%. In H1/19, sales increased by 6% (4% in constant currency) to €3,392 million (H1/18: €3,207 million). Organic sales growth was 4%. Positive currency translation effects of 2% were mainly related to the U.S. dollar strengthening against the euro.
Sales in North America increased by 4% (organic growth: -1%) to €573 million (Q2/18: €549 million). In H1/19, sales in North America increased by 5% (organic growth:
-1%) to €1,196 million (H1/18: €1,140 million). The anticipated easing of shortage situations, intensified competition in individual molecules, and a prescribing trend towards non-opioids pain management were the main headwinds.
Sales in Europe grew by 2% (organic growth: 1%) to €572 million (Q2/18: €563 million). In H1/19, sales in Europe increased by 2% (organic growth: 2%) to €1,145 million (H1/18: €1,120 million).
Sales in Asia-Pacific increased by 15% (organic growth: 15%) to €374 million (Q2/18: €326 million). In H1/19, sales in Asia-Pacific increased by 14% (organic growth: 13%) to €715 million (H1/18: €627 million).
Sales in Latin America/Africa increased by 4% (organic growth: 13%) to €172 million (Q2/18: €166 million). In H1/19, sales in Latin America/Africa increased by 5% (organic growth: 15%) to €336 million (H1/18: €320 million).
EBIT1 increased by 7% (4% in constant currency) to €308 million (Q2/18: €289 million) with an EBIT margin1 of 18.2% (Q2/18: 18.0%). In H1/19, EBIT1 increased by 10% (6% in constant currency) to €611 million (H1/18: €557 million) with an EBIT margin1 of 18.0% (H1/18: 17.4%).
Net income1,2 increased by 14% (12% in constant currency) to €211 million (Q2/18: €185 million). In H1/19, net income1,2 increased by 17% (12% in constant currency) to €414 million (H1/18: €355 million).
Operating cash flow3 was €201 million (Q2/18: €228 million). The cash flow margin was 11.9% (Q2/18: 14.2%). In H1/19, operating cash flow3 was €333 million (H1/18: €454 million). The cash flow margin was 9.8% (H1/18: 14.2%).
Fresenius Kabi confirms its outlook for FY/19 and expects organic sales growth4 of 3% to 6% and EBIT growth5 in constant currency of 3% to 6%.
For further information on the IFRS 16 reconciliation of Fresenius Kabi, please see page 18 of the PDF document.
1 On a comparable basis: before special items and adjusted for IFRS 16 effect
2 Net income attributable to shareholders of Fresenius SE & Co. KGaA
3 Adjusted for IFRS 16 effect (operating cash flow after special items)
4 On a comparable basis: FY/18 base: €6,544 million; FY/19 before special items (acquisition-related expenses, revaluations of biosimilars contingent liabilities) and adjusted for IFRS 16 effect
5 On a comparable basis: FY/18 base: €1,139 million; FY/18 before special items; FY/19 before special items (acquisition-related expenses, revaluations of biosimilars contingent liabilities) and adjusted for IFRS 16 effect.
For a detailed overview of special items and adjustments please see the reconciliation tables on pages 20-32 of the PDF document.
Fresenius Helios
Fresenius Helios is Europe's leading private hospital operator. The company comprises Helios Germany and Helios Spain (Quirónsalud). Helios Germany operates 86 hospitals, ~125 outpatient centers and treats approximately 5.3 million patients annually. Quirónsalud operates 50 hospitals, 62 outpatient centers and around 300 occupational risk prevention centers, and treats approximately 13.3 million patients annually.
Sales of Fresenius Helios remained at previous year’s level (increased by 6%1 organic growth: 5%) to €2,349 million (Q2/18: €2,343 million). In H1/19, sales also remained at previous year’s level (increased by 5%1; organic growth: 4%) to €4,660 million (H1/18: €4,674 million).
Sales of Helios Germany decreased by 3% (increased by 5%1; organic growth: 5%) to €1,506 million (Q2/18: €1,547 million). Organic sales growth was positively influenced by pricing effects and a strong case mix. In H1/19, sales of Helios Germany decreased by 4% (increased by 3%1; organic growth: 3%) to €2,991 million (H1/18: €3,121 million).
Sales of Helios Spain increased by 6% (organic growth: 4%) to €842 million (Q2/18: €796 million) despite the negative effect related to the Easter holidays. In H1/19, sales of Helios Spain increased by 7% (organic growth: 6%) to €1,668 million (H1/18: €1,553 million).
1 Adjusted for the post-acute care business transferred to Fresenius Vamed as of July 1, 2018
2 Adjusted for IFRS 16 effect
3 Net income attributable to shareholders of Fresenius SE & Co. KGaA
For a detailed overview of special items and adjustments please see the reconciliation tables on pages 20-32 of the PDF document.
EBIT1 of Fresenius Helios decreased by 6% (-4% ) to €274 million (Q2/18: €293 million) with an EBIT margin of 11.7% (Q2/18: 12.5%). In H1/19, EBIT1 of Fresenius Helios decreased by 5% (-4%2) to €540 million (H1/18: €571 million) with an EBIT margin of 11.6% (H1/18: 12.2%).
EBIT1 of Helios Germany decreased by 8% (-4%2) to €154 million (Q2/18: €168 million) with an EBIT margin of 10.2% (Q2/18: 10.9%). In H1/19, EBIT1 of Helios Germany decreased by 12% (-10%2) to €303 million (H1/18: €345 million) with an EBIT margin of 10.1% (H1/18: 11.1%). Whilst EBIT and margin have further stabilized, investments for preparatory structural measures continue to weigh on Helios Germany’s financial performance.
Despite the negative Easter effect, EBIT1 of Helios Spain increased by 1% to €125 million (Q2/18: €124 million) with an EBIT margin of 14.8% (Q2/18: 15.6%). In H1/19, EBIT1 of Helios Spain increased by 7% to €244 million (H1/18: €227 million).
Net income1,3 decreased by 7% to €183 million (Q2/18: €197 million). In H1/19, net income1,3 also decreased by 7% to €359 million (H1/18: €388 million).
Operating cash flow1 was €197 million (Q2/18: €162 million) with a margin of 8.4% (Q2/18: 6.9%). In H1/19, operating cash flow1 was €288 million (H1/18: €259 million) with a margin of 6.2% (H1/18: 5.5%). The increase is mainly attributable to the decrease in days sales outstanding (DSO) at Helios Spain.
Fresenius Helios confirms its outlook for FY/19 and expects organic sales growth of 2% to 5% and an EBIT1 growth of -5% to -2%.
For further information on the IFRS 16 reconciliation of Fresenius Helios, please see page 18.
1 Adjusted for IFRS 16 effect
2 Adjusted for the post-acute care business transferred to Fresenius Vamed as of July 1, 2018
3 Net income attributable to shareholders of Fresenius SE & Co. KGaA
For a detailed overview of special items and adjustments please see the reconciliation tables on pages 20-32 of the PDF document.
Fresenius Vamed
Fresenius Vamed manages projects and provides services for hospitals and other health care facilities worldwide and is a leading post-acute care provider in Central Europe. The portfolio ranges along the entire value chain: from project development, planning, and turnkey construction, via maintenance and technical management to total operational management.
Sales of Fresenius Vamed increased by 76% (31%1) to €467 million (Q2/18: €266 million). Organic sales growth was 27%, acquisitions contributed 3%1 to growth. Positive currency translation effects increased sales by 1%. Sales in the service business grew by 106% (35%1) to €344 million (Q2/18: €167 million), supported by an intensified collaboration with Fresenius Helios. Sales of the project business increased by 24% to €123 million (Q2/18: €99 million). In H1/19, sales increased by 76% (32%1) to €907 million (H1/18: €515 million). Organic sales growth was 29%, acquisitions contributed 3%1 to growth. Both the service and the project business showed strong growth momentum.
EBIT2 increased by 67% to €20 million (Q2/18: €12 million) with an EBIT margin of 4.3% (Q2/18: 4.5%). EBIT2 additionally adjusted for the acquisition of Helios’ German post-acute care business was €8 million (-33% YoY) with an EBIT margin of 2.3% - the decrease was mainly driven by phasing effects in the project business. In H1/19, EBIT2 increased by 72% to €31 million (H1/18: €18 million) with an EBIT margin of 3.4% (H1/18: 3.5%). EBIT2 additionally adjusted for the acquisition of Helios’ German post-acute care business was €15 million (-17% YoY) with an EBIT margin of 2.2%.
Net income2,3 increased by 86% to €13 million (Q2/18: €7 million). In H1/19, net income2,3 increased by 73% to €19 million (H1/18: €11 million).
Order intake decreased by -41% to €115 million (Q2/18: €195 million) but increased by 9% to €498 million in H1/19 (H1/18: €455 million). As of June 30, 2019, order backlog was at €2,690 million (Dec 31, 2018: €2,420 million).
Operating cash flow2 decreased to -€42 million (Q2/18: -€14 million) with a margin of -9.0% (Q2/18: -5.3%). In H1/19, Operating cash flow2 decreased to -€65 million (H1/18:
-€56 million) with a margin of -7.2% (H1/18: -10.9%).
Fresenius Vamed confirms its outlook for FY/19 and expects organic sales growth of ~10% and EBIT growth2 of 15% to 20%.
For further information on the IFRS 16 reconciliation of Fresenius Vamed, please see page 18 of the PDF document.
1 Adjusted for German post-acute care business acquired from Fresenius Helios as of July 1, 2018
2 Adjusted for IFRS 16 effect
3 Net income attributable to shareholders of VAMED AG
For a detailed overview of special items and adjustments please see the reconciliation tables on pages 20-32 of the PDF document.
Conference Call
As part of the publication of the results for the second quarter / first half of 2019, a conference call will be held on July 30, 2019 at 1:30 p.m. CEDT (7:30 a.m. EDT). All investors are cordially invited to follow the conference call in a live broadcast over the Internet at www.fresenius.com/investors. Following the call, a replay will be available on our website.
For additional information on the performance indicators used please refer to our website www.fresenius.com/alternative-performance-measures.
This release contains forward-looking statements that are subject to various risks and uncertainties. Future results could differ materially from those described in these forward-looking statements due to certain factors, e.g. changes in business, economic and competitive conditions, regulatory reforms, results of clinical trials, foreign exchange rate fluctuations, uncertainties in litigation or investigative proceedings, and the availability of financing. Fresenius does not undertake any responsibility to update the forward-looking statements in this release.
Standard & Poor’s has revised Fresenius’ corporate credit rating to BBB with a stable outlook from BBB- with a positive outlook. Fresenius is rated investment grade by the three leading rating agencies Standard & Poor’s (BBB/stable), Moody's (Baa3/stable) and Fitch (BBB-/stable).
Fresenius remains on course for growth despite some recent challenges, Stephan Sturm, CEO of Fresenius, told the Annual General Meeting in Frankfurt today. “2018 was not an easy year, and yet it was a successful one,” he said in a speech to shareholders. “Fresenius is in very good shape. All indications point to continued, profitable growth.”
The basis for this will be increased investments in the current business year, Sturm said. He confirmed the global healthcare group’s ambitious targets1 for 2020 to 2023 of organic sales growth averaging 4 to 7 percent annually and an average increase in net income2 of 5 to 9 percent.
“What we do is more important than ever,” Sturm said. “The healthcare market is growing. People are living longer, and around the world the demand for high-quality medicine is rising. Needs and expectations are also changing: It is no longer about preserving lives, but about raising quality of life for people well into old age. It is also about keeping quality healthcare affordable. These are big challenges! But challenges that we are superbly positioned to meet.”
1 Before special items
2 Net income attributable to shareholders of Fresenius SE & Co. KGaA
Shareholders approved with a majority of 90.96 percent the proposal of the General Partner and the Supervisory Board to increase the dividend for the 26th consecutive time. It was raised by 7 percent, to €0.80 per share.
Shareholder majorities of 98.49 percent and 87.53 percent, respectively, approved the actions of the Management and Supervisory Boards in 2018.
At the Annual General Meeting, 72.46 percent of the subscribed capital was represented.
This release contains forward-looking statements that are subject to various risks and uncertainties. Future results could differ materially from those described in these forward-looking statements due to certain factors, e.g. changes in business, economic and competitive conditions, regulatory reforms, results of clinical trials, foreign exchange rate fluctuations, uncertainties in litigation or investigative proceedings, and the availability of financing. Fresenius does not undertake any responsibility to update the forward-looking statements in this release.
1 Adjusted for IFRS 16 effect
2 Q1/18 adjusted for divestitures of Care Coordination activities at FMC
3 Net income attributable to shareholders of Fresenius SE & Co. KGaA
Stephan Sturm, CEO of Fresenius, said: “We have made a successful start into 2019. All four Fresenius business segments have developed in line with our expectations, putting us well on course to meet our targets for the year. High-quality, yet affordable healthcare for ever more patients worldwide is our commitment. Consistent organic growth and major investments into key growth areas continue to reinforce our delivery of that commitment. Those strong foundations will also ensure the long-term success of our business.”
Group guidance for 2019 confirmed
After closing the NxStage acquisition on February 21, the related sales and earnings contributions are now included in the Group guidance. Despite the expected earnings dilution from NxStage, Fresenius confirms its FY/19 guidance. Fresenius projects sales growth1 of 3% to 6% in constant currency. Net income2,3 growth is expected to be ~0% in constant currency.
Including the NxStage acquisition which is increasing the net debt/EBITDA ratio in 2019 by ~30 basis points and excluding IFRS 16, Fresenius now expects year-end 2019 net debt/EBITDA ratio to be at the upper-end of the original self-imposed target corridor of 2.5 to 3.0x.
Due to the adoption of the IFRS 16 accounting standard (“IFRS 16 effect”), Fresenius increases its self-imposed target corridor of 2.5x to 3.0x net debt/EBITDA to 3.0x to 3.5x.
1 On a comparable basis: FY/18 base: €33,009 million; FY/18 adjusted for divestitures of Care Coordination activities at FMC (H1/18); FY/19: adjusted for IFRS 16 effect
2 Net income attributable to shareholders of Fresenius SE & Co. KGaA
3 On a comparable basis: FY/18 base: €1,872 million; FY/18 before special items and adjusted for divestitures of Care Coordination activities at FMC (H1/18); FY/19: before special items (transaction-related expenses, expenses associated with the cost optimization program at FMC, revaluations of biosimilars contingent liabilities); adjusted for IFRS 16 effect
4 Both net debt and EBITDA calculated at expected annual average exchange rates; excluding further potential acquisitions
5% sales growth1 in constant currency
Group sales were €8,495 million including an IFRS 16 effect of -€22 million. Group sales1 on a comparable basis increased by 8% (5% in constant currency) to €8,517 million (Q1/18: €7,870 million). Organic sales growth was 5%. Acquisitions/divestitures contributed net 0% to growth. Positive currency translation effects of 3% were mainly driven by the appreciation of the U.S. dollar against the euro.
Group sales by region:
1 On a comparable basis: Q1/18 adjusted for divestitures of Care Coordination activities at FMC; Q1/19 adjusted for IFRS 16 effect
Net income1,2 growth flat in constant currency
Group EBITDA before special items was €1,701 million including an IFRS 16 effect of €220 million. Group EBITDA2 on a comparable basis increased by 6% (3% in constant currency) to €1,481 million (Q1/18: €1,394 million).
Group EBIT before special items was €1,130 million including an IFRS 16 effect of €19 million. Group EBIT2 on a comparable basis increased by 6% (2% in constant currency) to €1,111 million (Q1/18: €1,050 million). The EBIT margin2 on a comparable basis was 13.0% (Q1/18: 13.3%). Reported Group EBIT was €1,115 million.
Group net interest before special items was -€181 million including an IFRS 16 effect of -€48 million. On a comparable basis, net interest2 improved to -€133 million (Q1/18: -€139 million) mainly due to lower rates for refinancing activities. Reported Group net interest was -€184 million.
Group tax rate before special items and adopting IFRS 16 was 23.3%. Group tax rate2 on a comparable basis was 23.4% (Q1/18: 20.9%). The prior-year was positively influenced by one-time effects related to the adoption of the U.S. tax reform.
Noncontrolling interest before special items was €271 million including an IFRS 16 effect of €13 million. Noncontrolling interest2 on a comparable basis was €284 million (Q1/18: €270 million), of which 94% was attributable to the noncontrolling interest in Fresenius Medical Care.
Group net income1 before special items was €457 million including an IFRS 16 effect of -€8 million. Group net income1,2 on a comparable basis increased by 3% (0% in constant currency) to €465 million (Q1/18: €451million). Reported Group net income1,3 was €453 million.
Earnings per share1 before special items was €0.82 including an IFRS 16 effect of -€0.02.
Earnings per share1 before special items was €0.82 including an IFRS 16 effect of -€0.02. Earnings per share1,2 on a comparable basis increased by 3% (0% in constant currency) to €0.84 (Q1/18: €0.81). Reported Earnings per share1,3 was €0.81.
1 Net income attributable to shareholders of Fresenius SE & Co. KGaA
2 On a comparable basis: Q1/19 before special items and adjusted for IFRS 16 effect; Q1/18 adjusted for divestitures of Care Coordination activities at FMC
3 After special items and including IFRS 16 effect
Continued investment in growth
2019 is an investment year for the Fresenius Group. Fresenius is making good progress in all of its investment initiatives to secure long-term sustainable growth. Spending on property, plant and equipment was €441 million (Q1/18: €380 million), primarily for the modernization and expansion of dialysis clinics, production facilities as well as hospitals and day clinics. This corresponds to 5% of sales.
Total acquisition spending was €1,923 million (Q1/18: €192 million), mainly for the acquisition of NxStage.
Cash flow development
Group operating cash flow was €289 million including an IFRS 16 effect of €171 million. On a comparable basis, Group operating cash flow was €118 million (Q1/18: €236 million) with a margin of 1.4% (Q1/18: 2.9%). After a strong Q4/18, operating cash flow was impacted by working capital changes at Fresenius Kabi, for example by some phasing of payments and stockbuild to prepare for a possible Brexit. Moreover, as in previous years’ first quarters, operating cash flow was influenced by the seasonality in invoicing at Fresenius Medical Care North America. Fresenius does not expect these temporary effects to have a significant impact on FY/19 cash flow.
Given the effects described above in combination with increasing investments, free cash flow before acquisitions and dividends adjusted for IFRS 16 was -€339 million (Q1/18: - €155 million). Free cash flow after acquisitions and dividends adjusted for IFRS 16 was -€2,282 million (Q1/18: -€389 million). The IFRS 16 effect amounts to €171 million respectively. Correspondingly, cash flow from financing activities declined by €171 million.
Solid balance sheet structure
The Group’s total assets were €64,985 million including an IFRS 16 effect of €5,669 million. Adjusted for IFRS 16, Group total assets1 increased by 5% (3% in constant currency) to €59,316 million (Dec. 31, 2018: €56,703 million). Current assets1 grew by 1% (0% in constant currency) to €14,958 million (Dec. 31, 2018: €14,790 million). Non-current assets1 increased by 6% (5% in constant currency) to €44,358 million (Dec. 31, 2018: € 41,913 million).
Total shareholders’ equity was €25,830 million including an IFRS 16 effect of -€167 million. Adjusted for IFRS 16, total shareholders’ equity1 increased by 4% (2% in constant currency) to €25,997 million (Dec. 31, 2018: €25,008 million). The equity ratio was 39.7%. Adjusted for IFRS 16, the equity ratio was 43.8% (Dec. 31, 2018: 44.1%).
Group debt was €26,378 million including an IFRS 16 effect of €5,836 million. Adjusted for IFRS 16, Group debt1 increased by 8% to €20,542 million (8% in constant currency) (Dec. 31, 2018: € 18,984 million). Group net debt was €24,835 million including an IFRS 16 effect of €5,836 million. Adjusted for IFRS 16, Group net debt1 increased by 17% (16% in constant currency) to € 18,999 million (Dec. 31, 2018: € 16,275 million) mainly due to the acquisition of NxStage by Fresenius Medical Care and the negative free cash flow.
As of March 31, 2019, the net debt/EBITDA ratio increased to 3.091,2,3 (December 31, 2018: 2.712,3). Excluding the acquisition of NxStage the net debt/EBITDA ratio was 2.831,2,3 as of March 31, 2019. Including the IFRS 16 effect, the reported net debt/EBITDA ratio increased to 3.532,3.
1 Adjusted for IFRS 16 effect
2 At LTM average exchange rates for both net debt and EBITDA; pro forma closed acquisitions/divestitures
3 Before special items
Increased number of employees
As of March 31, 2019, the number of employees was 283,795 (Dec. 31, 2018: 276,750).
Business Segments
Fresenius Medical Care (Figures according to Fresenius Medical Care Investor News)
Fresenius Medical Care is the world's largest provider of products and services for individuals with renal diseases. As of March 31, 2019, Fresenius Medical Care was treating 336,716 patients in 3,971 dialysis clinics. Along with its core business, the company provides related medical services in the field of Care Coordination.
Adjusted for the Q1/18 contribution from the divested Care Coordination activities, the effect of the adoption of the IFRS 16 accounting standard (“IFRS 16 effect”) and the contribution from NxStage, sales increased by 11% (6% at constant currency) to €4,125 million (Q1/18: €3,725 million). Organic sales growth was 6%. Positive currency translation effects of 5% were mainly related to the appreciation of the U.S. dollar against the euro.
Health Care Services sales1,2 increased by 12% (6% at constant currency) to €3,316 million (Q1/18: €2,958 million). Health Care Products sales1,2 increased by 5% (4% at constant currency) to €809 million (Q1/18: €767 million).
In North America, sales1,2 increased by 14% (5% in constant currency) to €2,879 million (Q1/18: €2,523 million). Health Care Services sales1,2 increased by 14% (6% in constant currency) to €2,679 million (Q1/18: €2,339 million).
1 On an adjusted basis: before expenses associated with the cost optimization program, the IFRS 16 effect, excluding effects from NxStage transaction
2 Q1/18 adjusted for divestitures of Care Coordination activities
3 Net income attributable to shareholders of Fresenius Medical Care AG & Co. KGaA
Sales2 outside North America increased by 4% (6% in constant currency) to €1,246 million (Q1/18: €1,202 million). Health Care Services sales2 increased by 3% (8% in constant currency) to €637 million (Q1/18: €619 million). Health Care Product sales2 adjusted increased by 4% (5% in constant currency) to €609 million (Q1/18: €583 million).
Fresenius Medical Care’s EBIT3 increased by 9% (4% in constant currency) to €551 million (Q1/18: €506 million). The EBIT margin3 decreased to 13.4% (Q1/18: 13.6%).
Net income1,3 increased by 8% (3% in constant currency) to €318 million (Q1/18: €296 million).
Operating cash flow was €76 million (Q1/18: -€45 million) with a margin of 1.8% (Q1/18: -1.1%). The increase was mainly driven by the adoption of the IFRS 16 accounting standard leading to a reclassification of the repayment portion of rent to financing activities (€141 million). Adjusted for the IFRS 16 effect, operating cash flow was -€65 million.
For FY/19, Fresenius Medical Care expects adjusted sales to grow by 3% to 7% ,6 in constant currency. Net income1 is expected to develop in the range of -2% to +2% ,7 in constant currency.
For further information, please see Fresenius Medical Care’s Investor News at www.freseniusmedicalcare.com.
1 Net income attributable to shareholders of Fresenius Medical Care AG & Co. KGaA
2 Q1/18 adjusted for divestitures of Care Coordination activities; Q1/19 adjusted for IFRS 16 effects, excluding effects from NxStage transaction
3 Q1/18 before special items and after adjustments; Q1/19 before special items (before transaction-related expenses, expenses associated with the cost optimization program), adjusted for IFRS 16 effect, excluding effects from NxStage transaction
4 Before special items (operating cash flow after special items)
5 Adjusted for IFRS 16 effect
6 FY/18 base: €16,026 million
7 FY/18 base: €1,341 million
Fresenius Kabi
Fresenius Kabi offers intravenously administered generic drugs, clinical nutrition and infusion therapies for seriously and chronically ill patients in the hospital and outpatient environments. The company is also a leading supplier of medical devices and transfusion technology products. In the biosimilars business, Fresenius Kabi develops products with a focus on oncology and autoimmune diseases.
Sales increased by 6% (4% in constant currency) to €1,701 million (Q1/18: €1,603 million). Organic sales growth was 4%. Positive currency translation effects of 2% were mainly related to the appreciation of the U.S. dollar against the euro.
Sales in Europe grew by 3% (organic growth: 3%) to €573 million (Q1/18: €557 million). Sales in North America increased by 5% (decreased organically by 2% from a high prior-year basis) to €623 million (Q1/18: €591 million). Sales in Asia-Pacific increased by 13% (organic growth: 11%) to €341 million (Q1/18: €301 million). Sales in Latin America/Africa increased by 6% (organic growth: 18%) to €164 million (Q1/18: €154 million).
EBIT1 increased by 13% (7% in constant currency) to €303 million (Q1/18: €268 million) with an EBIT margin1 of 17.8% (Q1/18: 16.7%).
Net income1,2 increased by 19% (12% in constant currency) to €203 million (Q1/18: €170 million).
Operating cash flow3 was €132 million (Q1/18: €226 million). After a strong Q4/18, operating cash flow was impacted by working capital changes, for example by some phasing of payments and stockbuild to prepare for a possible Brexit. The cash flow margin was 7.8% (Q1/18: 14.1%).
Fresenius Kabi confirms its outlook for FY/19 and expects organic sales growth4 of 3% to 6% and EBIT growth5 in constant currency of 3% to 6%.
1 On a comparable basis: before special items and adjusted for IFRS 16 effect
2 Net income attributable to shareholders of Fresenius SE & Co. KGaA
3 Adjusted for IFRS 16 effect, before special items (operating cash flow after special items)
4 On a comparable basis: FY/18 base: €6,544 million; FY/19 before special items (acquisition-related expenses, revaluations of biosimilars contingent liabilities) and adjusted for IFRS 16 effect
5 On a comparable basis: FY/18 base: €1,139 million; FY/18 before special items; FY/19 before special items (acquisition-related expenses, revaluations of biosimilars contingent liabilities) and adjusted for IFRS 16 effect.
Fresenius Helios
Fresenius Helios is Europe's leading private hospital operator. The company comprises Helios Germany and Helios Spain (Quirónsalud). Helios Germany operates 86 hospitals, ~125 outpatient centers and treats approximately 5.3 million patients annually. Quirónsalud operates 47 hospitals, 56 outpatient centers and around 300 occupational risk prevention centers, and treats approximately 13.3 million patients annually.
Sales decreased by 1% (increased by 4%1; organic growth: 4%) to €2,311 million (Q1/18: €2,331 million).
Sales of Helios Germany decreased by 6% (increased by 1%1; organic growth: 2%) to €1,485 million (Q1/18: €1,574 million). Sales were impacted by a decline in admissions in Germany, partially due to the transfer of the post-acute care business from Helios to Vamed, a shortage of nurses at selected intensive care units and a less pronounced flu season. The admission decline was more than compensated by positive price effects.
Helios Spain increased sales by 9% (organic growth: 9%) to €826 million (Q1/18: €757 million), mainly driven by the private sector. The occupational risk prevention business also had a valuable contribution. Performance in Q1/18 was impacted by the Easter holidays.
1 Adjusted for the post-acute care business transferred to Fresenius Vamed as of July 1, 2018
2 Adjusted for IFRS 16 effect
3 Net income attributable to shareholders of Fresenius SE & Co. KGaA
EBIT1 of Fresenius Helios decreased by 4% (-3%2) to €266 million (Q1/18: €278 million) with an EBIT margin of 11.5% (Q1/18: 11.9%).
EBIT1 of Helios Germany decreased by 16% (-14%2) to €149 million (Q1/18: €177 million). The EBIT margin improved sequentially by 50 bps to 10.0% (Q4/18: 9.5%). The development of Helios Germany is impacted by the admissions decline and the investments for preparatory structural measures.
EBIT1 of Helios Spain increased by 16% to €119 million (Q1/18: €103 million), mainly due to the strong operating performance with an EBIT margin of 14.4% (Q1/18: 13.6%).
Net income1,3 decreased by 8% to €176 million (Q1/18: €191 million).
Operating cash flow1 was €91 million (Q1/18: €97 million) with a margin of 3.9% (Q1/18: 4.2%). The decrease is mainly attributable to the increase in days sales outstanding (DSO).
Fresenius Helios confirms its outlook for FY/19 and expects organic sales growth of 2% to 5% and an EBIT1 growth of -5% to -2%.
1 Adjusted for IFRS 16 effect
2 Adjusted for the post-acute care business transferred to Fresenius Vamed as of July 1, 2018
3 Net income attributable to shareholders of Fresenius SE & Co. KGaA
Fresenius Vamed
Fresenius Vamed manages projects and provides services for hospitals and other health care facilities worldwide and is a leading post-acute care provider in Central Europe. The portfolio ranges along the entire value chain: from project development, planning, and turnkey construction, via maintenance and technical management to total operational management.
Sales increased by 77% (33%1) to €440 million (Q1/18: €249 million). Organic sales growth was 31%, acquisitions contributed 2% to growth. Both the project and the service business showed strong momentum. Sales of the project business increased by 17% to €108 million (Q1/18: €92 million). Sales in the service business grew by 111% (41%1) to €332 million (Q1/18: €157 million), supported by an intensified collaboration with Fresenius Helios.
In Q1/19, EBIT2 increased by 83% (83%2 in constant currency) to €11 million (Q1/18: €6 million) with an EBIT margin of 2.5% (Q1/18: 2.4%). EBIT2 additionally adjusted for the acquisition of the German post-acute care business was €7 million with an EBIT margin of 2.1%.
Net income2,3 increased by 50% to €6 million (Q1/18: €4 million).
Order intake increased by 47% to €383 million (Q1/18: €260 million). As of March 31, 2019, order backlog reached a new all-time high of €2,698 million (Dec 31, 2018: €2,420 million).
Operating cash flow2 increased by 45% to €-23 million (Q1/18: €-42 million) with a margin of -5.2% (Q1/18: -16.9%).
Fresenius Vamed confirms its outlook for FY/19 and expects organic sales growth of ~10% and EBIT growth2 of 15% to 20%.
1 Adjusted for German post-acute care business acquired from Fresenius Helios as of July 1, 2018
2 Adjusted for IFRS 16 effect
3 Net income attributable to shareholders of VAMED AG
Conference Call
As part of the publication of the results for the first quarter 2019, a conference call will be held on May 2, 2019 at 1:30 p.m. CET (7:30 a.m. EST). You are cordially invited to follow the conference call in a live broadcast over the Internet at www.fresenius.com/media-calendar. Following the call, a replay will be available on our website.
For a detailed overview of special items and adjustments please see the reconciliation tables on pages 19-22 of the PDF file.
For additional information on the performance indicators used please refer to our website www.fresenius.com/alternative-performance-measures.
This release contains forward-looking statements that are subject to various risks and uncertainties. Future results could differ materially from those described in these forward-looking statements due to certain factors, e.g. changes in business, economic and competitive conditions, regulatory reforms, results of clinical trials, foreign exchange rate fluctuations, uncertainties in litigation or investigative proceedings, and the availability of financing. Fresenius does not undertake any responsibility to update the forward-looking statements in this release.
1 Adjusted for IFRS 16 effect
2 Q1/18 adjusted for divestitures of Care Coordination activities at FMC
3 Net income attributable to shareholders of Fresenius SE & Co. KGaA
Group guidance for 2019 confirmed
After closing the NxStage acquisition on February 21, the related sales and earnings contributions are now included in the Group guidance. Despite the expected earnings dilution from NxStage, Fresenius confirms its FY/19 guidance. Fresenius projects sales growth1 of 3% to 6% in constant currency. Net income2,3 growth is expected to be ~0% in constant currency.
Including the NxStage acquisition which is increasing the net debt/EBITDA ratio in 2019 by ~30 basis points and excluding IFRS 16, Fresenius now expects year-end 2019 net debt/EBITDA ratio to be at the upper-end of the original self-imposed target corridor of 2.5 to 3.0x.
Due to the adoption of the IFRS 16 accounting standard (“IFRS 16 effect”), Fresenius increases its self-imposed target corridor of 2.5x to 3.0x net debt/EBITDA to 3.0x to 3.5x.
1 On a comparable basis: FY/18 base: €33,009 million; FY/18 adjusted for divestitures of Care Coordination activities at FMC (H1/18); FY/19: adjusted for IFRS 16 effect
2 Net income attributable to shareholders of Fresenius SE & Co. KGaA
3 On a comparable basis: FY/18 base: €1,872 million; FY/18 before special items and adjusted for divestitures of Care Coordination activities at FMC (H1/18); FY/19: before special items (transaction-related expenses, expenses associated with the cost optimization program at FMC, revaluations of biosimilars contingent liabilities); adjusted for IFRS 16 effect
4 Both net debt and EBITDA calculated at expected annual average exchange rates; excluding further potential acquisitions
For a detailed overview of special items and adjustments please see the reconciliation tables on pages 19-22 of the PDF file.
5% sales growth1 in constant currency
Group sales were €8,495 million including an IFRS 16 effect of -€22 million. Group sales1 on a comparable basis increased by 8% (5% in constant currency) to €8,517 million (Q1/18: €7,870 million). Organic sales growth was 5%. Acquisitions/divestitures contributed net 0% to growth. Positive currency translation effects of 3% were mainly driven by the appreciation of the U.S. dollar against the euro.
Group sales by region:
1 On a comparable basis: Q1/18 adjusted for divestitures of Care Coordination activities at FMC; Q1/19 adjusted for IFRS 16 effect
For a detailed overview of special items and adjustments please see the reconciliation tables on pages 19-22 of the PDF file.
Net income1,2 growth flat in constant currency
Group EBITDA before special items was €1,701 million including an IFRS 16 effect of €220 million. Group EBITDA2 on a comparable basis increased by 6% (3% in constant currency) to €1,481 million (Q1/18: €1,394 million).
Group EBIT before special items was €1,130 million including an IFRS 16 effect of €19 million. Group EBIT2 on a comparable basis increased by 6% (2% in constant currency) to €1,111 million (Q1/18: €1,050 million). The EBIT margin2 on a comparable basis was 13.0% (Q1/18: 13.3%). Reported Group EBIT was €1,115 million.
Group net interest before special items was -€181 million including an IFRS 16 effect of -€48 million. On a comparable basis, net interest2 improved to -€133 million (Q1/18: -€139 million) mainly due to lower rates for refinancing activities. Reported Group net interest was -€184 million.
Group tax rate before special items and adopting IFRS 16 was 23.3%. Group tax rate2 on a comparable basis was 23.4% (Q1/18: 20.9%). The prior-year was positively influenced by one-time effects related to the adoption of the U.S. tax reform.
Noncontrolling interest before special items was €271 million including an IFRS 16 effect of €13 million. Noncontrolling interest2 on a comparable basis was €284 million (Q1/18: €270 million), of which 94% was attributable to the noncontrolling interest in Fresenius Medical Care.
Group net income1 before special items was €457 million including an IFRS 16 effect of -€8 million. Group net income1,2 on a comparable basis increased by 3% (0% in constant currency) to €465 million (Q1/18: €451million). Reported Group net income1,3 was €453 million.
Earnings per share1 before special items was €0.82 including an IFRS 16 effect of -€0.02.
Earnings per share1 before special items was €0.82 including an IFRS 16 effect of -€0.02. Earnings per share1,2 on a comparable basis increased by 3% (0% in constant currency) to €0.84 (Q1/18: €0.81). Reported Earnings per share1,3 was €0.81.
1 Net income attributable to shareholders of Fresenius SE & Co. KGaA
2 On a comparable basis: Q1/19 before special items and adjusted for IFRS 16 effect; Q1/18 adjusted for divestitures of Care Coordination activities at FMC
3 After special items and including IFRS 16 effect
For a detailed overview of special items and adjustments please see the reconciliation tables on pages 19-22 of the PDF file.
Continued investment in growth
2019 is an investment year for the Fresenius Group. Fresenius is making good progress in all of its investment initiatives to secure long-term sustainable growth. Spending on property, plant and equipment was €441 million (Q1/18: €380 million), primarily for the modernization and expansion of dialysis clinics, production facilities as well as hospitals and day clinics. This corresponds to 5% of sales.
Total acquisition spending was €1,923 million (Q1/18: €192 million), mainly for the acquisition of NxStage.
Cash flow development
Group operating cash flow was €289 million including an IFRS 16 effect of €171 million. On a comparable basis, Group operating cash flow was €118 million (Q1/18: €236 million) with a margin of 1.4% (Q1/18: 2.9%). After a strong Q4/18, operating cash flow was impacted by working capital changes at Fresenius Kabi, for example by some phasing of payments and stockbuild to prepare for a possible Brexit. Moreover, as in previous years’ first quarters, operating cash flow was influenced by the seasonality in invoicing at Fresenius Medical Care North America. Fresenius does not expect these temporary effects to have a significant impact on FY/19 cash flow.
Given the effects described above in combination with increasing investments, free cash flow before acquisitions and dividends adjusted for IFRS 16 was -€339 million (Q1/18: - €155 million). Free cash flow after acquisitions and dividends adjusted for IFRS 16 was -€2,282 million (Q1/18: -€389 million). The IFRS 16 effect amounts to €171 million respectively. Correspondingly, cash flow from financing activities declined by €171 million.
Solid balance sheet structure
The Group’s total assets were €64,985 million including an IFRS 16 effect of €5,669 million. Adjusted for IFRS 16, Group total assets1 increased by 5% (3% in constant currency) to €59,316 million (Dec. 31, 2018: €56,703 million). Current assets1 grew by 1% (0% in constant currency) to €14,958 million (Dec. 31, 2018: €14,790 million). Non-current assets1 increased by 6% (5% in constant currency) to €44,358 million (Dec. 31, 2018: € 41,913 million).
Total shareholders’ equity was €25,830 million including an IFRS 16 effect of -€167 million. Adjusted for IFRS 16, total shareholders’ equity1 increased by 4% (2% in constant currency) to €25,997 million (Dec. 31, 2018: €25,008 million). The equity ratio was 39.7%. Adjusted for IFRS 16, the equity ratio was 43.8% (Dec. 31, 2018: 44.1%).
Group debt was €26,378 million including an IFRS 16 effect of €5,836 million. Adjusted for IFRS 16, Group debt1 increased by 8% to €20,542 million (8% in constant currency) (Dec. 31, 2018: € 18,984 million). Group net debt was €24,835 million including an IFRS 16 effect of €5,836 million. Adjusted for IFRS 16, Group net debt1 increased by 17% (16% in constant currency) to € 18,999 million (Dec. 31, 2018: € 16,275 million) mainly due to the acquisition of NxStage by Fresenius Medical Care and the negative free cash flow.
As of March 31, 2019, the net debt/EBITDA ratio increased to 3.091,2,3 (December 31, 2018: 2.712,3). Excluding the acquisition of NxStage the net debt/EBITDA ratio was 2.831,2,3 as of March 31, 2019. Including the IFRS 16 effect, the reported net debt/EBITDA ratio increased to 3.532,3.
1 Adjusted for IFRS 16 effect
2 At LTM average exchange rates for both net debt and EBITDA; pro forma closed acquisitions/divestitures
3 Before special items
For a detailed overview of special items and adjustments please see the reconciliation tables on pages 19-22 of the PDF file.
Business Segments
Fresenius Medical Care (Figures according to Fresenius Medical Care Investor News)
Fresenius Medical Care is the world's largest provider of products and services for individuals with renal diseases. As of March 31, 2019, Fresenius Medical Care was treating 336,716 patients in 3,971 dialysis clinics. Along with its core business, the company provides related medical services in the field of Care Coordination.
Adjusted for the Q1/18 contribution from the divested Care Coordination activities, the effect of the adoption of the IFRS 16 accounting standard (“IFRS 16 effect”) and the contribution from NxStage, sales increased by 11% (6% at constant currency) to €4,125 million (Q1/18: €3,725 million). Organic sales growth was 6%. Positive currency translation effects of 5% were mainly related to the appreciation of the U.S. dollar against the euro.
Health Care Services sales1,2 increased by 12% (6% at constant currency) to €3,316 million (Q1/18: €2,958 million). Health Care Products sales1,2 increased by 5% (4% at constant currency) to €809 million (Q1/18: €767 million).
In North America, sales1,2 increased by 14% (5% in constant currency) to €2,879 million (Q1/18: €2,523 million). Health Care Services sales1,2 increased by 14% (6% in constant currency) to €2,679 million (Q1/18: €2,339 million).
1 On an adjusted basis: before expenses associated with the cost optimization program, the IFRS 16 effect, excluding effects from NxStage transaction
2 Q1/18 adjusted for divestitures of Care Coordination activities
3 Net income attributable to shareholders of Fresenius Medical Care AG & Co. KGaA
For a detailed overview of special items and adjustments please see the reconciliation tables on pages 19-22 of the PDF file.
Sales2 outside North America increased by 4% (6% in constant currency) to €1,246 million (Q1/18: €1,202 million). Health Care Services sales2 increased by 3% (8% in constant currency) to €637 million (Q1/18: €619 million). Health Care Product sales2 adjusted increased by 4% (5% in constant currency) to €609 million (Q1/18: €583 million).
Fresenius Medical Care’s EBIT3 increased by 9% (4% in constant currency) to €551 million (Q1/18: €506 million). The EBIT margin3 decreased to 13.4% (Q1/18: 13.6%).
Net income1,3 increased by 8% (3% in constant currency) to €318 million (Q1/18: €296 million).
Operating cash flow was €76 million (Q1/18: -€45 million) with a margin of 1.8% (Q1/18: -1.1%). The increase was mainly driven by the adoption of the IFRS 16 accounting standard leading to a reclassification of the repayment portion of rent to financing activities (€141 million). Adjusted for the IFRS 16 effect, operating cash flow was -€65 million.
For FY/19, Fresenius Medical Care expects adjusted sales to grow by 3% to 7%2,6 in constant currency. Net income1 is expected to develop in the range of -2% to +2%3,7 in constant currency.
For further information, please see Fresenius Medical Care’s Investor News at www.freseniusmedicalcare.com.
1 Net income attributable to shareholders of Fresenius Medical Care AG & Co. KGaA
2 Q1/18 adjusted for divestitures of Care Coordination activities; Q1/19 adjusted for IFRS 16 effects, excluding effects from NxStage transaction
3 Q1/18 before special items and after adjustments; Q1/19 before special items (before transaction-related expenses, expenses associated with the cost optimization program), adjusted for IFRS 16 effect, excluding effects from NxStage transaction
4 Before special items (operating cash flow after special items)
5 Adjusted for IFRS 16 effect
6 FY/18 base: €16,026 million
7 FY/18 base: €1,341 million
For a detailed overview of special items and adjustments please see the reconciliation tables on pages 19-22 of the PDF file.
Fresenius Kabi
Fresenius Kabi offers intravenously administered generic drugs, clinical nutrition and infusion therapies for seriously and chronically ill patients in the hospital and outpatient environments. The company is also a leading supplier of medical devices and transfusion technology products. In the biosimilars business, Fresenius Kabi develops products with a focus on oncology and autoimmune diseases.
Sales increased by 6% (4% in constant currency) to €1,701 million (Q1/18: €1,603 million). Organic sales growth was 4%. Positive currency translation effects of 2% were mainly related to the appreciation of the U.S. dollar against the euro.
Sales in Europe grew by 3% (organic growth: 3%) to €573 million (Q1/18: €557 million). Sales in North America increased by 5% (decreased organically by 2% from a high prior-year basis) to €623 million (Q1/18: €591 million). Sales in Asia-Pacific increased by 13% (organic growth: 11%) to €341 million (Q1/18: €301 million). Sales in Latin America/Africa increased by 6% (organic growth: 18%) to €164 million (Q1/18: €154 million).
EBIT1 increased by 13% (7% in constant currency) to €303 million (Q1/18: €268 million) with an EBIT margin1 of 17.8% (Q1/18: 16.7%).
Net income1,2 increased by 19% (12% in constant currency) to €203 million (Q1/18: €170 million).
Operating cash flow3 was €132 million (Q1/18: €226 million). After a strong Q4/18, operating cash flow was impacted by working capital changes, for example by some phasing of payments and stockbuild to prepare for a possible Brexit. The cash flow margin was 7.8% (Q1/18: 14.1%).
Fresenius Kabi confirms its outlook for FY/19 and expects organic sales growth4 of 3% to 6% and EBIT growth5 in constant currency of 3% to 6%.
1 On a comparable basis: before special items and adjusted for IFRS 16 effect
2 Net income attributable to shareholders of Fresenius SE & Co. KGaA
3 Adjusted for IFRS 16 effect, before special items (operating cash flow after special items)
4 On a comparable basis: FY/18 base: €6,544 million; FY/19 before special items (acquisition-related expenses, revaluations of biosimilars contingent liabilities) and adjusted for IFRS 16 effect
5 On a comparable basis: FY/18 base: €1,139 million; FY/18 before special items; FY/19 before special items (acquisition-related expenses, revaluations of biosimilars contingent liabilities) and adjusted for IFRS 16 effect.
For a detailed overview of special items and adjustments please see the reconciliation tables on pages 19-22 of the PDF file.
Fresenius Helios
Fresenius Helios is Europe's leading private hospital operator. The company comprises Helios Germany and Helios Spain (Quirónsalud). Helios Germany operates 86 hospitals, ~125 outpatient centers and treats approximately 5.3 million patients annually. Quirónsalud operates 47 hospitals, 56 outpatient centers and around 300 occupational risk prevention centers, and treats approximately 13.3 million patients annually.
Sales decreased by 1% (increased by 4%1; organic growth: 4%) to €2,311 million (Q1/18: €2,331 million).
Sales of Helios Germany decreased by 6% (increased by 1%1; organic growth: 2%) to €1,485 million (Q1/18: €1,574 million). Sales were impacted by a decline in admissions in Germany, partially due to the transfer of the post-acute care business from Helios to Vamed, a shortage of nurses at selected intensive care units and a less pronounced flu season. The admission decline was more than compensated by positive price effects.
Helios Spain increased sales by 9% (organic growth: 9%) to €826 million (Q1/18: €757 million), mainly driven by the private sector. The occupational risk prevention business also had a valuable contribution. Performance in Q1/18 was impacted by the Easter holidays.
1 Adjusted for the post-acute care business transferred to Fresenius Vamed as of July 1, 2018
2 Adjusted for IFRS 16 effect
3 Net income attributable to shareholders of Fresenius SE & Co. KGaA
For a detailed overview of special items and adjustments please see the reconciliation tables on pages 19-22 of the PDF file.
EBIT1 of Fresenius Helios decreased by 4% (-3%2) to €266 million (Q1/18: €278 million) with an EBIT margin of 11.5% (Q1/18: 11.9%).
EBIT1 of Helios Germany decreased by 16% (-14%2) to €149 million (Q1/18: €177 million). The EBIT margin improved sequentially by 50 bps to 10.0% (Q4/18: 9.5%). The development of Helios Germany is impacted by the admissions decline and the investments for preparatory structural measures.
EBIT1 of Helios Spain increased by 16% to €119 million (Q1/18: €103 million), mainly due to the strong operating performance with an EBIT margin of 14.4% (Q1/18: 13.6%).
Net income1,3 decreased by 8% to €176 million (Q1/18: €191 million).
Operating cash flow1 was €91 million (Q1/18: €97 million) with a margin of 3.9% (Q1/18: 4.2%). The decrease is mainly attributable to the increase in days sales outstanding (DSO).
Fresenius Helios confirms its outlook for FY/19 and expects organic sales growth of 2% to 5% and an EBIT1 growth of -5% to -2%.
1 Adjusted for IFRS 16 effect
2 Adjusted for the post-acute care business transferred to Fresenius Vamed as of July 1, 2018
3 Net income attributable to shareholders of Fresenius SE & Co. KGaA
For a detailed overview of special items and adjustments please see the reconciliation tables on pages 19-22 of the PDF file.
Fresenius Vamed
Fresenius Vamed manages projects and provides services for hospitals and other health care facilities worldwide and is a leading post-acute care provider in Central Europe. The portfolio ranges along the entire value chain: from project development, planning, and turnkey construction, via maintenance and technical management to total operational management.
Sales increased by 77% (33%1) to €440 million (Q1/18: €249 million). Organic sales growth was 31%, acquisitions contributed 2% to growth. Both the project and the service business showed strong momentum. Sales of the project business increased by 17% to €108 million (Q1/18: €92 million). Sales in the service business grew by 111% (41%1) to €332 million (Q1/18: €157 million), supported by an intensified collaboration with Fresenius Helios.
In Q1/19, EBIT2 increased by 83% (83%2 in constant currency) to €11 million (Q1/18: €6 million) with an EBIT margin of 2.5% (Q1/18: 2.4%). EBIT2 additionally adjusted for the acquisition of the German post-acute care business was €7 million with an EBIT margin of 2.1%.
Net income2,3 increased by 50% to €6 million (Q1/18: €4 million).
Order intake increased by 47% to €383 million (Q1/18: €260 million). As of March 31, 2019, order backlog reached a new all-time high of €2,698 million (Dec 31, 2018: €2,420 million).
Operating cash flow2 increased by 45% to €-23 million (Q1/18: €-42 million) with a margin of -5.2% (Q1/18: -16.9%).
Fresenius Vamed confirms its outlook for FY/19 and expects organic sales growth of ~10% and EBIT growth2 of 15% to 20%.
1 Adjusted for German post-acute care business acquired from Fresenius Helios as of July 1, 2018
2 Adjusted for IFRS 16 effect
3 Net income attributable to shareholders of VAMED AG
For a detailed overview of special items and adjustments please see the reconciliation tables on pages 19-22 of the PDF file.
Conference Call
As part of the publication of the results for the first quarter 2019, a conference call will be held on May 2, 2019 at 1:30 p.m. CET (7:30 a.m. EST). All investors are cordially invited to follow the conference call in a live broadcast over the Internet at www.fresenius.com/investors. Following the call, a replay will be available on our website.
For additional information on the performance indicators used please refer to our website www.fresenius.com/alternative-performance-measures.
This release contains forward-looking statements that are subject to various risks and uncertainties. Future results could differ materially from those described in these forward-looking statements due to certain factors, e.g. changes in business, economic and competitive conditions, regulatory reforms, results of clinical trials, foreign exchange rate fluctuations, uncertainties in litigation or investigative proceedings, and the availability of financing. Fresenius does not undertake any responsibility to update the forward-looking statements in this release.
The market research institute Potentialpark has honored the global healthcare group Fresenius for the eighth consecutive year as the German company with the best overall Internet offering for job applicants.
In Potentialpark’s 2019 study, Fresenius not only took first place in the overall category for all career-relevant online activities. but won in three of the four individual categories: Online Application Management, Mobile, and Career Website. The company was third in the Social Media category.
Potentialpark has carried out an annual study of German companies’ online offerings for job applicants since 2002. For this year’s study, Potentialpark assessed the online activities of 141 German companies according to more than 300 criteria. More than 40,000 students and graduates around the world were surveyed about their preferences.
“Today, contact between job-seekers and companies takes place predominantly through digital channels,” said Markus Olbert, Senior Vice President Corporate Human Resources at Fresenius. “We’re very happy that for years, our digital offering has met the needs of our target groups. Having digitalized our information offering, first contact and application process, we are now putting the last piece into place with the digitalization of our onboarding.”
1 Growth rate adjusted for IFRS 15 adoption and divestitures of Care Coordination activities (Q4/17 base: €8,290 million; FY/17 base: €32,841 million)
2 Before special items and after adjustments
3 Net income attributable to shareholders of Fresenius SE & Co. KGaA
For a detailed overview of special items and adjustments please see the reconciliation tables on pages 21-24 of the pdf file.
Group expectations for FY/19 confirmed
For FY/19, Fresenius projects sales growth1 of 3% to 6% in constant currency. Net income2,3 growth is expected to be ~0% in constant currency. NxStage is not included in this guidance because the acquisition is not closed yet and Fresenius does not expect a significant impact on its Group guidance metrics. This guidance is in line with the expectations announced on December 6, 2018.
Fresenius expects its year-end 2019 net debt/EBITDA4 ratio to be broadly stable over the year-end 2018 figure.
Fresenius intends to further increase its dividend for FY 2019.
Healthy growth targets5 for 2020 – 2023
Based on the expected financial results for FY/19, Group sales are projected to grow organically with a compounded annual growth rate (CAGR) of 4% to 7% in 2020 to 2023. Group net income2 is projected to increase organically with a CAGR of 5% to 9% in 2020 to 2023. Fresenius expects its launched and contemplated sales growth and efficiency improvement initiatives as well as the expected break-even of Fresenius Kabi’s biosimilars business to drive an acceleration of Group earnings growth over that period. Small and medium-sized acquisitions are expected to contribute an incremental CAGR of approx. 1%-point to both sales and net income growth.
1 FY/18 base: €33,009 million; FY/18 adjusted for divestitures of Care Coordination activities at FMC (H1/18); FY/19: adjusted for IFRS 16 effects; excluding effects from pending acquisition of NxStage by FMC
2 Net income attributable to shareholders of Fresenius SE & Co. KGaA
3 FY/18 base: €1,872 million; FY/18 before special items and after adjustments; FY/19 before special items (transcation-related expenses, expenses associated with the cost optimization program at FMC, revaluations of biosimilars contingent liabilities); adjusted for IFRS 16 effects; excluding effects from pending acquisition of NxStage by FMC
4 Both net debt and EBITDA calculated at expected annual average exchange rates; excluding effects from pending acquisition of NxStage by FMC; excluding further potential acquisitions; adjusted for IFRS 16 effects
5 Before special items
For a detailed overview of special items and adjustments please see the reconciliation tables on pages 21-24 of the pdf file.
26th consecutive dividend increase proposed
Consistent with Fresenius’ stated dividend policy, the Management Board will propose to the Supervisory Board a 7% increase in the dividend for FY/18 to €0.80 per share (2017: €0.75). The proposed total dividend payout to Fresenius SE & Co. KGaA shareholders amounts to €445 million.
6% sales growth in constant currency1
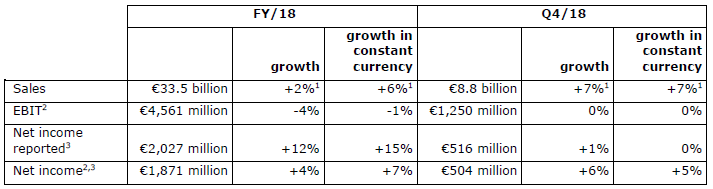
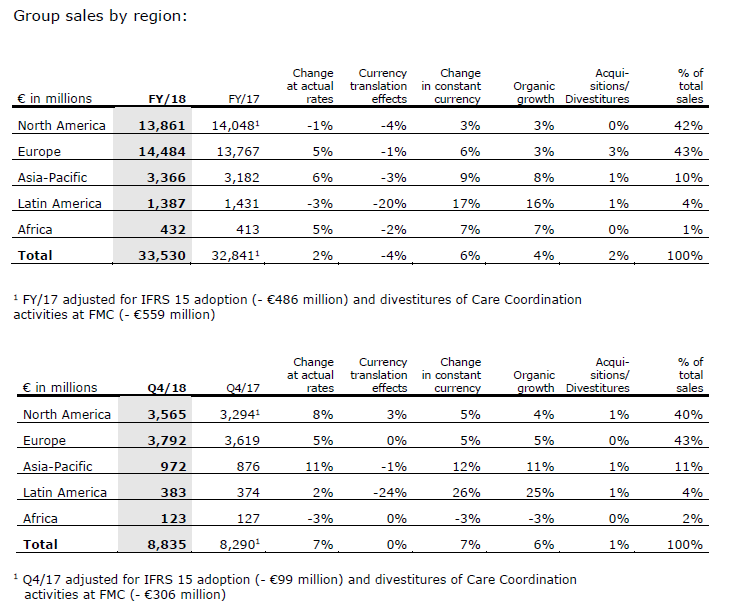
Group sales1 increased by 2%1 (6%1 in constant currency) to €33,530 million (FY/17: €32,841 million). Organic sales growth was 4%1. Acquisitions/divestitures contributed net 2%1 to growth. Negative currency translation effects of 4%1 were mainly driven by the devaluation of the U.S. dollar and the Argentinian peso against the euro.
In Q4/18, Group sales1 increased by 7%1 (7%1 in constant currency) to €8,835 million (Q4/17: €8,290 million). Organic sales1 growth was 6%1. Acquisitions/divestitures contributed net 1%1 to growth. There were no meaningful currency translation effects.
7% net income1,2 growth in constant currency
Group EBITDA2 decreased by 3%2 (0%2 in constant currency) to €5,991 million (FY/17: €6,174 million). Group EBIT2 decreased by 4%2 (-1%2 in constant currency) to €4,561 million (FY/17: €4,746 million). The EBIT margin2 was 13.6% (FY/17: 14.5%). Group EBIT2 before expenses for the further development of the biosimilars business decreased by 2%2 (increased by 1%2 in constant currency) to €4,727 million. In FY/17, the compensation for treatments of U.S. war veterans (“VA agreement”) had contributed €87 million as a one-time effect. Group EBIT2 excluding the VA agreement and expenses for the further development of the biosimilars business increased by 3% in constant currency.
In Q4/18, Group EBIT2 was broadly stable year-over-year2 (broadly stable2 in constant currency) at €1,250 million (Q4/17: €1,244 million), with an EBIT margin2 of 14.1% (Q4/17: 15.0%). Group EBIT2 excluding the prior-year VA agreement and expenses for the further development of the biosimilars business was also broadly stable year-over-year2 in constant currency.
Group net interest2 was -€570 million (FY/17: -€630 million). The decrease was mainly driven by refinancings at lower rates, lower debt, currency effects as well as proceeds from the divestitures of Care Coordination activities at Fresenius Medical Care.
The decrease of the Group tax rate2 to 22.0% (FY/17: 27.9%) was mainly due to the U.S. tax reform and some related one-time effects at Fresenius Medical Care and Fresenius Kabi. In Q4/18, the Group tax rate2 was 22.6% (Q4/17: 28.0%).
Noncontrolling interest2 was €1,240 million (2017: €1,164 million), of which 94% was attributable to the noncontrolling interest in Fresenius Medical Care.
1Net income attributable to shareholders of Fresenius SE & Co. KGaA
2Before special items and after adjustments
Group net income1,2 increased by 12% (15% in constant currency) to €2,027 million (FY/17: €1,814 million), mainly due to gains related to divestitures of Care Coordination activities at Fresenius Medical Care. Earnings per share1,2 increased by 12% (15% in constant currency) to €3.65 (FY/17: €3.27). In Q4/18, Group net income1,2 increased by 1% (0% in constant currency) to €516 million (Q4/17: €511 million). Earnings per share1,2 increased by 1% (0% in constant currency) to €0.93 (Q4/17: €0.92).
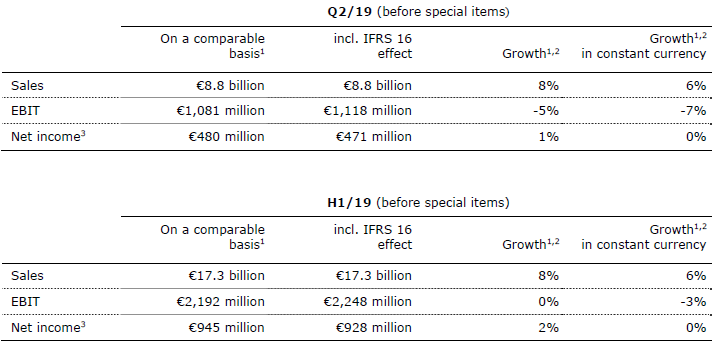
Group net income1,3 before special items increased by 3% (6% in constant currency) to €1,871 million (FY/17: €1,816 million). Earnings per share1,3 increased by 3% (6% in constant currency) to €3.37 (FY/17: €3.28). In Q4/18, Group net income1,3 increased by 3% (3% in constant currency) to €504 million (Q4/17: €487 million). Earnings per share1,3 increased by 3% (3% in constant currency) to €0.91 (Q4/17: €0.88).
Group net income1,4 before special items and after adjustments increased by 4% (7% in constant currency) to €1,871 million (FY/17: €1,804 million). Earnings per share1,4 increased by 3% (6% in constant currency) to €3.37 (FY/17: €3.26). In Q4/18, Group net income1,4 increased by 6% (5% in constant currency) to €504 million (Q4/17: €477 million). Earnings per share1,4 increased by 6% (5% in constant currency) to €0.91 (Q4/17: €0.86).
Group net income1,4,5 before expenses for the further development of the biosimilars business increased by 8% (11% in constant currency) to €1,991 million (2017: €1,847 million). Earnings per share1,4,5 increased by 8% (11% in constant currency) to €3.58 (2017: €3.33). In Q4/18, Group net income1,4,5 increased by 6% (6% in constant currency) to €542 million (Q4/17: €510 million). Earnings per share1,4,5 increased by 5% (5% in constant currency) to €0.97 (Q4/17: €0.92).
1Net income attributable to shareholders of Fresenius SE & Co. KGaA
2After special items
3Before special items
4Before special items and after adjustments
5Before expenses for the further development of the biosimilar business
Continued investment in growth
Spending on property, plant and equipment was €2,163 million (FY/17: €1,828 million), primarily for the modernization and expansion of dialysis clinics, production facilities as well as hospitals and day clinics. This corresponds to 6% of sales.
Total acquisition spending was €1,086 million (FY/17: €6,852 million). FY/17 spending had included the acquisition of Quirónsalud as well as the acquisition of the biosimilars business of Merck KGaA.
Cash flow development
Group operating cash flow decreased by 5% to €3,742 million (FY/17: €3,937 million) with a margin of 11.2% (FY/17: 11.6%). In FY/17 Fresenius Medical Care had received a ~€200 million payment under the VA agreement. The FY/18 cash flow was impacted by a change in working capital items at Fresenius Helios, the earnings decrease at Helios Germany and negative currency translation effects. Operating cash flow in Q4/18 increased by 7% to €1,193 million (Q4/17: €1,116 million) with a margin of 13.5% (Q4/17: 12.8%).
Given the effects described above in combination with growing investments, free cash flow before acquisitions and dividends decreased to €1,665 million (FY/17: €2,232 million). Free cash flow after acquisitions and dividends was €1,374 million (FY/17: -€4,557 million).
Solid balance sheet structure
The Group’s total assets increased by 7% (5% in constant currency) to €56,703 million (Dec. 31, 2017: €53,133 million). Current assets grew by 17% (17% in constant currency) to €14,790 million (Dec. 31, 2017: €12,604 million). Non-current assets increased by 3% (2% in constant currency) to €41,913 million (Dec. 31, 2017: €40,529 million).
Total shareholders’ equity increased by 15% (13% in constant currency) to €25,008 million (Dec. 31, 2017: €21,720 million). The equity ratio increased to 44.1% (Dec. 31, 2017: 40.9%).
Group debt was broadly stable (decreased by 2% in constant currency) at €18,984 million (Dec. 31, 2017: €19,042 million). Group net debt decreased by 6% (-8% in constant currency) to €16,275 million (Dec. 31, 2017: €17,406 million) mainly due to the proceeds from divestitures of Care Coordination activities at Fresenius Medical Care.
As of December 31, 2018, the net debt/EBITDA ratio was 2.711,2 (December 31, 2017: 2.841,2). Excluding the proceeds from divestitures of Care Coordination activities the net debt/EBITDA ratio was 2.911,2.
1At LTM average exchange rates for both net debt and EBITDA; pro forma closed acquisitions/divestitures, excluding effects from pending acquisition of NxStage by FMC
2Before special items
Business Segments
Fresenius Medical Care
Fresenius Medical Care is the world's largest provider of products and services for individuals with renal diseases. As of December 31, 2018, Fresenius Medical Care was treating 333,331 patients in 3,928 dialysis clinics. Along with its core business, the company provides related medical services in the field of Care Coordination.
1Excluding VA agreement Q4/18: 6%; FY/18: 4%
2Net income attributable to shareholders of Fresenius Medical Care AG & Co. KGaA
3FY/18 base: €16,026 million; FY/18 adjusted for divestitures of Care Coordination activities; FY/19 adjusted for IFRS 16 effects, excluding effects from pending NxStage transaction
4FY/18 base: €1,341 million; FY/18 before special items and after adjustments; FY/19 before special items (before transcation-related expenses, expenses associated with the cost optimization program), adjusted for IFRS 16 effects, excluding effects from pending NxStage transaction
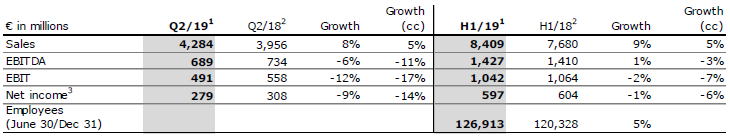
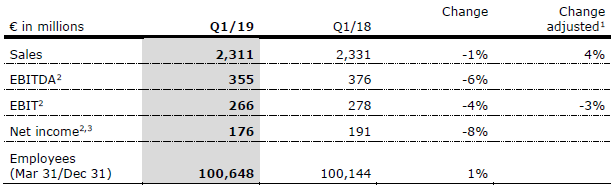
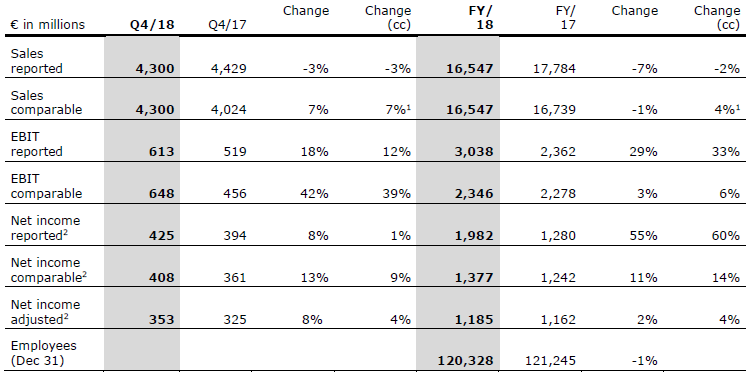
Sales decreased by 7% (-2% in constant currency) to €16,547 million (FY/17: €17,784 million). Organic sales growth was 4%. Currency translation effects reduced sales by 5%. The adoption of IFRS 15 reduced sales by 3%.
With the FY/17 base additionally adjusted for divestitures of Care Coordination activities, sales decreased by 1% (increased by 4% in constant currency).
In Q4/18, sales decreased by 3% (-3% in constant currency) to €4,300 million (Q4/17: €4,429 million). Organic sales growth was 6%. The adoption of IFRS 15 reduced sales by 2%. Q4/17 base additionally adjusted for divestitures of Care Coordination activities, sales in Q4/18 increased by 7% (7% in constant currency).
Health Care services sales1 (dialysis services and care coordination) decreased by 2% (increased by 4% in constant currency) to €13,264 million (FY/17: €13,487 million). Health Care product sales increased by 1% (5% in constant currency) to €3,283 million (FY/17: €3,252 million).
In North America, sales1 decreased by 2% (increased by 2% in constant currency) to €11,570 million (FY/17: €11,834 million). Health Care services sales1 decreased by 2% (increased by 2% in constant currency) to €10,725 million (FY/17: €10,991 million). Excluding the FY/17 effect from the VA Agreement (€94 million), Health Care services sales1 increased by 3% in constant currency. Health Care product sales of €845 million (FY/17: €843 million) were on the prior-year level (increased by 5% in constant currency).
1On a comparable basis
Sales outside North America increased by 1% (8% in constant currency) to €4,962 million (FY/17: €4,890 million). Health Care services sales increased by 2% (11% in constant currency) to €2,539 million (FY/17: €2,496 million). Health Care product sales increased by 1% (5% in constant currency) to €2,423 million (FY/17: €2,394 million).
Fresenius Medical Care’s EBIT increased by 29% (33% in constant currency) to €3,038 million (FY/17: €2,362 million), mainly driven by gains related to divestitures of Care Coordination activities. The EBIT margin increased to 18.4% (FY/17: 13.3%). EBIT on a comparable basis increased by 6% in constant currency and EBIT margin increased to 14.2% (FY/17: 13.6%).
In Q4/18, EBIT increased by 18% (12% in constant currency) to €613 million (Q4/17: €519 million). The EBIT margin increased to 14.3% (Q4/17: 11.7%). EBIT on a comparable basis increased by 42% (increased by 39% in constant currency) and EBIT margin increased to 15.1% (Q4/17: 11.3%).
Net income1 increased by 55% (60% in constant currency) to €1,982 million (FY/17: €1,280 million). Net income1 growth on a comparable basis was 14% in constant currency. Adjusted net income1 growth was 4% in constant currency.
In Q4/18, net income1 increased by 8% (1% in constant currency) to €425 million (Q4/17: €394 million). Net income1 growth on a comparable basis was 9% in constant currency. Adjusted net income1 growth was 4% in constant currency.
Operating cash flow was €2,062 million (FY/17: €2,192 million). The cash flow margin increased to 12.5% (FY/17: 12.3%). In Q4/18, operating cash flow was €698 million (Q4/17: €528 million). The cash flow margin increased to 16.2% (Q4/17: 11.9%).
For FY/19, Fresenius Medical Care expects adjusted sales to grow by 3% to 7%2 in constant currency. Net income1 is expected to develop in the range of -2% to +2%3 in constant currency in 2019.
For 2020, Fresenius Medical Care expects adjusted sales as well as adjusted net income to grow at a mid to high single digit rate, both at constant currency.
For further information, please see Fresenius Medical Care’s Press Release at www.freseniusmedicalcare.com.
1Net income attributable to shareholders of Fresenius Medical Care AG & Co. KGaA
2FY/18 base: €16,026 million; FY/18 adjusted for divestitures of Care Coordination activities (H1/18); FY/19 adjusted for IFRS 16 effects, excluding effects from pending NxStage transaction
3FY/18 base: €1,341 million; FY/18 before special items and after adjustments; FY/19 before special items (before transaction-related expenses, expenses associated with the cost optimization program), adjusted for IFRS 16 effects, excluding effects from pending NxStage transaction
Fresenius Kabi
Fresenius Kabi offers intravenously administered generic drugs, clinical nutrition and infusion therapies for seriously and chronically ill patients in the hospital and outpatient environments. The company is also a leading supplier of medical devices and transfusion technology products. In the biosimilars business, we are developing products with a focus on oncology and autoimmune diseases.
1Before special items
2Before expenses for the further development of the biosimilars business: Q4/18: 8%; FY/18: 10%
3Net income attributable to shareholders of Fresenius SE & Co. KGaA
4Before expenses for the further development of the biosimilars business: Q4/18: 20%; FY/18: 21%
5FY/18 base: €6,544 million; FY/19 adjusted for IFRS 16 effects
6FY/18 base: €1,139 million; FY/18 before special items including expenditures for further development of biosimilars business (€120 million after tax); FY/19 before special items (before transaction-related expenses, revaluations of biosimilars contingent liabilities), adjusted for IFRS 16 effects
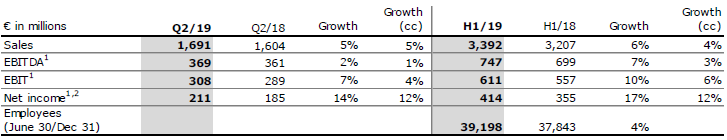
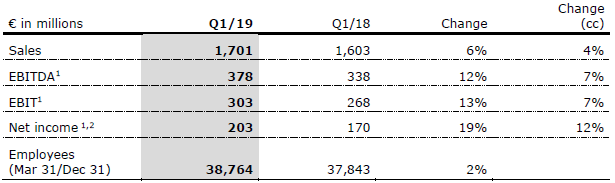
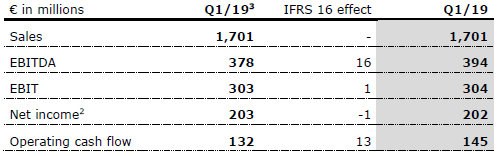
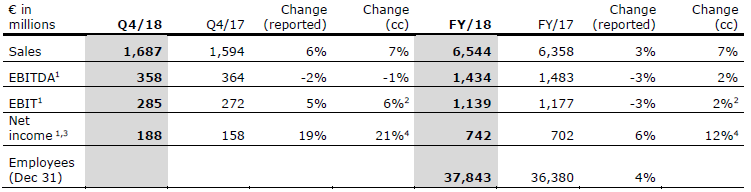
Sales increased by 3% (7% in constant currency) to €6,544 million (FY/17: €6,358 million). Organic sales growth was 7%. Strong negative currency translation effects of 4% were mainly related to the devaluation of the U.S. dollar, the Argentinian peso and the Brazilian real against the euro. In Q4/18, sales increased by 6% (7% in constant currency) to €1,687 million (Q4/17: €1,594 million). Organic sales growth was 7%.
Sales in Europe grew by 2% (organic growth: 3%) to €2,248 million (FY/17: €2,214 million). In Q4/18, sales in Europe increased by 2% (organic growth: 3%) to €590 million.
Sales in North America increased by 3% (organic growth: 8%) to €2,359 million (FY/17: €2,290 million). In Q4/18, sales increased by 8% (organic growth: 5%) to €599 million (Q4/17: €554 million).
Sales in Asia-Pacific increased by 9% (organic growth: 12%) to €1,300 million (FY/17: €1,196 million). In Q4/18, sales increased by 11% (organic growth: 13%) to €336 million (Q4/17: €302 million).
Sales in Latin America/Africa decreased by 3% (increased organically by 13%) to €637 million (FY/17: €658 million). In Q4/18, sales increased by 2% (organical growth: 18%) to €162 million (Q4/17: €159 million).
EBIT1 decreased by 3% (increased by 2% in constant currency) to €1,139 million (FY/17: €1,177 million) with an EBIT margin1 of 17.4% (FY/17: 18.5%). In Q4/18, EBIT1 increased by 5% (6% in constant currency) to €285 million (Q4/17: €272 million) with an EBIT margin1 of 16.9% (Q4/17: 17.1%).
EBIT1 before expenses for the further development of the biosimilars business increased by 5% (10% in constant currency) to €1,305 million (FY/17: €1,237 million) with an EBIT margin1 of 19.9% (FY/17: 19.5%). In Q4/18, EBIT1 before expenses for the further development of the biosimilars business increased by 6% (8% in constant currency) to €338 million (Q4/17: €318 million) with an EBIT margin1 of 20.0% (Q4/17: 19.9%).
Net income1,2 increased by 6% (12% in constant currency) to €742 million (FY/17: €702 million). In Q4/18, net income1,2 increased by 19% (21% in constant currency) to €188 million (Q4/17: €158 million).
Operating cash flow increased by 3% to on an all-time-high of €1,040 million (2017: €1,010 million), mainly driven by a strong operational performance. The cash flow margin was 15.9% (2017: 15.9%).
For FY/19, Fresenius Kabi expects organic sales growth3 of 3% to 6% and EBIT growth4 in constant currency of 3% to 6%.
1Before special items
2Net income attributable to shareholders of Fresenius SE & Co. KGaA
3FY/18 base: €6,544 million; FY/19 adjusted for IFRS 16 effects
4FY/18 base: €1,139million; FY/18 before special items including expenditures for further development of biosimilars business (€120 million after tax); FY/19 before special items (before acquisition-related expenses, revaluations of biosimilars contingent liabilities), adjusted for IFRS 16 effects
Fresenius Helios
Fresenius Helios is Europe's leading private hospital operator. The company comprises Helios Germany and Helios Spain (Quirónsalud). Helios Germany operates 86 hospitals, ~125 outpatient centers and treats approximately 5.3 million patients annually. Quirónsalud operates 47 hospitals, 57 outpatient centers and around 300 occupational risk prevention centers, and treats approximately 13.3 million patients annually.
As of July 1, 2018 Fresenius Helios transferred its German post-acute care business to Fresenius Vamed. To allow a like-for-like comparison, we also provide sales and EBIT growth rates adjusted for the effects of this transaction.
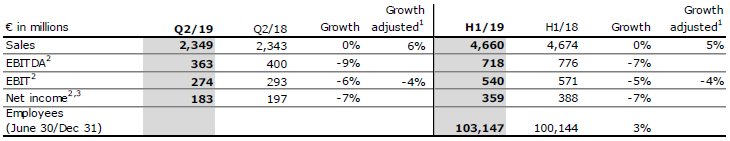
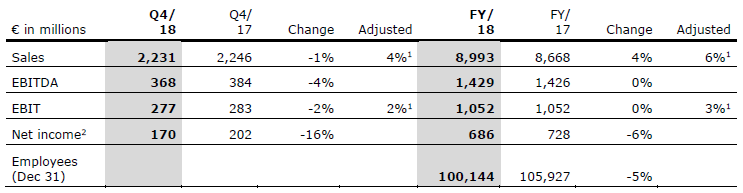
Fresenius Helios increased sales by 4% (6%1) to €8,993 million (FY/17: €8,668 million). Organic sales growth was 3%. In Q4/18, sales decreased by 1% (increased by 4%1; organic growth: 4%) to €2,231 million (Q4/17: €2,246 million).
Sales of Helios Germany decreased by 2% (increased by 2%1; organic growth: 2%) to €5,970 million (FY/17: €6,074 million). In Q4/18, sales decreased by 5% (increased by 3%1; organic growth: 3%) to €1,439 million (Q4/17: €1,512 million). Sales were impacted by a decline in admissions, inter alia due to an unexpectedly high fluctuation among doctors and a shortage of nursing staff as well as a trend towards outpatient treatments. The volume decline was offset by DRG inflator increases and better results from the negotiations with our payors.
Helios Spain increased sales by 17% (organic growth: 6%) to €3,023 million (FY/17: €2,594 million), mainly due to an excellent operating performance and an additional month of consolidation (Quirónsalud is consolidated since February 1, 2017). In Q4/18 Helios Spain increased sales by 8% (organic growth: 7%) to €792 million (Q4/17: €734 million).
Fresenius Helios EBIT remained unchanged (increased by 3%1) at €1,052 million (FY/17: €1,052 million) with a margin of 11.7% (FY/17: 12.1%). In Q4/18, EBIT decreased by 2% (increased by 2%1) to €277 million (Q4/17: €283 million) with a margin of 12.4% (Q4/17: 12.6%).
EBIT of Helios Germany decreased by 14% (-10%1) to €625 million (FY/17: €725 million) with a margin of 10.5% (FY/17: 11.9%). In Q4/18, EBIT decreased by 22% (-15%1) to €137 million (Q4/17: €176 million) with a margin of 9.5% (Q4/17: 11.6%). The significant fixed cost base in the hospital business has a strong operating leverage effect on EBIT as market dynamics and sales development slow down. The development of Helios Germany is impacted by additional catalogue effects, preparatory structural measures for expected regulatory requirements (e.g. clustering) and a lack of privatization opportunities in the German market. An unexpectedly high fluctuation among doctors and a shortage of nursing staff have an additional negative impact on the earnings development.
EBIT of Helios Spain increased by 26% to €413 million (FY/17: €327 million), mainly due to the strong operating performance and the additional month of consolidation, with a margin of 13.7% (FY/17: 12.6%). In Q4/18, EBIT increased by 19% to €127 million (Q4/17: €107 million) with a margin of 16.0% (Q4/17: 14.6%).
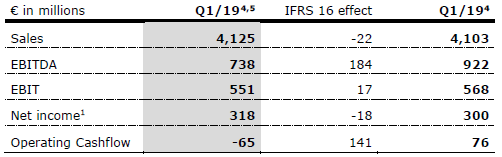
Net income2 of Fresenius Helios decreased by 6% to €686 million (FY/17: €728 million). In Q4/18, net income2 decreased by 16% to €170 million (Q4/17: €202 million).
Operating cash flow was €554 million (FY/17: €733 million) with a margin of 6.2% (FY/17: 8.5%). The decrease is mainly attributable to the earnings decrease at Helios Germany and the changes in working capital.
For FY/19, Fresenius Helios expects organic sales growth of 2% to 5% and an EBIT3 decline of -5% to -2%.
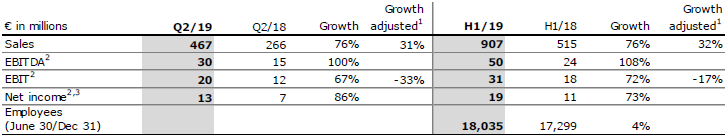
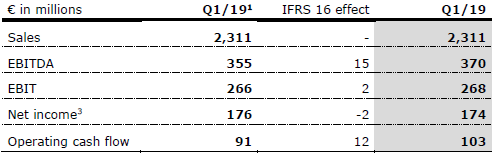
1Adjusted for German post-acute care business transferred to Fresenius Vamed
2Net income attributable to shareholders of Fresenius SE & Co. KGaA
3Adjusted for IFRS 16 effects
Fresenius Vamed
Fresenius Vamed manages projects and provides services for hospitals and other health care facilities worldwide and is a leading post-acute care provider in Central Europe. The portfolio ranges along the entire value chain: from project development, planning, and turnkey construction, via maintenance and technical management to total operational management.
As of July 1, 2018 Fresenius Helios transferred its German post-acute care business to Fresenius Vamed. To allow for a like-for-like comparison, we also provide sales and EBIT growth rates adjusted for the effects of this transaction.
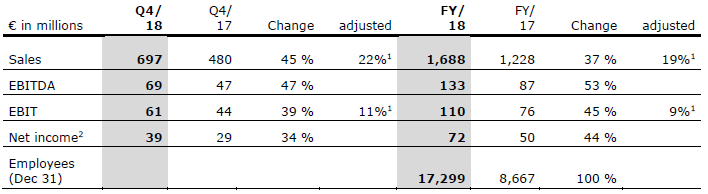
Sales increased by 37% (19%1) to €1,688 million (FY/17: €1,228 million). Organic sales growth was 16% with a strong momentum in both the project and service businesses as well as increased sales from services for Fresenius Helios. Sales of the project business increased by 17% to €712 million (FY/17: €606 million). Sales in the service business grew by 57% (20%1) to €976 million (FY/17: €622 million). In Q4/18, sales increased by 45% (22%1; organic growth: 20%) to €697 million (Q4/17: €480 million).
EBIT increased by 45% (9%1) to €110 million (FY/17: €76 million) with a margin of 6.5% (FY/17: 6.2%). In Q4/18, EBIT increased by 39% (11%1) to €61 million (Q4/17: €44 million) with a margin of 8.8% (Q4/17: 9.2%).
Net income2 increased by 44% to €72 million (FY/17: €50 million). In Q4/18, net income2 increased by 34% to €39 million (FY/17: €29 million).
Order intake increased by 12% to €1,227 million (FY/17: €1,096 million) and reached a new all-time high. As of December 31, 2018, order backlog was €2,420 million (December 31, 2017: €2,147 million).
For FY/19, Fresenius Vamed expects organic sales growth in the range of ~10% and EBIT growth3 of 15% to 20%.
1Without German post-acute care business acquired from Fresenius Helios
2Net income attributable to shareholders of VAMED AG
3Including the German post-acute care business acquired from Fresenius Helios, adjusted for IFRS 16 effects
Conference Call
As part of the publication of the results for fiscal year 2018, a conference call will be held on February 20, 2019 at 2 p.m. CET (8 a.m. EST). All investors are cordially invited to follow the conference call in a live broadcast over the Internet at www.fresenius.com/investors. Following the call, a replay will be available on our website.
This release contains forward-looking statements that are subject to various risks and uncertainties. Future results could differ materially from those described in these forward-looking statements due to certain factors, e.g. changes in business, economic and competitive conditions, regulatory reforms, results of clinical trials, foreign exchange rate fluctuations, uncertainties in litigation or investigative proceedings, and the availability of financing. Fresenius does not undertake any responsibility to update the forward-looking statements in this release.