


Fresenius has proven the resilience of its business model in a challenging environment in FY/20. Based on preliminary and unaudited results, Fresenius achieved its sales and net income1 guidance including COVID-19 effects. Fresenius expected sales growth2 of 3% to 6% and a net income1,3 development at the lower end of a range of -4% to +1%, both in constant currency.
Excluding estimated COVID-19 effects, the Group performed very well against its original guidance ranges of 4% to 7% sales growth and 1% to 5% net income1,3 growth, both in constant currency.
The previously flagged risk of an impairment of goodwill and tradenames at Fresenius Medical Care Latin America, as a consequence of the macro-economic downturn and increasing risk adjustment rates for certain countries in Latin America, has materialized and impacts reported FY/20 Group net income1.
Fresenius firmly intends to extend its track record of 27 consecutive dividend increases.
1Net income attributable to shareholders of Fresenius SE & Co. KGaA
2FY/19 base: €35,409 million
3FY/19 base: €1,879 million; before special items (transaction-related expenses, revaluations of biosimilars contingent purchase price liabilities, gain related to divestitures of Care Coordination activities at FMC, expenses associated with the cost optimization program at FMC); FY/20: before special items
Current expectations for FY/21
Based on the current status of the Group’s financial planning process and assuming that the current burdens and constraints caused by the COVID-19 pandemic only begin to recede in the second half of the year, Fresenius targets healthy sales growth1 and at least broadly stable net income2 year over year in FY/21.
The FY/21 earnings are, hence, expected to be very meaningfully impacted by COVID-19 effects. In particular, the significant acceleration of mortality among dialysis patients due to COVID-19 is expected to have a material impact on Fresenius Medical Care’s results and hence on Fresenius Group’s net income2 growth.
1In constant currency
2Net income attributable to shareholders of Fresenius SE & Co. KGaA; in constant currency; before any special items and any one-time expenses related to likely efficiency and cost saving programs
Fresenius continues to monitor and analyse the COVID-19 pandemic and associated implications, including the availability of government support, as well as pace, adoption and effectiveness of vaccinations, and will comment further as part of its FY/20 earnings call.
Stephan Sturm, CEO of Fresenius, said: “In 2020, we coped well with the burdens and restrictions caused by the pandemic. For 2021, I am confident that our Company will continue to perform solidly - despite the COVID-related impact on earnings anticipated at Fresenius Medical Care. Our underlying growth prospects remain robust. Fresenius continues to make a significant contribution to overcoming this global health crisis as swiftly as possible. Since the beginning of the pandemic, we have made an enormous effort to ensure that our patients continue to receive excellent medical care and that they – as well as our employees – are protected from infection. For this to succeed, close cooperation between all partners in the healthcare sector is needed more than ever, backed by political support. For instance, the conditions must be created to vaccinate the particularly vulnerable group of dialysis patients with high priority. We must not forget: Behind the numbers are people’s fates. Every single patient, every life counts.”
Efficiency and cost saving programs
To counter the current challenging business environment, Fresenius will launch additional initiatives across the Group to further improve profitability. More details will be announced with the publication of FY/20 results.
Group medium-term targets
The current information and assumptions do not trigger a revision of Fresenius’ medium-term growth targets, which were set before the COVID-19 pandemic emerged. As usual, the company will give an update on its medium-term expectations with the publication of its FY/20 results.
Next steps
Fresenius will announce more detailed FY/21 financial guidance with the release of its FY/20 results on February 23, 2021.
This release contains forward-looking statements that are subject to various risks and uncertainties. Future results could differ materially from those described in these forward-looking statements due to certain factors, e.g. changes in business, economic and competitive conditions, regulatory reforms, results of clinical trials, foreign exchange rate fluctuations, uncertainties in litigation or investigative proceedings, and the availability of financing. Fresenius does not undertake any responsibility to update the forward-looking statements in this release.
Fresenius has proven the resilience of its business model in a challenging environment in FY/20. Based on preliminary and unaudited results, Fresenius achieved its sales and net income1 guidance including COVID-19 effects. Fresenius expected sales growth2 of 3% to 6% and a net income1,3 development at the lower end of a range of -4% to +1%, both in constant currency.
Excluding estimated COVID-19 effects, the Group performed very well against its original guidance ranges of 4% to 7% sales growth and 1% to 5% net income1,3 growth, both in constant currency.
The previously flagged risk of an impairment of goodwill and tradenames at Fresenius Medical Care Latin America, as a consequence of the macro-economic downturn and increasing risk adjustment rates for certain countries in Latin America, has materialized and impacts reported FY/20 Group net income1.
Fresenius firmly intends to extend its track record of 27 consecutive dividend increases.
1 Net income attributable to shareholders of Fresenius SE & Co. KGaA
2 FY/19 base: €35,409 million
3 FY/19 base: €1,879 million; before special items (transaction-related expenses, revaluations of biosimilars contingent purchase price liabilities, gain related to divestitures of Care Coordination activities at FMC, expenses associated with the cost optimization program at FMC); FY/20: before special items
Current expectations for FY/21
Based on the current status of the Group’s financial planning process and assuming that the current burdens and constraints caused by the COVID-19 pandemic only begin to recede in the second half of the year, Fresenius targets healthy sales growth1 and at least broadly stable net income2 year over year in FY/21.
The FY/21 earnings are, hence, expected to be very meaningfully impacted by COVID-19 effects. In particular, the significant acceleration of mortality among dialysis patients due to COVID-19 is expected to have a material impact on Fresenius Medical Care’s results and hence on Fresenius Group’s net income2 growth.
Fresenius continues to monitor and analyse the COVID-19 pandemic and associated implications, including the availability of government support, as well as pace, adoption and effectiveness of vaccinations, and will comment further as part of its FY/20 earnings call.
Stephan Sturm, CEO of Fresenius, said: “In 2020, we coped well with the burdens and restrictions caused by the pandemic. For 2021, I am confident that our Company will continue to perform solidly - despite the COVID-related impact on earnings anticipated at Fresenius Medical Care. Our underlying growth prospects remain robust. Fresenius continues to make a significant contribution to overcoming this global health crisis as swiftly as possible. Since the beginning of the pandemic, we have made an enormous effort to ensure that our patients continue to receive excellent medical care and that they – as well as our employees – are protected from infection. For this to succeed, close cooperation between all partners in the healthcare sector is needed more than ever, backed by political support. For instance, the conditions must be created to vaccinate the particularly vulnerable group of dialysis patients with high priority. We must not forget: Behind the numbers are people’s fates. Every single patient, every life counts.”
1 In constant currency
2 Net income attributable to shareholders of Fresenius SE & Co. KGaA; in constant currency; before any special items and any one-time expenses related to likely efficiency and cost saving programs
Efficiency and cost saving programs
To counter the current challenging business environment, Fresenius will launch additional initiatives across the Group to further improve profitability. More details will be announced with the publication of FY/20 results.
Group medium-term targets
The current information and assumptions do not trigger a revision of Fresenius’ medium-term growth targets, which were set before the COVID-19 pandemic emerged. As usual, the company will give an update on its medium-term expectations with the publication of its FY/20 results.
Next steps
Fresenius will announce more detailed FY/21 financial guidance with the release of its FY/20 results on February 23, 2021.
For additional information on the performance indicators used please refer to our website at https://www.fresenius.com/alternative-performance-measures.
This release contains forward-looking statements that are subject to various risks and uncertainties. Future results could differ materially from those described in these forward-looking statements due to certain factors, e.g. changes in business, economic and competitive conditions, regulatory reforms, results of clinical trials, foreign exchange rate fluctuations, uncertainties in litigation or investigative proceedings, and the availability of financing. Fresenius does not undertake any responsibility to update the forward-looking statements in this release.
Fresenius has once again improved in this year's CDP ranking (formerly "Carbon Disclosure Project"). With a ranking in the second highest category B, Fresenius is one of the leading companies in the health care sector, both in Europe and globally. Companies in categories A and B are characterized by transparency, coordinated climate protection measures and the implementation of corresponding best-practice approaches. CDP is one of the most renowned climate and environmental rankings in the capital market. More than 515 investors use the annual results to evaluate climate protection activities and climate-related risks and opportunities of the companies assessed.
Fresenius has once again improved in this year's CDP ranking (formerly "Carbon Disclosure Project"). With a ranking in the second highest category B, Fresenius is one of the leading companies in the health care sector, both in Europe and globally. Companies in categories A and B are characterized by transparency, coordinated climate protection measures and the implementation of corresponding best-practice approaches. CDP is one of the most renowned climate and environmental rankings in the capital market. More than 515 investors use the annual results to evaluate climate protection activities and climate-related risks and opportunities of the companies assessed.
- Fresenius Medical Care with continued strong earnings growth in constant currency
- Fresenius Kabi showed a recovery in Europe and return to growth in China whilst headwinds weigh on North American business
- Helios Germany with sales growth in Q3 due to recovery of elective procedures; Helios Spain with significant growth based on catch-up effects
- Fresenius Vamed continues to be heavily impacted by COVID-19 related project delays, high-end technical service remained robust
If no timeframe is specified, information refers to Q3/2020; 2020 and 2019 according to IFRS 16

1 Before special items
2 Net income attributable to shareholders of Fresenius SE & Co. KGaA
For a detailed overview of special items please see the reconciliation tables on pages 17-19 in the PDF document.
Stephan Sturm, CEO of Fresenius, said: "Fresenius remains stable and resilient, and was able to show it once again in the third quarter. Despite the ongoing and in some cases drastic restrictions caused by COVID-19, our patients could continue to rely on and benefit from our care. Fresenius is also reliable, in terms of business development: We forecasted that after a second quarter impacted by the lockdowns our sales and earnings would resume their positive trajectory – and they did just that. Despite the coronavirus, we were even able to achieve a strong increase in sales over last year’s third quarter. Our quarterly earnings of €427 million are also robust. We are well prepared for the challenges that the pandemic will pose to us over the coming months. As a result, I remain confident that we will reach our 2020 targets and continue our healthy growth in the coming years."
FY/20 Group guidance
Based on the Group’s solid business development in Q1-3/20, Fresenius confirms its sales and net income guidance for 2020 including estimated COVID-19 effects. Fresenius projects sales growth1 of 3% to 6% in constant currency. Net income2,3 is expected to develop in a range of - 4% to +1%.
Fresenius projects net debt/EBITDA4 to be around the top-end of the self-imposed target corridor of 3.0x to 3.5x by the end of FY/20 including estimated COVID-19 effects.
COVID-19 will continue to impact Fresenius’ operations in Q4/20. Fresenius recognizes the increasing COVID-19 case numbers, and the associated various containment measures being enacted in many of the Company’s relevant markets. Thus, the Group’s FY/20 guidance assumes no containment measures that have a significant and direct impact on the health care sector that are not appropriately compensated.
1 FY/19 base: €35,409 million
2 Net income attributable to shareholders of Fresenius SE & Co. KGaA
3 FY/19 base: €1,879 million; before special items (transaction-related expenses, revaluations of biosimilars contingent purchase price liabilities, gain related to divestitures of Care Coordination activities at FMC, expenses associated with the cost optimization program at FMC); FY/20: before special items
4 At LTM average exchange rates for both net debt and EBITDA; pro forma closed acquisitions/divestitures; excluding further potential acquisitions; before special items
For a detailed overview of special items please see the reconciliation tables on pages 17-19 in the PDF document.
5% sales growth in constant currency
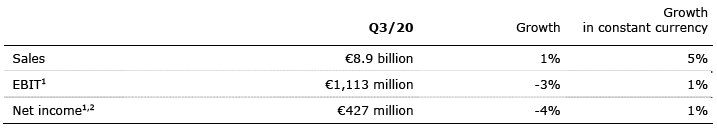
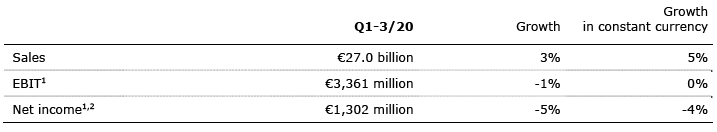
Group sales increased by 1% (5% in constant currency) to €8,918 million (Q3/19: €8,842 million). Organic sales growth was 3%. Acquisitions/divestitures contributed net 2% to growth. Currency translation had a negative impact on sales growth of 4%. Excluding estimated COVID-19 effects1, Group sales growth would have been 6% to 7%, in constant currency. In Q1-3/20, Group sales increased by 3% (5% in constant currency) to €26,973 million (Q1-3/19: €26,098 million). Organic sales growth was 3%. Acquisitions/divestitures contributed net 2% to growth. Currency translation had a negative impact on sales growth of 2%. Excluding estimated COVID-19 effects1, Group sales growth would have been 7% to 8% in constant currency.
1% net income2,3 growth in constant currency
Group EBITDA decreased by 2% (increased by 2% in constant currency) to €1,729 million (Q3/192: €1,763 million). In Q1-3/20, Group EBITDA increased by 2% (2% in constant currency) to €5,246 million (Q1-3/192: €5,167 million).
Group EBIT decreased by 3% (increased by 1% in constant currency) to €1,113 million (Q3/192: €1,153 million). The missing contribution from elective procedures, volume headwinds leading to underutilized production capacities, COVID-19 related project delays at Fresenius Vamed as well as Group-wide COVID-19 related expenses weighed on EBIT. The EBIT margin was 12.5% (Q3/192: 13.0%). In Q1-3/20, Group EBIT decreased by 1% (0% in constant currency) to €3,361 million (Q1-3/192: €3,401 million). The EBIT margin was 12.5% (Q1-3/192: 13.0%). Following higher levels of investments in recent years, Fresenius sees higher levels of depreciation and amortization in 2020.
Group net interest before special items improved to -€154 million (Q3/19: -€171 million) mainly due to successful refinancing activities, lower interest rates as well as currency translation effects. Reported Group net interest improved to -€154 million (Q3/19: -€172 million). In Q1-3/20, Group net interest before special items improved to -€495 million (Q1-3/19: -€532 million) while reported Group net interest improved to -€503 million (Q1-3/19: -€535 million).
1 For estimated COVID-19 effects in Q3/20 and Q1-3/20 please see table on page 15 in the PDF document.
2 Before special items
3 Net income attributable to shareholders of Fresenius SE & Co. KGaA
For a detailed overview of special items please see the reconciliation tables on pages 17-19 in the PDF document.
The Group tax rate before special items (Q3/19: 23.1%) and the reported Group tax rate (Q3/19: 21.2%) were 22.0%. In Q1-3/20, the Group tax rate before special items (Q1-3/19: 23.1%) and the reported Group tax rate (Q1-3/19: 22.4%) were 22.7%.
Noncontrolling interests before special items and reported noncontrolling interests were €321 million (Q3/19: both €310 million), of which 97% were attributable to the noncontrolling interests in Fresenius Medical Care. In Q1-3/20, noncontrolling interests before special items and reported were €913 million (Q1-3/19 before special items: €834 million; reported €826 million).
Group net income1 before special items decreased by 4% (increased by 1% in constant currency) to €427 million (Q3/19: €445 million). Excluding estimated COVID-19 effects2, net income before special items and in constant currency would have grown 1% to 5%. Reported Group net income1 was €427 million (Q3/19: €444 million). In Q1-3/20, Group net income1 before special items decreased by 5% (-4% in constant currency) to €1,302 million (Q1-3/19: €1,373 million). Excluding estimated COVID-19 effects2, net income before special items and in constant currency would have grown 2% to 6%. Reported Group net income1 was €1,297 million (Q1-3/19: €1,368 million).
Earnings per share1 before special items decreased by 4% (0% in constant currency) to €0.77 (Q3/19: €0.80). Reported earnings per share1 were €0.77 (Q3/19: €0.80). In Q1-3/20, earnings per share1 before special items decreased by 5% (-4% in constant currency) to €2.34 (Q1-3/19: €2.47). Reported earnings per share1 were €2.33 (Q1-3/19: €2.46).
Continued investment in growth
Spending on property, plant and equipment was €521 million corresponding to 6% of sales (Q3/19: €586 million; 7% of sales). These investments served primarily for the modernization and expansion of dialysis clinics, production facilities as well as hospitals, and day clinics. Despite the COVID-19 pandemic, Fresenius has been largely able to continue its investment programs, although there remains some uncertainty on the timing of projects for the remainder of the year. In Q1-3/20, spending on property, plant and equipment was €1,542 million corresponding to 6% of sales (Q1-3/19: €1,592 million; 6% of sales).
Total acquisition spending was €142 million (Q3/19: €135 million). In Q1-3/20, total acquisition spending was €651 million, mainly for the acquisition of three hospitals in Colombia by Fresenius Helios (Q1-3/19: €2,292 million, mainly for the acquisition of NxStage by Fresenius Medical Care).
1 Net income attributable to shareholders of Fresenius SE & Co. KGaA
2 For estimated COVID-19 effects in Q3/20 and Q1-3/20 please see table on page 15 in the PDF document.
For a detailed overview of special items please see the reconciliation tables on pages 17-19 in the PDF document.
Good cash flow development
Group operating cash flow was €1,199 million (Q3/19: €1,483 million) with a margin of 13.4% (Q3/19: 16.8%). Free cash flow before acquisitions and dividends was €682 million (Q3/19: €907 million). Given dividend payment in Q3/20 versus Q2/19, Free cash flow after acquisitions and dividends was -€185 million (Q3/19: €732 million).
In Q1-3/20, Group operating cash flow increased to €5,159 million (Q1-3/19: €2,977 million) with a margin of 19.1% (Q1-3/19: 11.4%). The increase was largely driven by Fresenius Medical Care due to the U.S. federal relief funding and advanced payments under the Coronavirus Aid, Relief and Economic Security Act (CARES Act) as well as by the shorter payment periods of the COVID-19 governmental compensation and reimbursement scheme for Helios Germany. Free cash flow before acquisitions and dividends was €3,593 million (Q1-3/19: €1,388 million). Free cash flow after acquisitions and dividends was €2,149 million (Q1-3/19: -€1,634 million, driven by the acquisition of NxStage by Fresenius Medical Care).
Solid balance sheet structure
Group total assets increased by 2% (5% in constant currency) to €68,321 million (Dec. 31, 2019: €67,006 million). Current assets increased by 10% (15% in constant currency) to €16,833 million (Dec. 31, 2019: €15,264 million), mainly driven by the increase of cash and cash equivalents. Non-current assets remained nearly unchanged (2% in constant currency) at €51,488 million (Dec. 31, 2019: €51,742 million).
Total shareholders’ equity decreased by 1% (increased by 4% in constant currency) to €26,201 million (Dec. 31, 2019: €26,580 million). The equity ratio was 38.3% (Dec. 31, 2019: 39.7%).
Group debt remained nearly unchanged (increased by 1% in constant currency) at €27,171 million (Dec. 31, 2019: € 27,258 million). Group net debt decreased by 4% (-3% in constant currency) to € 24,513 million (Dec. 31, 2019: € 25,604 million), driven by the exceptional cash flow development.
As of September 30, 2020, the net debt/EBITDA ratio improved to 3.45x1,2 (Dec. 31, 2019: 3.61x1,2) driven by the exceptional cash flow development, despite COVID-19 effects weighing on EBITDA.
1 At LTM average exchange rates for both net debt and EBITDA; pro forma closed acquisitions/divestitures
2 Before special items
For a detailed overview of special items please see the reconciliation tables on pages 17-19 in the PDF document.
Business Segments
Fresenius Medical Care (Financial data according to Fresenius Medical Care press release)
Fresenius Medical Care is the world's largest provider of products and services for individuals with renal diseases. As of September 30, 2020, Fresenius Medical Care was treating 349,167 patients in 4,073 dialysis clinics. Along with its core business, the company provides related medical services in the field of Care Coordination.

- Solid sales and strong earnings growth at constant currency continues in Q3
- Q3 development impacted by currency headwinds and expected lower reimbursement from calcimimetics
- Guidance for FY/20 confirmed
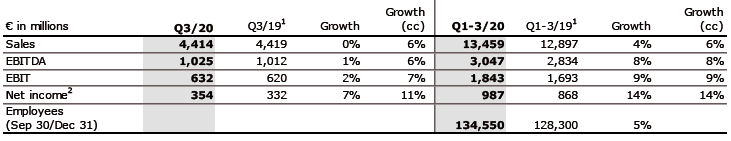
Sales of Fresenius Medical Care remained on prior year’s level (increased by 6% in constant currency) at €4,414 million (Q3/19: €4,419 million). Organic sales growth was 3%. Acquisitions/divestitures contributed net 3% to growth. In Q1-3/20, Fresenius Medical Care increased sales by 4% (6% in constant currency) to €13,459 million (Q1-3/19: €12,897 million). Organic sales growth was 4%.
There were no adjustments to reported EBIT in Q3/20 and Q1-3/20. Reported EBIT increased by 6% (11% in constant currency) to €632 million (Q3/19: €595 million). The reported EBIT margin was 14.3% (Q3/19: 13.5%). The increase in margin was driven by negative prior year earnings effects, an increase in commercial revenue and favorable cost management of pharmaceuticals, offsetting the lower reimbursement for calcimimetics, all in the North America region. EBIT on an adjusted basis increased by 2% (7% in constant currency) to €632 million (Q3/19: €620 million). The EBIT margin on an adjusted basis was 14.3% (Q3/19: 14.0%).
1 Before special items
2 Net income attributable to shareholders of Fresenius Medical Care AG & Co. KGaA
For a detailed overview of special items please see the reconciliation tables on pages 17-19 in the PDF document.
In Q1-3/20, reported EBIT increased by 11% (12% in constant currency) to €1,843 million (Q1-3/19: €1,653 million). The reported EBIT margin was 13.7% (Q1-3/19: 12.8%). EBIT on an adjusted basis increased by 9% (9% in constant currency) to €1,843 million (Q1-3/19: €1,693 million). The EBIT margin on an adjusted basis was 13.7% (Q1-3/19: 13.1%).
There were no adjustments to reported net income in Q3/20 and Q1-3/20. Reported net income1 grew by 6% (11% in constant currency) to €354 million (Q3/19: €333 million) and increased on an adjusted basis by 7% (11% in constant currency) to €354 million (Q3/19: €332 million). In Q1-3/20, reported net income1 grew by 15% (15% in constant currency) to €987 million (Q1-3/19: €857 million) and increased on an adjusted basis by 14% (14% in constant currency) to €987 million (Q1-3/19: €868 million).
Operating cash flow was €746 million (Q3/19: €868 million) with a margin of 16.9% (Q3/19: 19.7%). In Q1-3/20, operating cash flow was €3,649 million (Q1-3/19: €1,796 million) with a margin of 27.1% (Q1-3/19: 13.9%). The increase was largely driven by the U.S. federal relief funding and advanced payments under the CARES Act and other COVID-19 relief, as well as working capital improvements driven by cash collections.
Fresenius Medical Care continues to expect both revenue2 and net income1,3 to grow at a mid to high single digit rate in 2020. These targets are inclusive of anticipated COVID-19 effects, in constant currency and exclude special items4. They are based on the adjusted results 2019, including the effects of the operations of the NxStage acquisition and the IFRS 16 implementation.
For further information, please see Fresenius Medical Care’s press release at www.freseniusmedicalcare.com.
1 Net income attributable to shareholders of Fresenius Medical Care AG & Co. KGaA
2 FY/19 base: €17,477 million
3 FY/19 base: €1,236 million (FY/20: before special items)
4 Special items are effects that are unusual in nature and have not been foreseeable or not foreseeable in size or impact at the time of giving guidance.
For a detailed overview of special items please see the reconciliation tables on pages 17-19 in the PDF document.
Fresenius Kabi
Fresenius Kabi offers intravenously administered generic drugs, clinical nutrition and infusion therapies for seriously and chronically ill patients in the hospital and outpatient environments. The company is also a leading supplier of medical devices and transfusion technology products. In the biosimilars business, Fresenius Kabi develops products with a focus on oncology and autoimmune diseases.

- In North America decreased demand given fewer elective treatments and some supply constraints due to temporary manufacturing issues outweighed extra demand for COVID-19 related products
- China recovery accelerates with elective treatments rebounding nearly to pre-pandemic levels
- Strong EBIT growth in Europe and positive development in China only partially compensates EBIT decrease in North America
- FY/20 guidance confirmed
Sales decreased by 4% (increased by 2% in constant currency) to €1,694 million (Q3/19: €1,761 million). Organic sales growth was 2%. Negative currency translation effects of 6% were mainly related to weakness of the US dollar, the Brazilian real and the Argentinian peso. Estimated COVID-19 effects had a slight negative impact on sales growth. In Q1-3/20, sales remained on prior year’s level (increased by 3% in constant currency) at €5,161 million (Q1-3/19: €5,153 million). Organic sales growth was 3%. Negative currency translation effects of 3% were mainly related to weakness of the Brazilian real and the Argentinian peso. Estimated COVID-19 effects had a slight negative impact on sales growth in Q1-3/20.
Sales in North America decreased by 10% (organic growth: -5%) to €558 million (Q3/19: €619 million). The decrease was driven by fewer elective treatments and supply constraints for certain products due to temporary manufacturing issues, which outweighed extra demand for COVID-19 related products. In Q1-3/20, sales in North America increased by 1% (organic growth: 1%) to €1,827 million (Q1-3/19: €1,815 million). Sales in Europe increased by 3% (organic growth: 5%) to €581 million (Q3/19: €564 million). In Q1-3/20, sales in Europe increased by 4% (organic growth: 5%) to €1,778 million (Q1-3/19: €1,709 million). Sales in Asia-Pacific decreased by 2% (organic growth: increased by 1%) to €399 million (Q3/19: €406 million). While China saw a solid recovery based on increasing elective procedures, other Asian markets are lagging behind. In Q1-3/20, sales in Asia-Pacific decreased by 5% (organic growth: -3%) to €1,069 million (Q1-3/19: €1,121 million).
Sales in Latin America/Africa decreased by 9% (organic growth increased by 17%) to €156 million (Q3/19: €172 million). In Q1-3/20, sales in Latin America/Africa decreased by 4% (organic growth increased by 17%) to €487 million (Q1-3/19: €508 million).
EBIT before special items decreased by 9% (-4% in constant currency) to €278 million (Q3/191: €307 million) with an EBIT margin of 16.4% (Q3/191:17.4%). The decline is driven by headwinds leading to some underutilized production capacities in the US, coupled with selective supply constraints due to temporary manufacturing issues, incremental COVID-19 related expenses as well as a negative effect related to a write down of a receivable. Estimated COVID-19 effects, primarily lower share based remuneration costs given the capital markets situation, but also lower corporate costs due to travel restrictions and phasing of projects, had a moderate positive impact on EBIT growth. In Q1-3/20, EBIT before special items decreased by 7% (-5% in constant currency) to €859 million (Q1-3/191: €920 million) with an EBIT margin of 16.6% (Q1-3/191: 17.9%). Estimated COVID-19 effects had a slight positive impact on EBIT growth in Q1-3/20.
Net income1,2 decreased by 7% (-1% in constant currency) to €189 million (Q3/19: €203 million). In Q1-3/20, net income1,2 decreased by 5% (-3% in constant currency) to €582 million (Q1-3/19: €614 million).
Operating cash flow decreased to €225 million (Q3/19: €377 million) with a margin of 13.3% (Q3/19: 21.4%). After an excellent operating cash flow in Q2/20 that was marked by early cash receipts and tax payment holidays, Fresenius Kabi saw the respective reversal in Q3/20. In Q1-3/20, operating cash flow increased by 13% to €836 million (Q1-3/19: €737 million) with a margin of 16.2% (Q1-3/19: 14.3%).
Fresenius Kabi confirms its outlook including estimated COVID-19 effects and projects organic sales3 growth of 2% to 5% and an EBIT4 development of -6% to -3% in constant currency.
1 Before special items
2 Net income attributable to shareholders of Fresenius SE & Co. KGaA
3 FY/19 base: €6,919 million
4 FY/19 base: €1,205 million, before special items, FY/20: before special items
For a detailed overview of special items please see the reconciliation tables on pages 17-19 in the PDF document.
Fresenius Helios
Fresenius Helios is Europe's leading private hospital operator. The company comprises Helios Germany and Helios Spain (Quirónsalud). Helios Germany operates 86 hospitals, ~125 outpatient centers and 6 prevention centers. Quirónsalud operates 46 hospitals, 70 outpatient centers and around 300 occupational risk prevention centers. In addition, the company is active in Latin America with 7 hospitals and as a provider of medical diagnostics.

- Recovery of elective procedures in Germany and Spain
- Helios Spain with significant growth based on catch-up effects; momentum accelerated by dynamic growth of outpatient treatments
- FY/20 guidance confirmed
Sales increased by 8% (8% in constant currency) to €2,400 million (Q3/19: €2,230 million). Organic growth was 6%. Acquisitions contributed 2% to sales growth. COVID-19 effects had an insignificant effect on organic sales growth. In Q1-3/20, Fresenius Helios increased sales by 4% (5% in constant currency) to €7,181 million (Q1-3/19: €6,890 million). Organic growth was 3%. Acquisitions contributed 2% to sales growth. COVID-19 effects had a moderate negative impact on organic sales growth in Q1-3/20. Fresenius sees a gradual recovery of elective procedures in Germany and Spain since May.
Sales of Helios Germany increased by 4% (organic growth: 4%) to €1,529 million (Q3/19: €1,474 million). In Q1-3/20, Sales of Helios Germany increased by 5% (organic growth: 5%) to €4,703 million (Q1-3/19: €4,465 million). Due to the law to ease the financial burden on hospitals, COVID-19 effects had only a slight negative impact on organic sales growth in both, Q3/20 and in Q1-3/20.
Sales of Helios Spain increased by 15% (17% in constant currency) to €870 million (Q3/19: €757 million). Organic growth of 10% was driven by a strong recovery of elective procedures and additionally fueled by increased outpatient treatments. Thus COVID-19 effects had a slight positive impact on organic sales growth. The hospital acquisitions in Colombia contributed 7% to sales growth. In Q1-3/20, sales of Helios Spain increased by 2% (3% in constant currency) to €2,476 million (Q1-3/19: €2,425 million). Organic growth was -2%. Acquisitions contributed 5% to sales growth. COVID-19 effects had a significant negative impact on organic sales growth in Q1-3/20.
EBIT of Fresenius Helios increased by 20% (20% in constant currency) to €225 million (Q3/19: €187 million) with an EBIT margin of 9.4% (Q3/19: 8.4%). COVID-19 effects had a significant positive effect on EBIT growth. In Q1-3/20, EBIT of Fresenius Helios decreased by 5% (-5% in constant currency) to €697 million (Q1-3/19: €731 million) with an EBIT margin of 9.7% (Q1-3/19: 10.6%). COVID-19 effects had a significant negative impact on EBIT growth in Q1-3/20.
EBIT of Helios Germany increased by 2% to €133 million (Q3/19: €131 million) with an EBIT margin of 8.7% (Q3/19: 8.9%). In Q1-3/20, EBIT of Helios Germany increased by 3% to €445 million (Q1-3/19: €434 million) with an EBIT margin of 9.5% (Q1-3/19: 9.7%). Due to the law to ease the financial burden on hospitals, COVID-19 effects had only a slight negative impact on EBIT growth in both Q3/20 and Q1-3/20.
EBIT of Helios Spain increased by 61% (63% in constant currency) to €95 million (Q3/19: €59 million) with an EBIT margin of 10.9% (Q3/19: 7.8%). The growth is driven by a recovery of elective procedures following the government-ordered postponement of planned surgical procedures in Q2, where medically justifiable. Thus, COVID-19 effects had a very significant positive effect on EBIT growth in Q3/20. In Q1-3/20, EBIT of Helios Spain decreased by 15% (-15% in constant currency) to €261 million (Q1-3/19: €307 million) with an EBIT margin of 10.5% (Q1-3/19: 12.7%). COVID-19 effects had a significant negative impact on EBIT growth in Q1-3/20 with missing or delayed elective procedures and higher expenses amidst the comprehensive efforts to combat the pandemic.
Net income1 increased by 27% to €142 million (Q3/19: €112 million). In Q1-3/20, net income1 decreased by 6% to €441 million (Q1-3/19: €467 million).
Operating cash flow increased to €275 million (Q3/19: €196 million) with a margin of 11.5% (Q3/19: 8.8%), driven by phasing of payments under the German law to ease the financial burden on hospitals. In Q1-3/20, operating cash flow increased to €715 million (Q1-3/19: €507 million) with a margin of 10.0% (Q1-3/19: 7.4%).
Fresenius Helios confirms its outlook including estimated COVID-19 effects and expects organic sales2 growth of 1% to 4% and EBIT3 broadly stable over FY/19 in constant currency.
1 Net income attributable to shareholders of Fresenius SE & Co. KGaA
2 FY/19 base: €9,234 million
3 FY/19 base: €1,025 million
Fresenius Vamed
Fresenius Vamed manages projects and provides services for hospitals and other health care facilities worldwide and is a leading post-acute care provider in Central Europe. The portfolio ranges along the entire value chain: from project development, planning, and turnkey construction, via maintenance and technical management to total operational management.

- Significant negative COVID-19 impact continued through Q3
- Projects and project order intake continued to be marked by delays, cancellations and global supply chain restraints due to COVID-19
- Lower capacities in the post-acute-care business due to health authority induced capacity restrictions and postponements of elective surgeries; less demand for rehabilitation treatments; high-end technical service remained robust
- FY/20 EBIT guidance revised
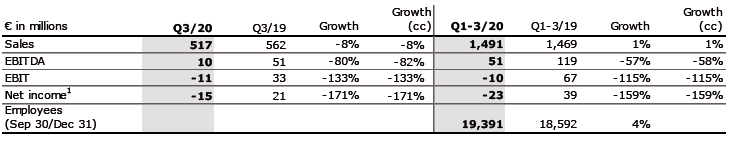
Sales of Fresenius Vamed decreased by 8% (-8% in constant currency) to €517 million (Q3/19: €562 million). Organic sales growth was -10%. Acquisitions contributed 2% to growth. Estimated COVID-19 effects had a significant negative impact on growth in Q3/20. In Q1-3/20, Fresenius Vamed increased sales by 1% (1% in constant currency) to €1,491 million (Q1-3/19: €1,469 million). Organic sales growth was -1%. Acquisitions contributed 2% to growth. Estimated COVID-19 effects had a significant negative impact on sales growth in Q1-3/20.
Sales in the service business increased by 8% to €377 million (Q3/19: €349 million).
Sales in the project business decreased by 34% to €140 million (Q3/19: €213 million), driven by postponements and cancellations of projects. In Q1-3/20, sales in the service business grew by 4% to €1,063 million (Q1-3/19: €1,025 million). Sales in the project business decreased by 4% to €428 million (Q1-3/19: €444 million).
EBIT decreased by 133% (-133% in constant currency) to -€11 million (Q3/19: €33 million) with an EBIT margin of -2.1% (Q3/19: 5.9%). Estimated COVID-19 effects had a very significant negative impact on EBIT. Capacities in the post-acute care clinics were left empty given a generally lower intake of elective surgery patients from acute-care hospitals as well as authority-instigated restrictions or even closures of individual facilities. In the project business, project delays triggered incremental expenses. In Q1-3/20, EBIT decreased by 115% (-115% in constant currency) to -€10 million (Q1-3/19: €67 million) with an EBIT margin of -0.7% (Q1-3/19: 4.6%). Estimated COVID-19 effects had a very significant negative impact on EBIT in Q1-3/20.
Net income1 decreased to -€15 million (Q3/19: €21 million). In Q1-3/20, net income1 decreased to -€23 million (Q1-3/19: €39 million).
Order intake was €188 million in Q3/20 (Q3/19: €240 million) and €362 million in Q1-3/20 (Q1-3/19: €738 million). As of September 30, 2020, order backlog was at €2,786 million (December 31, 2019: €2,865 million). Order intake and order backlog were marked by COVID-19 related cancellations and project delays.
Operating cash flow decreased to -€4 million (Q3/19: €33 million) with a margin of -0.8% (Q3/19: 5.9%), driven by delayed payments in the project business, partially offset by minor compensation payments from governmental authorities related to the post-acute care business. In Q1-3/20, operating cash flow increased to €4 million (Q1-3/19: -€17 million) with a margin of 0.3% (Q1-3/19: -1.2%).
Fresenius Vamed confirms its sales outlook for FY/20 and expects an organic sales2 decline of ~10%. Ongoing significant negative Covid-19 effects are expected to weigh on EBIT in Q4/20. While Fresenius Vamed continues to project a positive EBIT3 amount for FY/20, the constant currency decline versus FY/19 is now expected to exceed the former outlook of ~50%. Both sales and EBIT outlook include estimated COVID-19 effects.
1 Net income attributable to shareholders of VAMED AG
2 FY/19 base: €2,206 million
3 FY/19 base: €134 million
Conference Call
As part of the publication of the results for Q3/2020, a conference call will be held on October 29, 2020 at 1:30 p.m. CET (8:30 a.m. EDT). All investors are cordially invited to follow the conference call in a live broadcast over the Internet at www.fresenius.com/investors. Following the call, a replay will be available on our website.
For additional information on the performance indicators used please refer to our website www.fresenius.com/alternative-performance-measures.
This release contains forward-looking statements that are subject to various risks and uncertainties. Future results could differ materially from those described in these forward-looking statements due to certain factors, e.g. changes in business, economic and competitive conditions, regulatory reforms, results of clinical trials, foreign exchange rate fluctuations, uncertainties in litigation or investigative proceedings, and the availability of financing. Fresenius does not undertake any responsibility to update the forward-looking statements in this release.
- Fresenius Medical Care with continued strong earnings growth in constant currency
- Fresenius Kabi showed a recovery in Europe and return to growth in China whilst headwinds weigh on North American business
- Helios Germany with sales growth in Q3 due to recovery of elective procedures; Helios Spain with significant growth based on catch-up effects
- Fresenius Vamed continues to be heavily impacted by COVID-19 related project delays, high-end technical service remained robust
If no timeframe is specified, information refers to Q3/2020; 2020 and 2019 according to IFRS 16
1 Before special items
2 Net income attributable to shareholders of Fresenius SE & Co. KGaA
For a detailed overview of special items please see the reconciliation tables on pages 17-19 in the PDF document.
Stephan Sturm, CEO of Fresenius, said: "Fresenius remains stable and resilient, and was able to show it once again in the third quarter. Despite the ongoing and in some cases drastic restrictions caused by COVID-19, our patients could continue to rely on and benefit from our care. Fresenius is also reliable, in terms of business development: We forecasted that after a second quarter impacted by the lockdowns our sales and earnings would resume their positive trajectory – and they did just that. Despite the coronavirus, we were even able to achieve a strong increase in sales over last year’s third quarter. Our quarterly earnings of €427 million are also robust. We are well prepared for the challenges that the pandemic will pose to us over the coming months. As a result, I remain confident that we will reach our 2020 targets and continue our healthy growth in the coming years."
FY/20 Group guidance
Based on the Group’s solid business development in Q1-3/20, Fresenius confirms its sales and net income guidance for 2020 including estimated COVID-19 effects. Fresenius projects sales growth1 of 3% to 6% in constant currency. Net income2,3 is expected to develop in a range of - 4% to +1%.
Fresenius projects net debt/EBITDA4 to be around the top-end of the self-imposed target corridor of 3.0x to 3.5x by the end of FY/20 including estimated COVID-19 effects.
COVID-19 will continue to impact Fresenius’ operations in Q4/20. Fresenius recognizes the increasing COVID-19 case numbers, and the associated various containment measures being enacted in many of the Company’s relevant markets. Thus, the Group’s FY/20 guidance assumes no containment measures that have a significant and direct impact on the health care sector that are not appropriately compensated.
1 FY/19 base: €35,409 million
2 Net income attributable to shareholders of Fresenius SE & Co. KGaA
3 FY/19 base: €1,879 million; before special items (transaction-related expenses, revaluations of biosimilars contingent purchase price liabilities, gain related to divestitures of Care Coordination activities at FMC, expenses associated with the cost optimization program at FMC); FY/20: before special items
4 At LTM average exchange rates for both net debt and EBITDA; pro forma closed acquisitions/divestitures; excluding further potential acquisitions; before special items
For a detailed overview of special items please see the reconciliation tables on pages 17-19 in the PDF document.
5% sales growth in constant currency
Group sales increased by 1% (5% in constant currency) to €8,918 million (Q3/19: €8,842 million). Organic sales growth was 3%. Acquisitions/divestitures contributed net 2% to growth. Currency translation had a negative impact on sales growth of 4%. Excluding estimated COVID-19 effects1 ,Group sales growth would have been 6% to 7%, in constant currency. In Q1-3/20, Group sales increased by 3% (5% in constant currency) to €26,973 million (Q1-3/19: €26,098 million). Organic sales growth was 3%. Acquisitions/divestitures contributed net 2% to growth. Currency translation had a negative impact on sales growth of 2%. Excluding estimated COVID-19 effects1, Group sales growth would have been 7% to 8% in constant currency.
1% net income2,3 growth in constant currency
Group EBITDA decreased by 2% (increased by 2% in constant currency) to €1,729 million (Q3/192: €1,763 million). In Q1-3/20, Group EBITDA increased by 2% (2% in constant currency) to €5,246 million (Q1-3/192: €5,167 million).
Group EBIT decreased by 3% (increased by 1% in constant currency) to €1,113 million (Q3/192: €1,153 million). The missing contribution from elective procedures, volume headwinds leading to underutilized production capacities, COVID-19 related project delays at Fresenius Vamed as well as Group-wide COVID-19 related expenses weighed on EBIT. The EBIT margin was 12.5% (Q3/192: 13.0%). In Q1-3/20, Group EBIT decreased by 1% (0% in constant currency) to €3,361 million (Q1-3/192: €3,401 million). The EBIT margin was 12.5% (Q1-3/192: 13.0%). Following higher levels of investments in recent years, Fresenius sees higher levels of depreciation and amortization in 2020.
Group net interest before special items improved to -€154 million (Q3/19: -€171 million) mainly due to successful refinancing activities, lower interest rates as well as currency translation effects. Reported Group net interest improved to -€154 million (Q3/19: -€172 million). In Q1-3/20, Group net interest before special items improved to -€495 million (Q1-3/19: -€532 million) while reported Group net interest improved to -€503 million (Q1-3/19: -€535 million).
1 For estimated COVID-19 effects in Q3/20 and Q1-3/20 please see table on page 15 in the PDF document.
2 Before special items
3 Net income attributable to shareholders of Fresenius SE & Co. KGaA
For a detailed overview of special items please see the reconciliation tables on pages 17-19 in the PDF document.
The Group tax rate before special items (Q3/19: 23.1%) and the reported Group tax rate (Q3/19: 21.2%) were 22.0%. In Q1-3/20, the Group tax rate before special items (Q1-3/19: 23.1%) and the reported Group tax rate (Q1-3/19: 22.4%) were 22.7%.
Noncontrolling interests before special items and reported noncontrolling interests were €321 million (Q3/19: both €310 million), of which 97% were attributable to the noncontrolling interests in Fresenius Medical Care. In Q1-3/20, noncontrolling interests before special items and reported were €913 million (Q1-3/19 before special items: €834 million; reported €826 million).
Group net income1 before special items decreased by 4% (increased by 1% in constant currency) to €427 million (Q3/19: €445 million). Excluding estimated COVID-19 effects2, net income before special items and in constant currency would have grown 1% to 5%. Reported Group net income1 was €427 million (Q3/19: €444 million). In Q1-3/20, Group net income1 before special items decreased by 5% (-4% in constant currency) to €1,302 million (Q1-3/19: €1,373 million). Excluding estimated COVID-19 effects2, net income before special items and in constant currency would have grown 2% to 6%. Reported Group net income1 was €1,297 million (Q1-3/19: €1,368 million).
Earnings per share1 before special items decreased by 4% (0% in constant currency) to €0.77 (Q3/19: €0.80). Reported earnings per share1 were €0.77 (Q3/19: €0.80). In Q1-3/20, earnings per share1 before special items decreased by 5% (-4% in constant currency) to €2.34 (Q1-3/19: €2.47). Reported earnings per share1 were €2.33 (Q1-3/19: €2.46).
Continued investment in growth
Spending on property, plant and equipment was €521 million corresponding to 6% of sales (Q3/19: €586 million; 7% of sales). These investments served primarily for the modernization and expansion of dialysis clinics, production facilities as well as hospitals, and day clinics. Despite the COVID-19 pandemic, Fresenius has been largely able to continue its investment programs, although there remains some uncertainty on the timing of projects for the remainder of the year. In Q1-3/20, spending on property, plant and equipment was €1,542 million corresponding to 6% of sales (Q1-3/19: €1,592 million; 6% of sales).
Total acquisition spending was €142 million (Q3/19: €135 million). In Q1-3/20, total acquisition spending was €651 million, mainly for the acquisition of three hospitals in Colombia by Fresenius Helios (Q1-3/19: €2,292 million, mainly for the acquisition of NxStage by Fresenius Medical Care).
1 Net income attributable to shareholders of Fresenius SE & Co. KGaA
2 For estimated COVID-19 effects in Q3/20 and Q1-3/20 please see table on page 15 in the PDF document.
For a detailed overview of special items please see the reconciliation tables on pages 17-19 in the PDF document.
Good cash flow development
Group operating cash flow was €1,199 million (Q3/19: €1,483 million) with a margin of 13.4% (Q3/19: 16.8%). Free cash flow before acquisitions and dividends was €682 million (Q3/19: €907 million). Given dividend payment in Q3/20 versus Q2/19, Free cash flow after acquisitions and dividends was -€185 million (Q3/19: €732 million).
In Q1-3/20, Group operating cash flow increased to €5,159 million (Q1-3/19: €2,977 million) with a margin of 19.1% (Q1-3/19: 11.4%). The increase was largely driven by Fresenius Medical Care due to the U.S. federal relief funding and advanced payments under the Coronavirus Aid, Relief and Economic Security Act (CARES Act) as well as by the shorter payment periods of the COVID-19 governmental compensation and reimbursement scheme for Helios Germany. Free cash flow before acquisitions and dividends was €3,593 million (Q1-3/19: €1,388 million). Free cash flow after acquisitions and dividends was €2,149 million (Q1-3/19: -€1,634 million, driven by the acquisition of NxStage by Fresenius Medical Care).
Solid balance sheet structure
Group total assets increased by 2% (5% in constant currency) to €68,321 million (Dec. 31, 2019: €67,006 million). Current assets increased by 10% (15% in constant currency) to €16,833 million (Dec. 31, 2019: €15,264 million), mainly driven by the increase of cash and cash equivalents. Non-current assets remained nearly unchanged (2% in constant currency) at €51,488 million (Dec. 31, 2019: €51,742 million).
Total shareholders’ equity decreased by 1% (increased by 4% in constant currency) to €26,201 million (Dec. 31, 2019: €26,580 million). The equity ratio was 38.3% (Dec. 31, 2019: 39.7%).
Group debt remained nearly unchanged (increased by 1% in constant currency) at €27,171 million (Dec. 31, 2019: € 27,258 million). Group net debt decreased by 4% (-3% in constant currency) to € 24,513 million (Dec. 31, 2019: € 25,604 million), driven by the exceptional cash flow development.
As of September 30, 2020, the net debt/EBITDA ratio improved to 3.45x1,2 (Dec. 31, 2019: 3.61x1,2) driven by the exceptional cash flow development, despite COVID-19 effects weighing on EBITDA.
1 At LTM average exchange rates for both net debt and EBITDA; pro forma closed acquisitions/divestitures
2 Before special items
For a detailed overview of special items please see the reconciliation tables on pages 17-19 in the PDF document.
Business Segments
Fresenius Medical Care (Financial data according to Fresenius Medical Care press release)
Fresenius Medical Care is the world's largest provider of products and services for individuals with renal diseases. As of September 30, 2020, Fresenius Medical Care was treating 349,167 patients in 4,073 dialysis clinics. Along with its core business, the company provides related medical services in the field of Care Coordination.
- Solid sales and strong earnings growth at constant currency continues in Q3
- Q3 development impacted by currency headwinds and expected lower reimbursement from calcimimetics
- Guidance for FY/20 confirmed
Sales of Fresenius Medical Care remained on prior year’s level (increased by 6% in constant currency) at €4,414 million (Q3/19: €4,419 million). Organic sales growth was 3%. Acquisitions/divestitures contributed net 3% to growth. In Q1-3/20, Fresenius Medical Care increased sales by 4% (6% in constant currency) to €13,459 million (Q1-3/19: €12,897 million). Organic sales growth was 4%.
There were no adjustments to reported EBIT in Q3/20 and Q1-3/20. Reported EBIT increased by 6% (11% in constant currency) to €632 million (Q3/19: €595 million). The reported EBIT margin was 14.3% (Q3/19: 13.5%). The increase in margin was driven by negative prior year earnings effects, an increase in commercial revenue and favorable cost management of pharmaceuticals, offsetting the lower reimbursement for calcimimetics, all in the North America region. EBIT on an adjusted basis increased by 2% (7% in constant currency) to €632 million (Q3/19: €620 million). The EBIT margin on an adjusted basis was 14.3% (Q3/19: 14.0%).
1 Before special items
2 Net income attributable to shareholders of Fresenius Medical Care AG & Co. KGaA
For a detailed overview of special items please see the reconciliation tables on pages 17-19 in the PDF document.
In Q1-3/20, reported EBIT increased by 11% (12% in constant currency) to €1,843 million (Q1-3/19: €1,653 million). The reported EBIT margin was 13.7% (Q1-3/19: 12.8%). EBIT on an adjusted basis increased by 9% (9% in constant currency) to €1,843 million (Q1-3/19: €1,693 million). The EBIT margin on an adjusted basis was 13.7% (Q1-3/19: 13.1%).
There were no adjustements to reported net income in Q3/20 and Q1-3/20. Reported net income1 grew by 6% (11% in constant currency) to €354 million (Q3/19: 333 million) and increased on an adjusted basis by 7% (11% in constant currency) to €354 million (Q3/19: €332 million). In Q1-3/20, reported net income1 grew by 15% (15% in constant currency) to €987 million (Q1-3/19: 857 million) and increased on an adjusted basis by 14% (14% in constant currency) to €987 million (Q1-3/19: €868 million).
Operating cash flow was €746 million (Q3/19: €868 million) with a margin of 16.9% (Q3/19: 19.7%). In Q1-3/20, operating cash flow was €3,649 million (Q1-3/19: €1,796 million) with a margin of 27.1% (Q1-3/19: 13.9%). The increase was largely driven by the U.S. federal relief funding and advanced payments under the CARES Act and other COVID-19 relief, as well as working capital improvements driven by cash collections.
Fresenius Medical Care continues to expect both revenue2 and net income1 to grow at a mid to high single digit rate in 2020. These targets are inclusive of anticipated COVID-19 effects, in constant currency and exclude special items4. They are based on the adjusted results 2019, including the effects of the operations of the NxStage acquisition and the IFRS 16 implementation.
For further information, please see Fresenius Medical Care’s press release at www.freseniusmedicalcare.com.
1 Net income attributable to shareholders of Fresenius Medical Care AG & Co. KGaA
2 FY/19 base: €17,477 million
3 FY/19 base: €1,236 million (FY/20: before special items)
4 Special items are effects that are unusual in nature and have not been foreseeable or not foreseeable in size or impact at the time of giving guidance.
For a detailed overview of special items please see the reconciliation tables on pages 17-19 in the PDF document.
Fresenius Kabi
Fresenius Kabi offers intravenously administered generic drugs, clinical nutrition and infusion therapies for seriously and chronically ill patients in the hospital and outpatient environments. The company is also a leading supplier of medical devices and transfusion technology products. In the biosimilars business, Fresenius Kabi develops products with a focus on oncology and autoimmune diseases.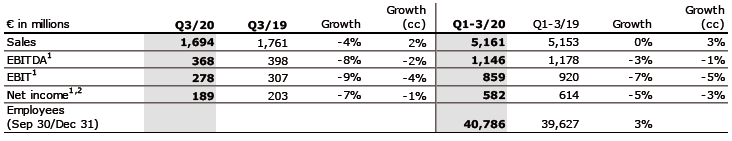
- In North America decreased demand given fewer elective treatments and some supply constraints due to temporary manufacturing issues outweighed extra demand for COVID-19 related products
- China recovery accelerates with elective treatments rebounding nearly to pre-pandemic levels
- Strong EBIT growth in Europe and positive development in China only partially compensates EBIT decrease in North America
- FY/20 guidance confirmed
Sales decreased by 4% (increased by 2% in constant currency) to €1,694 million (Q3/19: €1,761 million). Organic sales growth was 2%. Negative currency translation effects of 6% were mainly related to weakness of the US dollar, the Brazilian real and the Argentinian peso. Estimated COVID-19 effects had a slight negative impact on sales growth. In Q1-3/20, sales remained on prior year’s level (increased by 3% in constant currency) at €5,161 million (Q1-3/19: €5,153 million). Organic sales growth was 3%. Negative currency translation effects of 3% were mainly related to weakness of the Brazilian real and the Argentinian peso. Estimated COVID-19 effects had a slight negative impact on sales growth in Q1-3/20.
Sales in North America decreased by 10% (organic growth: -5%) to €558 million (Q3/19: €619 million). The decrease was driven by fewer elective treatments and supply constraints for certain products due to temporary manufacturing issues, which outweighed extra demand for COVID-19 related products. In Q1-3/20, sales in North America increased by 1% (organic growth: 1%) to €1,827 million (Q1-3/19: €1,815 million). Sales in Europe increased by 3% (organic growth: 5%) to €581 million (Q3/19: €564 million). In Q1-3/20, sales in Europe increased by 4% (organic growth: 5%) to €1,778 million (Q1-3/19: €1,709 million). Sales in Asia-Pacific decreased by 2% (organic growth: increased by 1%) to €399 million (Q3/19: €406 million). While China saw a solid recovery based on increasing elective procedures, other Asian markets are lagging behind. In Q1-3/20, sales in Asia-Pacific decreased by 5% (organic growth: -3%) to €1,069 million (Q1-3/19: €1,121 million).
Sales in Latin America/Africa decreased by 9% (organic growth increased by 17%) to €156 million (Q3/19: €172 million). In Q1-3/20, sales in Latin America/Africa decreased by 4% (organic growth increased by 17%) to €487 million (Q1-3/19: €508 million).
EBIT before special items decreased by 9% (-4% in constant currency) to €278 million (Q3/191: €307 million) with an EBIT margin of 16.4% (Q3/191:17.4%). The decline is driven by headwinds leading to some underutilized production capacities in the US, coupled with selective supply constraints due to temporary manufacturing issues, incremental COVID-19 related expenses as well as a negative effect related to a write down of a receivable. Estimated COVID-19 effects, primarily lower share based remuneration costs given the capital markets situation, but also lower corporate costs due to travel restrictions and phasing of projects, had a moderate positive impact on EBIT growth. In Q1-3/20, EBIT before special items decreased by 7% (-5% in constant currency) to €859 million (Q1-3/191: €920 million) with an EBIT margin of 16.6% (Q1-3/191: 17.9%). Estimated COVID-19 effects had a slight positive impact on EBIT growth in Q1-3/20.
Net income1,2 decreased by 7% (-1% in constant currency) to €189 million (Q3/19: €203 million). In Q1-3/20, net income1,2 decreased by 5% (-3% in constant currency) to €582 million (Q1-3/19: €614 million).
Operating cash flow decreased to €225 million (Q3/19: €377 million) with a margin of 13.3% (Q3/19: 21.4%). After an excellent operating cash flow in Q2/20 that was marked by early cash receipts and tax payment holidays, Fresenius Kabi saw the respective reversal in Q3/20. In Q1-3/20, operating cash flow increased by 13% to €836 million (Q1-3/19: €737 million) with a margin of 16.2% (Q1-3/19: 14.3%).
Fresenius Kabi confirms its outlook including estimated COVID-19 effects and projects organic sales3 growth of 2% to 5% and an EBIT4 development of -6% to -3% in constant currency.
1 Before special items
2 Net income attributable to shareholders of Fresenius SE & Co. KGaA
3 FY/19 base: €6,919 million
4 FY/19 base: €1,205 million, before special items, FY/20: before special items
For a detailed overview of special items please see the reconciliation tables on pages 17-19 in the PDF document.
Fresenius Helios
Fresenius Helios is Europe's leading private hospital operator. The company comprises Helios Germany and Helios Spain (Quirónsalud). Helios Germany operates 86 hospitals, ~125 outpatient centers and 6 prevention centers. Quirónsalud operates 46 hospitals, 70 outpatient centers and around 300 occupational risk prevention centers. In addition, the company is active in Latin America with 7 hospitals and as a provider of medical diagnostics.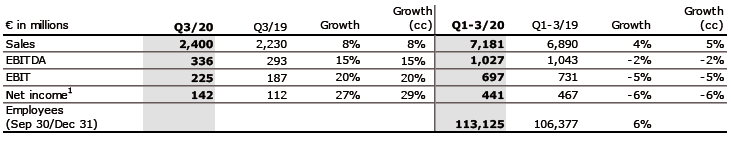
- Recovery of elective procedures in Germany and Spain
- Helios Spain with significant growth based on catch-up effects; momentum accelerated by dynamic growth of outpatient treatments
- FY/20 guidance confirmed
Sales increased by 8% (8% in constant currency) to €2,400 million (Q3/19: €2,230 million). Organic growth was 6%. Acquisitions contributed 2% to sales growth. COVID-19 effects had an insignificant effect on organic sales growth. In Q1-3/20, Fresenius Helios increased sales by 4% (5% in constant currency) to €7,181 million (Q1-3/19: €6,890 million). Organic growth was 3%. Acquisitions contributed 2% to sales growth. COVID-19 effects had a moderate negative impact on organic sales growth in Q1-3/20. Fresenius sees a gradual recovery of elective procedures in Germany and Spain since May.
Sales of Helios Germany increased by 4% (organic growth: 4%) to €1,529 million (Q3/19: €1,474 million). In Q1-3/20, Sales of Helios Germany increased by 5% (organic growth: 5%) to €4,703 million (Q1-3/19: €4,465 million). Due to the law to ease the financial burden on hospitals, COVID-19 effects had only a slight negative impact on organic sales growth in both, Q3/20 and in Q1-3/20.
Sales of Helios Spain increased by 15% (17% in constant currency) to €870 million (Q3/19: €757 million). Organic growth of 10% was driven by a strong recovery of elective procedures and additionally fueled by increased outpatient treatments. Thus COVID-19 effects had a slight positive impact on organic sales growth. The hospital acquisitions in Colombia contributed 7% to sales growth. In Q1-3/20, sales of Helios Spain increased by 2% (3% in constant currency) to €2,476 million (Q1-3/19: €2,425 million). Organic growth was -2%. Acquisitions contributed 5% to sales growth. COVID-19 effects had a significant negative impact on organic sales growth in Q1-3/20.
EBIT of Fresenius Helios increased by 20% (20% in constant currency) to €225 million (Q3/19: €187 million) with an EBIT margin of 9.4% (Q3/19: 8.4%). COVID-19 effects had a significant positive effect on EBIT growth. In Q1-3/20, EBIT of Fresenius Helios decreased by 5% (-5% in constant currency) to €697 million (Q1-3/19: €731 million) with an EBIT margin of 9.7% (Q1-3/19: 10.6%). COVID-19 effects had a significant negative impact on EBIT growth in Q1-3/20.
EBIT of Helios Germany increased by 2% to €133 million (Q3/19: €131 million) with an EBIT margin of 8.7% (Q3/19: 8.9%). In Q1-3/20, EBIT of Helios Germany increased by 3% to €445 million (Q1-3/19: €434 million) with an EBIT margin of 9.5% (Q1-3/19: 9.7%). Due to the law to ease the financial burden on hospitals, COVID-19 effects had only a slight negative impact on EBIT growth in both Q3/20 and Q1-3/20.
EBIT of Helios Spain increased by 61% (63% in constant currency) to €95 million (Q3/19: €59 million) with an EBIT margin of 10.9% (Q3/19: 7.8%). The growth is driven by a recovery of elective procedures following the government-ordered postponement of planned surgical procedures in Q2, where medically justifiable. Thus, COVID-19 effects had a very significant positive effect on EBIT growth in Q3/20. In Q1-3/20, EBIT of Helios Spain decreased by 15% (-15% in constant currency) to €261 million (Q1-3/19: €307 million) with an EBIT margin of 10.5% (Q1-3/19: 12.7%). COVID-19 effects had a significant negative impact on EBIT growth in Q1-3/20 with missing or delayed elective procedures and higher expenses amidst the comprehensive efforts to combat the pandemic.
Net income1 increased by 27% to €142 million (Q3/19: €112 million). In Q1-3/20, net income1 decreased by 6% to €441 million (Q1-3/19: €467 million).
Operating cash flow increased to €275 million (Q3/19: €196 million) with a margin of 11.5% (Q3/19: 8.8%), driven by phasing of payments under the German law to ease the financial burden on hospitals. In Q1-3/20, operating cash flow increased to €715 million (Q1-3/19: €507 million) with a margin of 10.0% (Q1-3/19: 7.4%).
Fresenius Helios confirms its outlook including estimated COVID-19 effects and expects organic sales2 growth of 1% to 4% and EBIT3 broadly stable over FY/19 in constant currency.
1 Net income attributable to shareholders of Fresenius SE & Co. KGaA
2 FY/19 base: €9,234 million
3 FY/19 base: €1,025 million
Fresenius Vamed
Fresenius Vamed manages projects and provides services for hospitals and other health care facilities worldwide and is a leading post-acute care provider in Central Europe. The portfolio ranges along the entire value chain: from project development, planning, and turnkey construction, via maintenance and technical management to total operational management.
- Significant negative COVID-19 impact continued through Q3
- Projects and project order intake continued to be marked by delays, cancellations and global supply chain restraints due to COVID-19
- Lower capacities in the post-acute-care business due to health authority induced capacity restrictions and postponements of elective surgeries; less demand for rehabilitation treatments; high-end technical service remained robust
- FY/20 EBIT guidance revised
Sales of Fresenius Vamed decreased by 8% (-8% in constant currency) to €517 million (Q3/19: €562 million). Organic sales growth was -10%. Acquisitions contributed 2% to growth. Estimated COVID-19 effects had a significant negative impact on growth in Q3/20. In Q1-3/20, Fresenius Vamed increased sales by 1% (1% in constant currency) to €1,491 million (Q1-3/19: €1,469 million). Organic sales growth was -1%. Acquisitions contributed 2% to growth. Estimated COVID-19 effects had a significant negative impact on sales growth in Q1-3/20.
Sales in the service business increased by 8% to €377 million (Q3/19: €349 million).
Sales in the project business decreased by 34% to €140 million (Q3/19: €213 million), driven by postponements and cancellations of projects. In Q1-3/20, sales in the service business grew by 4% to €1,063 million (Q1-3/19: €1,025 million). Sales in the project business decreased by 4% to €428 million (Q1-3/19: €444 million).
EBIT decreased by 133% (-133% in constant currency) to -€11 million (Q3/19: €33 million) with an EBIT margin of -2.1% (Q3/19: 5.9%). Estimated COVID-19 effects had a very significant negative impact on EBIT. Capacities in the post-acute care clinics were left empty given a generally lower intake of elective surgery patients from acute-care hospitals as well as authority-instigated restrictions or even closures of individual facilities. In the project business, project delays triggered incremental expenses. In Q1-3/20, EBIT decreased by 115% (-115% in constant currency) to -€10 million (Q1-3/19: €67 million) with an EBIT margin of -0.7% (Q1-3/19: 4.6%). Estimated COVID-19 effects had a very significant negative impact on EBIT in Q1-3/20.
Net income1 decreased to -€15 million (Q3/19: €21 million). In Q1-3/20, net income1 decreased to -€23 million (Q1-3/19: €39 million).
Order intake was €188 million in Q3/20 (Q3/19: €240 million) and €362 million in Q1-3/20 (Q1-3/19: €738 million). As of September 30, 2020, order backlog was at €2,786 million (December 31, 2019: €2,865 million). Order intake and order backlog were marked by COVID-19 related cancellations and project delays.
Operating cash flow decreased to -€4 million (Q3/19: €33 million) with a margin of -0.8% (Q3/19: 5.9%), driven by delayed payments in the project business, partially offset by minor compensation payments from governmental authorities related to the post-acute care business. In Q1-3/20, operating cash flow increased to €4 million (Q1-3/19: -€17 million) with a margin of 0.3% (Q1-3/19: -1.2%).
Fresenius Vamed confirms its sales outlook for FY/20 and expects an organic sales2 decline of ~10%. Ongoing significant negative Covid-19 effects are expected to weigh on EBIT in Q4/20. While Fresenius Vamed continues to project a positive EBIT3 amount for FY/20, the constant currency decline versus FY/19 is now expected to exceed the former outlook of ~50%. Both sales and EBIT outlook include estimated COVID-19 effects.
Increased number of employees
As of September 30, 2020, the number of employees was 309,114 (December 31, 2019: 294,134).
1 Net income attributable to shareholders of VAMED AG
2 FY/19 base: €2,206 million
3 FY/19 base: €134 million
Conference Call
As part of the publication of the results for Q3/2020, a conference call will be held on October 29, 2020 at 1:30 p.m. CET (8:30 a.m. EDT). You are cordially invited to follow the conference call in a live broadcast over the Internet at www.fresenius.com/media-calendar. Following the call, a replay will be available on our website.
For additional information on the performance indicators used please refer to our website www.fresenius.com/alternative-performance-measures.
This release contains forward-looking statements that are subject to various risks and uncertainties. Future results could differ materially from those described in these forward-looking statements due to certain factors, e.g. changes in business, economic and competitive conditions, regulatory reforms, results of clinical trials, foreign exchange rate fluctuations, uncertainties in litigation or investigative proceedings, and the availability of financing. Fresenius does not undertake any responsibility to update the forward-looking statements in this release.
-

Wolfgang Kirsch, 65, a Member of the Supervisory Board of Fresenius Management SE since the start of this year, is to become the board’s Chairman. -
![]()
Dr. Gerd Krick, 82, to be named Honorary Chairman of Supervisory Board.

- Wolfgang Kirsch nominated to become Chairman of Supervisory Board at close of Annual General Meeting in May 2021
- Dr. Gerd Krick to be named Honorary Chairman of Supervisory Board
- Michael Sen nominated to Supervisory Board, designated to take over from Klaus-Peter Müller as Chairman of Audit Committee
- Contract of CEO Stephan Sturm extended for additional five years
Wolfgang Kirsch, 65, a Member of the Supervisory Board of Fresenius Management SE since the start of this year, is to become the board’s Chairman. This was decided unanimously today by the Supervisory Board of Fresenius Management SE. At the Annual General Meeting in May 2021 he will also stand for election to the Supervisory Board of the publicly listed Fresenius SE & Co. KGaA, with the goal of assuming its chairmanship, as well. In both these posts, Wolfgang Kirsch is to succeed Dr. Gerd Krick, 82, who is not standing for reelection and will leave both Supervisory Boards when the term ends at the close of the Annual General Meeting.
In recognition and deep appreciation of his long decades of accomplishment and invaluable work on behalf of Fresenius, Dr. Krick shall be named Honorary Chairman of both Supervisory Boards.
Also at the Annual General Meeting in 2021, Michael Sen, 51, formerly a member of the Management Board of Siemens AG, will stand for election as a Member of the Supervisory Boards of Fresenius Management SE and Fresenius SE & Co. KGaA with the goal of taking over as Chairman of the Audit Committee. Klaus-Peter Müller, 76, will be stepping down from the Supervisory Boards at the end of his term.
The Supervisory Board of Fresenius Management SE also decided unanimously today to appoint Stephan Sturm, 57, to an additional five years as Chief Executive Officer of Fresenius. Stephan Sturm has been CEO of Fresenius since July 1, 2016, having previously served 11 and a half years as the company’s Chief Financial Officer.
Dr. Krick has held top positions at Fresenius for 45 years, ever since joining the former Dr. E. Fresenius KG as Managing Director for research & development, production and technology in 1975. This was the beginning of a hugely successful period in which Dr. Krick, who holds a doctorate degree in mechanical engineering, played a leading role in developing the company’s first dialyzers and balanced dialysis machines, and helped make dialysis-related activities a core business of Fresenius. These opened the way for the impressive growth achieved by the company, which he steadily drove forward as CEO between 1992 and 2003 and since then as Chairman of the Supervisory Board of Fresenius AG, now Fresenius SE & Co. KGaA.
The founding of both Fresenius Medical Care, the world’s leading provider of products and services for people with chronic kidney failure, and of Fresenius Kabi bear Dr. Krick’s signature. Fresenius’ entry into the hospital business, today under Fresenius Helios, and the acquisition of VAMED AG were further important strategic steps that were undertaken by Dr. Krick. Since May 2010, he has also served as Chairman of the Supervisory Board of Fresenius Management SE, following its establishment as part of the company’s change of legal form.
Dr. Gerd Krick said: “I feel great joy when I see the very impressive development of this unique company, to which I have had the privilege of contributing. I am grateful for the years-long teamwork with countless dedicated and talented people at Fresenius, and what we built together: A healthcare group of global importance. Through my role as Honorary Chairman of the Supervisory Board, I will remain closely connected with Fresenius.”
“Fresenius is very well equipped for the future, and it remains in the best of hands,” Dr. Krick continued. “With Wolfgang Kirsch, with whom I have worked closely and very trustfully since the start of this year, a very experienced expert, particularly in financial matters, will be succeeding me as Chairman of both of our Supervisory Boards. And with Stephan Sturm we have at the head of our Management Board an executive who has been central to designing and executing the strategy that has brought continued growth over many years, and who enjoys the complete confidence of the Supervisory Board. Together with his Management Board colleagues, he will continue to pursue the successful course Fresenius has set. In the name of the Supervisory Board, I want to thank my close associate and companion of many years, Klaus-Peter Müller, for his tireless efforts and his many important contributions to our company’s success.”
Wolfgang Kirsch, the newly designated Chairman of the Supervisory Board, has been a Member of the Supervisory Board of Fresenius Management SE since the start of 2020, and was for many years an advisor to the Else Kröner-Fresenius Foundation. He also holds positions in the Würth Group and on the board of AGCO Corporation, of Atlanta. After joining the Management Board of DZ BANK AG in Frankfurt in 2002, he served as Chief Executive Officer from September 2006 to December 2018. The August 2016 merger of DZ BANK and WGZ BANK, to form the current DZ BANK, was carried out under Wolfgang Kirsch’s leadership. He began his career in 1975 as a trainee at Deutsche Bank before commencing studies in business administration at the University of Cologne. After graduating in 1981, Wolfgang Kirsch continued at Deutsche Bank, where he held a series of management positions through 2002, including in corporate and investment banking.
Klaus-Peter Müller has been a Member of the Supervisory Board of Fresenius SE (today Fresenius SE & Co. KGaA) since 2008 and is Chairman of the Audit Committee. Since 2010, he has also belonged to the Supervisory Board of Fresenius Management SE. A highly regarded financial expert, Klaus-Peter Müller worked at Commerzbank AG from 1966 to 2008 and served from 2001 to 2008 as Chief Executive Officer.
Michael Sen was a member of the Management Board of Siemens AG, where he was responsible for the company’s healthcare and energy businesses, from April 2017 to March 2020. Previously, from 2015 to 2017, he held the position of Chief Financial Officer at E.ON SE. Michael Sen began his career at Siemens in Berlin, where he completed an apprenticeship before studying business administration at the Technical University in Berlin. After completing his studies, starting in 1996 he took on a range of projects and management responsibilities at Siemens, and from 2008 was Chief Financial Officer in the company’s Healthcare division before moving to E.ON.
This release contains forward-looking statements that are subject to various risks and uncertainties. Future results could differ materially from those described in these forward-looking statements due to certain factors, e.g. changes in business, economic and competitive conditions, regulatory reforms, results of clinical trials, foreign exchange rate fluctuations, uncertainties in litigation or investigative proceedings, and the availability of financing. Fresenius does not undertake any responsibility to update the forward-looking statements in this release.
- Wolfgang Kirsch nominated to become Chairman of Supervisory Board at close of Annual General Meeting in May 2021
- Dr. Gerd Krick to be named Honorary Chairman of Supervisory Board
- Michael Sen nominated to Supervisory Board, designated to take over from Klaus-Peter Müller as Chairman of Audit Committee
- Contract of CEO Stephan Sturm extended for additional five years
Wolfgang Kirsch, 65, a Member of the Supervisory Board of Fresenius Management SE since the start of this year, is to become the board’s Chairman. This was decided unanimously today by the Supervisory Board of Fresenius Management SE. At the Annual General Meeting in May 2021 he will also stand for election to the Supervisory Board of the publicly listed Fresenius SE & Co. KGaA, with the goal of assuming its chairmanship, as well. In both these posts, Wolfgang Kirsch is to succeed Dr. Gerd Krick, 82, who is not standing for reelection and will leave both Supervisory Boards when the term ends at the close of the Annual General Meeting.
In recognition and deep appreciation of his long decades of accomplishment and invaluable work on behalf of Fresenius, Dr. Krick shall be named Honorary Chairman of both Supervisory Boards.
Also at the Annual General Meeting in 2021, Michael Sen, 51, formerly a member of the Management Board of Siemens AG, will stand for election as a Member of the Supervisory Boards of Fresenius Management SE and Fresenius SE & Co. KGaA with the goal of taking over as Chairman of the Audit Committee. Klaus-Peter Müller, 76, will be stepping down from the Supervisory Boards at the end of his term.
The Supervisory Board of Fresenius Management SE also decided unanimously today to appoint Stephan Sturm, 57, to an additional five years as Chief Executive Officer of Fresenius. Stephan Sturm has been CEO of Fresenius since July 1, 2016, having previously served 11 and a half years as the company’s Chief Financial Officer.
Dr. Krick has held top positions at Fresenius for 45 years, ever since joining the former Dr. E. Fresenius KG as Managing Director for research & development, production and technology in 1975. This was the beginning of a hugely successful period in which Dr. Krick, who holds a doctorate degree in mechanical engineering, played a leading role in developing the company’s first dialyzers and balanced dialysis machines, and helped make dialysis-related activities a core business of Fresenius. These opened the way for the impressive growth achieved by the company, which he steadily drove forward as CEO between 1992 and 2003 and since then as Chairman of the Supervisory Board of Fresenius AG, now Fresenius SE & Co. KGaA.
The founding of both Fresenius Medical Care, the world’s leading provider of products and services for people with chronic kidney failure, and of Fresenius Kabi bear Dr. Krick’s signature. Fresenius’ entry into the hospital business, today under Fresenius Helios, and the acquisition of VAMED AG were further important strategic steps that were undertaken by Dr. Krick. Since May 2010, he has also served as Chairman of the Supervisory Board of Fresenius Management SE, following its establishment as part of the company’s change of legal form.
Dr. Gerd Krick said: “I feel great joy when I see the very impressive development of this unique company, to which I have had the privilege of contributing. I am grateful for the years-long teamwork with countless dedicated and talented people at Fresenius, and what we built together: A healthcare group of global importance. Through my role as Honorary Chairman of the Supervisory Board, I will remain closely connected with Fresenius.”
“Fresenius is very well equipped for the future, and it remains in the best of hands,” Dr. Krick continued. “With Wolfgang Kirsch, with whom I have worked closely and very trustfully since the start of this year, a very experienced expert, particularly in financial matters, will be succeeding me as Chairman of both of our Supervisory Boards. And with Stephan Sturm we have at the head of our Management Board an executive who has been central to designing and executing the strategy that has brought continued growth over many years, and who enjoys the complete confidence of the Supervisory Board. Together with his Management Board colleagues, he will continue to pursue the successful course Fresenius has set. In the name of the Supervisory Board, I want to thank my close associate and companion of many years, Klaus-Peter Müller, for his tireless efforts and his many important contributions to our company’s success.”
Wolfgang Kirsch, the newly designated Chairman of the Supervisory Board, has been a Member of the Supervisory Board of Fresenius Management SE since the start of 2020, and was for many years an advisor to the Else Kröner-Fresenius Foundation. He also holds positions in the Würth Group and on the board of AGCO Corporation, of Atlanta. After joining the Management Board of DZ BANK AG in Frankfurt in 2002, he served as Chief Executive Officer from September 2006 to December 2018. The August 2016 merger of DZ BANK and WGZ BANK, to form the current DZ BANK, was carried out under Wolfgang Kirsch’s leadership. He began his career in 1975 as a trainee at Deutsche Bank before commencing studies in business administration at the University of Cologne. After graduating in 1981, Wolfgang Kirsch continued at Deutsche Bank, where he held a series of management positions through 2002, including in corporate and investment banking.
Klaus-Peter Müller has been a Member of the Supervisory Board of Fresenius SE (today Fresenius SE & Co. KGaA) since 2008 and is Chairman of the Audit Committee. Since 2010, he has also belonged to the Supervisory Board of Fresenius Management SE. A highly regarded financial expert, Klaus-Peter Müller worked at Commerzbank AG from 1966 to 2008 and served from 2001 to 2008 as Chief Executive Officer.
Michael Sen was a member of the Management Board of Siemens AG, where he was responsible for the company’s healthcare and energy businesses, from April 2017 to March 2020. Previously, from 2015 to 2017, he held the position of Chief Financial Officer at E.ON SE. Michael Sen began his career at Siemens in Berlin, where he completed an apprenticeship before studying business administration at the Technical University in Munich. After completing his studies, starting in 1996 he took on a range of projects and management responsibilities at Siemens, and from 2008 was Chief Financial Officer in the company’s Healthcare division before moving to E.ON.
This release contains forward-looking statements that are subject to various risks and uncertainties. Future results could differ materially from those described in these forward-looking statements due to certain factors, e.g. changes in business, economic and competitive conditions, regulatory reforms, results of clinical trials, foreign exchange rate fluctuations, uncertainties in litigation or investigative proceedings, and the availability of financing. Fresenius does not undertake any responsibility to update the forward-looking statements in this release.
The information and documents contained on the following pages of this website are for information purposes only. These materials do neither constitute an offer nor an invitation to subscribe to or to purchase securities, nor any investment advice or service, and are not meant to serve as a basis for any kind of obligation, contractual or otherwise. Securities may not be offered or sold in the United States of America (“US”) absent registration under the US Securities Act of 1933, as amended, or an exemption from registration. The securities described on the following pages are not offered for sale in the US or to "US persons" (as defined in Regulation S under the US Securities Act of 1933, as amended).
THE FOLLOWING INFORMATION AND DOCUMENTS ARE NOT DIRECTED AT AND ARE NOT INTENDED FOR USE BY (I) PERSONS WHO ARE RESIDENTS OF OR LOCATED IN THE US, CANADA, JAPAN OR AUSTRALIA OR WHO ARE US PERSONS (AS DEFINED IN REGULATION S UNDER THE US SECURITIES ACT OF 1933, AS AMENDED), OR (II) PERSONS IN ANY OTHER JURISDICTION WHERE THE COMMUNICATION OR RECEIPT OF SUCH INFORMATION IS RESTRICTED IN SUCH A WAY THAT PROVIDES THAT SUCH PERSONS SHALL NOT RECEIVE IT. SUCH PERSONS, OR PERSONS ACTING FOR THE BENEFIT OF ANY SUCH PERSONS, ARE NOT PERMITTED TO VISIT THE FOLLOWING PAGES OF THE WEBSITE.
To visit the following parts of this website you must confirm that
(i) you are not a resident of the United States of America, Canada, Japan or Australia or a "US person" (as defined in Regulation S under the US Securities Act of 1933, as amended),
(ii) you are not a person to whom the communication of the information contained on the website is restricted,
(iii) you will not distribute any of the information and documents contained thereon to any such person, and
(iv) you are not acting for the benefit of any such person.
By clicking on the "Accept" button below, you will be deemed to have made this confirmation.
NOT FOR RELEASE, PUBLICATION OR DISTRIBUTION, DIRECTLY OR INDIRECTLY, IN OR INTO THE UNITED STATES OF AMERICA, AUSTRALIA, CANADA OR JAPAN.
Fresenius today successfully placed bonds with an aggregate volume of €1.0 billion:
- €500 million bonds with a maturity in September 2026 and a coupon of 0.375% were issued at a price of 99.333% resulting in a yield of 0.488%,
- €500 million bonds with a maturity in January 2033 and a coupon of 1.125% were issued at a price of 99.738% resulting in a yield of 1.148%.
The proceeds will be used for general corporate purposes, including refinancing of existing financial liabilities.
The bonds were drawn under the Fresenius European Medium Term Note (EMTN) Program and issued by Fresenius SE & Co. KGaA. The company has applied to the Luxembourg Stock Exchange to admit the bonds to trading on its regulated market.
The envisaged settlement date is September 28, 2020.
This announcement does not contain or constitute an offer of, or the solicitation of an offer to buy or subscribe for, securities to any person in Australia, Canada, Japan, or the United States of America (the “United States”) or in any jurisdiction to whom or in which such offer or solicitation is unlawful. The securities referred to herein may not be offered or sold in the United States or to, or for the account or benefit of, U.S. persons, absent registration under the U.S. Securities Act of 1933, as amended (the “Securities Act”) except pursuant to an exemption from, or in a transaction not subject to, the registration requirements of the Securities Act. Subject to certain exceptions, the securities referred to herein may not be offered or sold in Australia, Canada or Japan or to, or for the account or benefit of, any national, resident or citizen of Australia, Canada or Japan. The offer and sale of the securities referred to herein has not been and will not be registered under the Securities Act or under the applicable securities laws of Australia, Canada or Japan. There will be no public offer of the securities in the United States.
This announcement is a general information and not a prospectus. Investors should not purchase or subscribe for any securities referred to in this announcement except on the basis of information in the prospectus to be issued by the company in connection with the offering of such securities. Copies of the prospectus will, following publication, be available free of charge from Fresenius SE & Co. KGaA at Else-Kröner Strasse 1, 61352 Bad Homburg, Germany.
This announcement has been prepared on the basis that any offer of securities in any Member State of the European Economic Area (EEA) will be made pursuant to the prospectus prepared by Fresenius SE & Co. KGaA, Fresenius Finance Ireland Public Limited Company and Fresenius Finance Ireland II Public Limited Company in combination with the relevant final terms relating to such securities or pursuant to an exemption under Regulation (EU) 1129/2017 (the Prospectus Regulation) from the requirement to publish a prospectus for offers of securities. Neither Fresenius SE & Co. KGaA, Fresenius Finance Ireland Public Limited Company nor Fresenius Finance Ireland II Public Limited Company have authorized, nor do they authorize, the making of any offer of securities in circumstances in which an obligation arises for Fresenius SE & Co. KGaA, Fresenius Finance Ireland Public Limited Company and Fresenius Finance Ireland II Public Limited Company or any other person to publish or supplement a prospectus for such offer.
This announcement is directed at and/or for distribution in the United Kingdom only to (i) persons who have professional experience in matters relating to investments falling within article 19(5) of the Financial Services and Markets Act 2000 (Financial Promotion) Order 2005 (the “Order”) or (ii) high net worth entities falling within article 49(2)(a) to (d) of the Order (all such persons are referred to herein as “relevant persons”). This announcement is directed only at relevant persons. Any person who is not a relevant person should not act or rely on this announcement or any of its contents. Any investment or investment activity to which this announcement relates is available only to relevant persons and will be engaged in only with relevant persons.
This announcement contains forward-looking statements that are subject to various risks and uncertainties. Future results could differ materially from those described in these forward-looking statements due to certain factors, e.g. changes in business, economic and competitive conditions, regulatory reforms, results of clinical trials, foreign exchange rate fluctuations, uncertainties in litigation or investigative proceedings, and the availability of financing. Neither Fresenius SE & Co. KGaA, Fresenius Finance Ireland Public Limited Company nor Fresenius Finance Ireland II Public Limited Company undertake any responsibility to update the forward-looking statements in this announcement.