

-
In his speech, Sturm underscored the important role Fresenius is playing in the current situation: "We are needed, and more than ever." Download Image (JPG 15 KB) -
![]()
Despite the strains caused by the pandemic and the additional effort required, Sturm confirmed the company’s medium-term outlook for 2020 to 2023. Download Image (JPG 91 KB) -
![]()
The AGM was held as a virtual meeting on the Internet in order to protect the health of all participants. Download Image (JPG 5.19 MB) -
![]()
Sturm: "We help ensure that healthcare systems around the world can continue to function. Even in a crisis such as this." Download Image (JPG 7.39 MB)
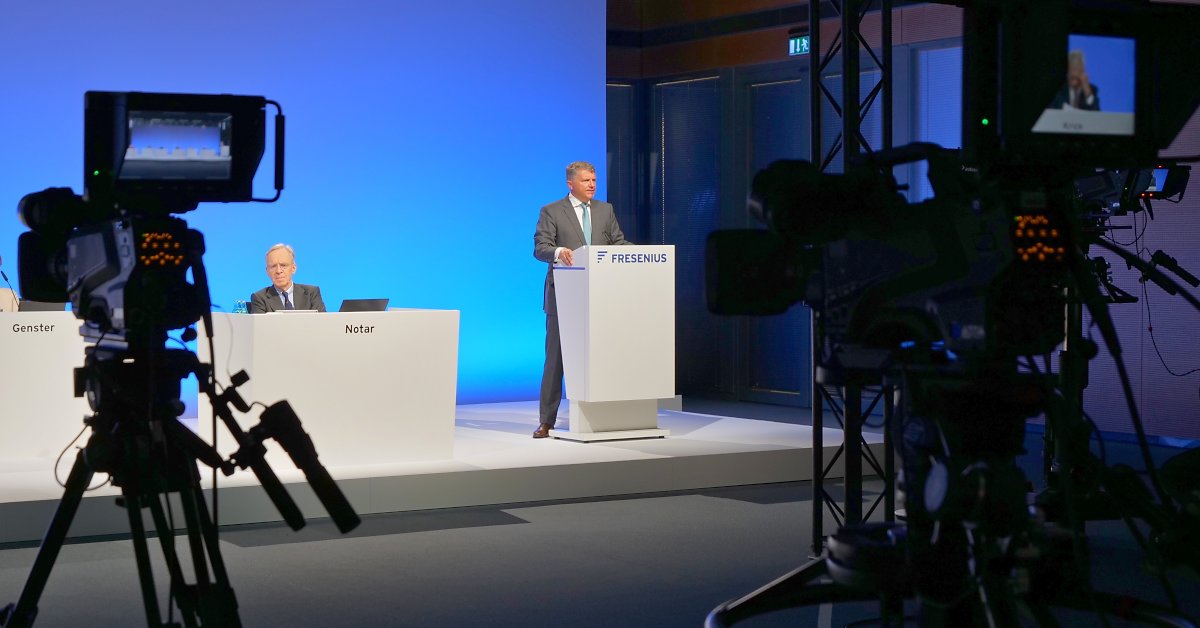


Fresenius remains on course for growth, even in the face of significant challenges presented by the COVID-19 pandemic. This was confirmed by Chief Executive Officer Stephan Sturm at the global healthcare group’s Annual General Meeting today. Originally scheduled for May, the AGM was held as a virtual meeting on the Internet in order to protect the health of all participants.
In his speech to shareholders, Sturm underlined Fresenius’ important role in the current situation: “We are needed – more than ever. We help ensure that healthcare systems around the world can continue to function. Even in a crisis such as this. We are doing everything we can to provide the best possible care for patients. This is our responsibility, and we will fulfill it. I am proud of that.”
Despite the strains caused by the pandemic and the additional effort required, Sturm confirmed the company’s medium-term outlook for 2020 to 2023. Sales growth is expected to increase by an annual average of 4 to 7 percent and net income growth1 by an annual average of 5 to 9 percent over this period. “We will grow somewhat less than planned this year due to the coronavirus,” said Sturm. “This must be compensated for in the coming years. I believe we are on the right path. There is no reason to diverge from this goal. The need for high-quality medicine is increasing worldwide. We offer high-quality medicine. We want to serve this demand, and we can. That is why we will continue to be successful.”
1 Net income attributable to shareholders of Fresenius SE & Co. KGaA
Shareholders approved with a large majority of 99.99 percent the proposal of the General Partner and the Supervisory Board to increase the dividend for the 27th consecutive time. It was raised by 5 percent, to €0.84 per share.
Shareholder majorities of 99.68 percent and 85.14 percent, respectively, approved the actions of the Management and Supervisory Boards in 2019.
At the virtual Annual General Meeting, 73 percent of the subscribed capital was represented.
This release contains forward-looking statements that are subject to various risks and uncertainties. Future results could differ materially from those described in these forward-looking statements due to certain factors, e.g. changes in business, economic and competitive conditions, regulatory reforms, results of clinical trials, foreign exchange rate fluctuations, uncertainties in litigation or investigative proceedings, and the availability of financing. Fresenius does not undertake any responsibility to update the forward-looking statements in this release.
- Fresenius Medical Care with very strong earnings growth and exceptional cash flow development in Q2
- Fresenius Kabi impacted by fewer elective procedures and easing extra demand for COVID 19 related products in Europe and the U.S.; only gradual recovery in China
- Fresenius Helios seeing gradual return of elective procedures; Helios Germany supported by law to ease financial burden on hospitals; COVID-19 related reimbursement at Helios Spain with remaining uncertainties
- Fresenius Vamed heavily impacted by COVID-19 related project delays and lack of post-acute care treatments
If no timeframe is specified, information refers to Q2/2020; 2020 and 2019 according to IFRS 16
1 Before special items
2 Net income attributable to shareholders of Fresenius SE & Co. KGaA
For a detailed overview of special items please see the reconciliation tables on pages 17-19 of the PDF document.
Stephan Sturm, CEO of Fresenius, said: ”Particularly during the COVID-19 pandemic, Fresenius continues to make many important contributions to the provision of high-quality, affordable healthcare. In this way, we are standing with our patients around the world – and fulfilling our social responsibility. Despite the extra effort and restrictions – in particular in our hospital business – we achieved a very solid second quarter. Special credit for this should go to the tremendous dedication of our more than 300,000 employees. Fresenius stands on a broad, strong foundation, whose resilience is being proved more than ever right now. Even with all the current uncertainties, we expect increasingly dynamic earnings development in the coming quarters. I therefore remain confident that 2020 will be another successful year for Fresenius.”
New FY/20 Group guidance incorporating estimated COVID-19 impact
Fresenius’ business model has proven resilient amid the pandemic, although COVID-19 effects have impacted the Company’s operations and will continue to do so in H2/20.
Against this backdrop and based on the Group’s solid underlying business development in H1/20 and the Company’s expectation of improved profitability and hence accelerated earnings growth in H2, Fresenius now expects for FY/20, including estimated COVID-19 effects, constant currency sales growth1 of 3% to 6% and constant currency net income growth2,3 of - 4% to +1%. This replaces the original guidance, excluding COVID-19 effects, projecting constant currency sales growth1 of 4% to 7% and constant currency net income growth of 1% to 5%2,3.
The new guidance assumes only regional or local COVID-19 outbreaks rather than a widespread second COVID-19 wave triggering lock-downs in the Group’s relevant markets.
Fresenius now, including estimated COVID-19 effects, projects net debt/EBITDA to be around the top-end of the self-imposed target corridor of 3.0x to 3.5x by the end of FY/20.
Virtual Annual General Meeting
Fresenius has postponed its Annual General Meeting to August 28, 2020. The Group’s dividend proposal remains unchanged at €0.84 per share.
1 FY/19 base: €35,409 million
2 Net income attributable to shareholders of Fresenius SE & Co. KGaA
3 FY/19 base: €1,879 million; before special items (transaction-related expenses, revaluations of biosimilars contingent purchase price liabilities, gain related to divestitures of Care Coordination activities at FMC, expenses associated with the cost optimization program at FMC); FY/20: before special items
4 At LTM average exchange rates for both net debt and EBITDA; pro forma closed acquisitions/divestitures; excluding further potential acquisitions; before special items
For a detailed overview of special items please see the reconciliation tables on pages 17-19 of the PDF document.
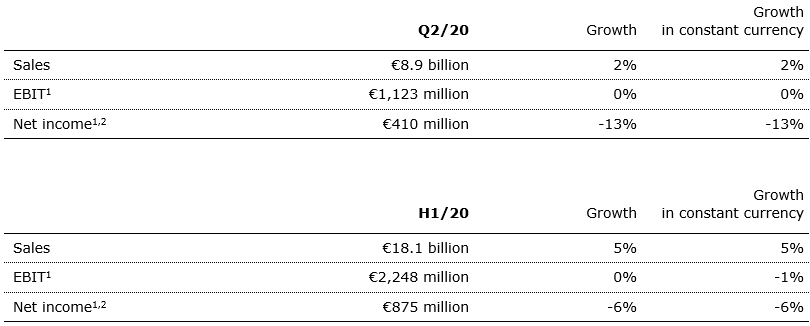
2% sales growth in constant currency
Group sales increased by 2% (2% in constant currency) to €8,920 million in Q2/20 (Q2/19: €8,761 million). Organic sales growth was 2%. Acquisitions/divestitures contributed net 0% to growth. Currency translation had no significant effect. Excluding estimated COVID-19 effects1, Group sales growth would have been 6% to 7%. In H1/20, Group sales increased by 5% (5% in constant currency) to €18,055 million (H1/19: €17,256 million). Organic sales growth was 3%. Acquisitions/divestitures contributed net 2% to growth. Currency translation had no significant effect. Excluding estimated COVID-19 effects1, Group sales growth would have been 7% to 8% in H1/20.
13% net income2,3 decline in constant currency
Group EBITDA increased by 3% (3% in constant currency) to €1,762 million (Q2/192: €1,703 million). In H1/20, Group EBITDA increased by 3% (2% in constant currency) to €3,517 million (H1/192: €3,404 million).
Group EBIT remained on prior year’s level (0% in constant currency) at €1,123 million (Q2/192: €1,118 million). Missing sales, COVID-19 related expenses as well as negative operating leverage in Helios Spain and Fresenius Vamed facilities weighed on EBIT. The anticipated EBIT decreases at Helios Spain and Fresenius Kabi were partially compensated by Fresenius Medical Care’s strong EBIT growth. The EBIT margin was 12.6% (Q2/192: 12.8%).
In H1/20, EBIT remained on prior year’s level (-1% in constant currency) at €2,248 million (H1/192: €2,248 million). The EBIT margin was 12.5% (H1/192: 13.0%). Following higher levels of investments, Fresenius sees higher levels of depreciation and amortization in 2020.
Group net interest before special items improved to -€167 million (Q2/19: - €180 million) mainly due to successful refinancing activities as well as lower interest rates. Reported Group net interest improved to -€167 million (Q2/19: -€179 million). In H1/20, Group net interest before special items improved to -€341 million (H1/19: -€361 million) while reported Group net interest improved to -€349 million (H1/19: -€363 million).
The Group tax rate before special items was 23.5% (Q2/19: 22.8%) while the reported Group tax rate was 23.4% (Q2/19: 22.7%). In H1/20, the Group tax rate before special items was 23.1% (H1/19: 23.1%) while the reported Group tax rate was 23.0% (H1/19: 23.0%).
1 For estimated COVID-19 effects in Q2/20 and H1/20 please see table on page 15.
2 Before special items
3 Net income attributable to shareholders of Fresenius SE & Co. KGaA
For a detailed overview of special items please see the reconciliation tables on pages 17-19 of the PDF document.
Noncontrolling interests before special items were €321 million (Q2/19: €253 million), of which 97% was attributable to the noncontrolling interests in Fresenius Medical Care. Reported Group noncontrolling interests were €321 million (Q2/19: €255 million). In H1/20, noncontrolling interests before special items were €592 million (H1/19: €524 million). Reported Group noncontrolling interests were €592 million (H1/19: €516 million).
Group net income1 before special items decreased by 13% (-13% in constant currency) to €410 million (Q2/19: €471 million). Excluding estimated COVID-19 effects2, net income growth before special items would have been 0% to 4%. Reported Group net income1 was €411 million (Q2/19: €471 million). COVID-19 effects meaningfully increased from Q1 as the entire second quarter was affected in virtually all geographies. In H1/20, Group net income1 before special items decreased by 6% (-6% in constant currency) to €875 million (H1/19: €928 million). Excluding estimated COVID-19 effects2, net income growth before special items would have been 3% to 7%. Reported Group net income1 was €870 million (H1/19: €924 million).
Earnings per share1 before special items decreased by 13% (-14% in constant currency) to €0.74 (Q2/19: €0.85). Reported earnings per share1 were €0.74 (Q2/19: €0.85). In H1/20, earnings per share1 before special items decreased by 6% (-7% in constant currency) to €1.57 (H1/19: €1.67). Reported earnings per share1 were €1.56 (H1/19: €1.66).
Continued investment in growth
Spending on property, plant and equipment was €474 million corresponding to 5% of sales (Q2/19: €565 million; 6% of sales). The investments in Q2/20 served primarily for the modernization and expansion of dialysis clinics, production facilities as well as hospitals, and day clinics. Despite the COVID-19 pandemic, Fresenius has been largely able to continue its investment programs, although there remains some uncertainty on the timing of projects for the remainder of the year. In H1/20, spending on property, plant and equipment was €1,021 million corresponding to 6% of sales (H1/19: €1,006 million; 6% of sales).
Total acquisition spending was €97 million (Q2/19: €234 million). In H1/20, total acquisition spending was €509 million, mainly for the acquisition of two hospitals in Colombia by Fresenius Helios in Q1/20 (H1/19: €2,157 million, mainly for the acquisition of NxStage by Fresenius Medical Care).
1 Net income attributable to shareholders of Fresenius SE & Co. KGaA
2 For estimated COVID-19 effects in Q2/20 and H1/20 please see table on page 15.
For a detailed overview of special items please see the reconciliation tables on pages 17-19 of the PDF document.
Cash flow development
Group operating cash flow increased to an exceptional €3,082 million (Q2/19: €1,205 million) with a margin of 34.6% (Q2/19: 13.8%). The increase was largely driven by Fresenius Medical Care due to U.S. federal government advance payments under the Coronavirus Aid, Relief and Economic Security Act (CARES Act), as well as positive contributions from Fresenius Kabi and Helios Germany. Free cash flow before acquisitions and dividends was €2,606 million (Q2/19: €649 million). Free cash flow after acquisitions and dividends was €2,374 million (Q2/19: -€255 million).
In H1/20, Group operating cash flow increased to €3,960 million (H1/19: €1,494 million) with a margin of 21.9% (H1/19: 8.7%). Free cash flow before acquisitions and dividends was €2,911 million (H1/19: €481 million). Free cash flow after acquisitions and dividends was €2,334 million (H1/19: -€2,366 million, driven by the acquisition of NxStage by Fresenius Medical Care).
Solid balance sheet structure
Group total assets increased by 4% (4% in constant currency) to €69,554 million (Dec. 31, 2019: €67,006 million). Current assets increased by 12% (14% in constant currency) to €17,153 million (Dec. 31, 2019: €15,264 million), mainly driven by the increase of cash and cash equivalents. Non-current assets increased by 1% (2% in constant currency) to €52,401 million (Dec. 31, 2019: €51,742 million).
Total shareholders’ equity increased by 3% (4% in constant currency) to €27,252 million (Dec. 31, 2019: €26,580 million). The equity ratio was 39.2%.
Group debt increased by 1% (1% in constant currency) to €27,487 million (Dec. 31, 2019: € 27,258 million). Group net debt decreased by 5% (-5% in constant currency) to € 24,414 million (Dec. 31, 2019: € 25,604 million), mainly driven by the exceptional cash flow development.
As of June 30, 2020, the net debt/EBITDA ratio decreased to 3.39x1,2 (Dec. 31, 2019: 3.61x1,2) mainly due to the exceptional free cash flow development, despite COVID-19 effects weighing on EBITDA.
Increased number of employees
As of June 30, 2020, the number of employees was 302,846 (Dec. 31, 2019: 294,134).
1 At LTM average exchange rates for both net debt and EBITDA; pro forma closed acquisitions/divestitures
2 Before special items
For a detailed overview of special items please see the reconciliation tables on pages 17-19 of the PDF document.
Business Segments
Fresenius Medical Care (Financial data according to Fresenius Medical Care press release)
Fresenius Medical Care is the world's largest provider of products and services for individuals with renal diseases. As of June 30, 2020, Fresenius Medical Care was treating 347,683 patients in 4,036 dialysis clinics. Along with its core business, the company provides related medical services in the field of Care Coordination.
- Solid sales growth continued and significant net income growth
- Exceptional cash flow development
- Guidance for FY/20 confirmed inclusive of anticipated COVID-19 effects
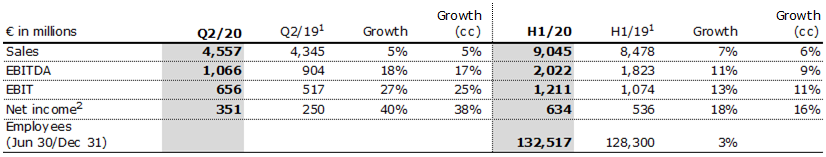
Fresenius Medical Care increased sales by 5% (5% in constant currency) to €4,557 million (Q2/19: €4,345 million). Organic sales growth was 4%. Acquisitions/divestitures contributed 1% in total. In H1/20, Fresenius Medical Care increased sales by 7% (6% in constant currency) to €9,045 million (H1/19: €8,478 million). Organic sales growth was 4%.
Reported EBIT increased by 26% (24% in constant currency) to €656 million (Q2/19: €521 million). The reported EBIT margin was 14.4% (Q2/19: 12.0%). Based on a strong, underlying business performance, the increase in margin was largely due to the recovery of COVID-19 related negative effects experienced in Q1 as well as ongoing cost saving measures. EBIT on an adjusted basis increased by 27% (increased by 25% in constant currency) to €656 million (Q2/19: €517 million). The EBIT margin on an adjusted basis was 14.4% (Q2/19: 11.9%).
1 Before special items
2 Net income attributable to shareholders of Fresenius Medical Care AG & Co. KGaA
For a detailed overview of special items please see the reconciliation tables on pages 17-19 of the PDF document.
In H1/20, Reported EBIT increased by 14% (12% in constant currency) to €1,211 million (H1/19: €1,058 million). The reported EBIT margin was 13.4% (H1/19: 12.5%). EBIT on an adjusted basis increased by 13% (increased by 11% in constant currency) to €1,211 million (H1/19: €1,074 million). The EBIT margin on an adjusted basis was 13.4% (H1/19: 12.7%).
Reported net income1 grew by 38% (36% in constant currency) to €351 million (Q2/19: 254 million) and increased on an adjusted basis by 40% (38% in constant currency) to €351 million (Q2/19: €250 million). In H1/20, reported net income1 grew by 21% (18% in constant currency) to €634 million (H1/19: 525 million) and increased on an adjusted basis by 18% (16% in constant currency) to €634 million (H1/19: €536 million).
Operating cash flow was €2,319 million (Q2/19: €852 million) with a margin of 50.9% (Q2/19: 19.6%). The increase was largely driven by the U.S. federal government advance payments under the Coronavirus Aid, Relief and Economic Security Act (CARES Act). In H1/20, operating cash flow was €2,903 million (H1/19: €928 million) with a margin of 32.1% (H1/19: 10.9%).
On the basis of the neutral net impact of COVID-19 in the first six months, Fresenius Medical Care continues to expect both revenue2 and net income1,3 to grow at a mid to high single digit rate in 2020. These targets are inclusive of anticipated COVID-19 effects, in constant currency, exclude special items4 and are based on the adjusted results 2019 including the effects of the operations of the NxStage acquisition and the IFRS 16 implementation.
For further information, please see Fresenius Medical Care’s press release at www.freseniusmedicalcare.com.
1 Net income attributable to shareholders of Fresenius Medical Care AG & Co. KGaA
2 FY/19 base: €17,477 million
3 FY/19 base: €1,236 million (FY/20: before special items)
4 Special items are effects that are unusual in nature and have not been foreseeable or not foreseeable in size or impact at the time of giving guidance.
For a detailed overview of special items please see the reconciliation tables on pages 17-19 of the PDF document.
Fresenius Kabi
Fresenius Kabi offers intravenously administered generic drugs, clinical nutrition and infusion therapies for seriously and chronically ill patients in the hospital and outpatient environments. The company is also a leading supplier of medical devices and transfusion technology products. In the biosimilars business, Fresenius Kabi develops products with a focus on oncology and autoimmune diseases.
- U.S. and European sales impacted by fewer elective procedures, only partially offset by extra demand for COVID-19 related products in April
- Only gradual recovery of elective procedures in China; solid organic growth in all other Emerging Markets
- EBIT decline despite positive COVID-19 effect given tough 2019 base
- Strong operating cash flow in Q2
- New FY/20 guidance incorporates estimated COVID-19 effects
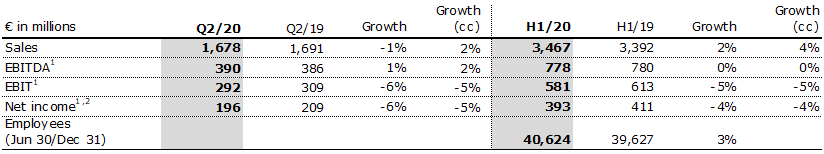
Sales decreased by 1% (increased by 2% in constant currency) to €1,678 million (Q2/19: €1,691 million). Organic sales growth was 2%. Negative currency translation effects of 3% were mainly related to weakness of the Argentinian peso and the Brazilian real. Estimated COVID-19 effects had a moderate negative impact on sales growth. In H1/20, sales increased by 2% (4% in constant currency) to €3,467 million (H1/19: €3,392 million). Organic sales growth was 4%. Negative currency translation effects of 2% were mainly related to weakness of the Argentinian peso and the Brazilian real. Estimated COVID-19 effects had a slight negative impact on sales growth in H1/20.
Sales in North America increased by 5% (organic growth: 3%) to €600 million (Q2/19: €573 million). In H1/20, sales in North America increased by 6% (organic growth: 4%) to €1,269 million (H1/19: €1,196 million). Sales in Europe decreased by 1% (organic growth: 1%) to €566 million (Q2/19: €572 million). In H1/20, sales in Europe increased by 5% (organic growth: 5%) to €1,197 million (H1/19: €1,145 million). In both regions, extra demand for COVID-19 related drugs and devices eased in April already and hence could not fully offset the effect of fewer elective procedures throughout Q2.
Sales in Asia-Pacific decreased by 6% (organic growth: -5%) to €351 million (Q2/19: €374 million). China saw only a slow recovery of elective procedures while other Asian markets showed a stable development. In H1/20, sales in Asia-Pacific decreased by 6% (organic growth: -6%) to €670 million (H1/19: €715 million).
Sales in Latin America/Africa decreased by 6% (organic growth increased by 17%) to €161 million (Q2/19: €172 million). In H1/20, sales in Latin America/Africa decreased by 1% (organic growth: 17%) to €331 million (H1/19: €336 million).
EBIT before special items decreased by 6% (-5% in constant currency) to €292 million (Q2/191: €309 million) with an EBIT margin of 17.4% (Q2/191:18.3%). Given product mix and cost savings, estimated COVID-19 effects had a moderate positive impact on EBIT growth. The decline is driven by a positive one-time effect in Q2/19 as Idacio development expenses had to be revalued when that biosimilar was launched in Europe. In H1/20, EBIT before special items decreased by 5% (-5% in constant currency) to €581 million (H1/191: €613 million) with an EBIT margin of 16.8% (H1/191: 18.1%). Estimated COVID-19 effects had an insignificant impact on EBIT growth in H1/20.
Net income1,2 decreased by 6% (-5% in constant currency) to €196 million (Q2/19: €209 million). In H1/20, net income1,2 decreased by 4% (-4% in constant currency) to €393 million (H1/19: €411 million).
Operating cash flow increased to €437 million (Q2/19: €215 million) with a margin of 26.0% (Q2/19: 12.7%), mainly driven by strong cash inflows and temporarily delayed tax payments. In H1/20, operating cash flow was €611 million (H1/19: €360 million) with a margin of 17.6% (H1/19: 10.6%).
Now including estimated COVID-19 effects, Fresenius Kabi projects for FY/20 organic sales growth of 2% to 5% and an EBIT development of -6% to -3% in constant currency. This replaces the original 2020 outlook, excluding COVID-19 effects, projecting organic sales3 growth of 3% to 6% and an EBIT4 development of -4% to 0% in constant currency.
1 Before special items
2 Net income attributable to shareholders of Fresenius SE & Co. KGaA
3 FY/19 base: €6,919 million
4 FY/19 base: €1,205 million, before special items, FY/20: before special items
For a detailed overview of special items please see the reconciliation tables on pages 17-19 of the PDF document.
Fresenius Helios
Fresenius Helios is Europe's leading private hospital operator. The company comprises Helios Germany and Helios Spain (Quirónsalud). Helios Germany operates 86 hospitals, ~125 outpatient centers and 6 prevention centers. Quirónsalud operates 46 hospitals, 70 outpatient centers and around 300 occupational risk prevention centers. In addition, the company is active in Latin America with 6 hospitals and as a provider of medical diagnostics.
- Law to ease financial burden on hospitals continues to mitigate COVID-19 related sales losses and cost increases in Germany
- COVID-19 impact on Helios Spain significant, but less pronounced than feared; COVID-19 related reimbursement and compensation with remaining uncertainties
- Gradual recovery of elective procedures in Germany and Spain since May
- New FY/20 guidance incorporates COVID-19 effects
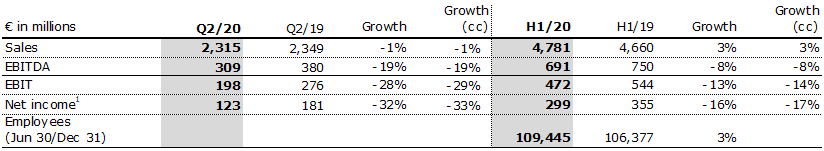
Sales decreased by 1% (-1% in constant currency) to €2,315 million (Q2/19: €2,349 million). Organic growth was -2%. In H1/20, Fresenius Helios increased sales by 3% (3% in constant currency) to €4,781 million (H1/19: €4,660 million). Organic growth was 1%. COVID-19 effects had a significant negative impact on organic sales growth in both, Q2/20 and H1/20. Fresenius sees a gradual recovery of elective procedures in Germany and Spain since May. All Helios hospitals established comprehensive hygiene and distance control concepts.
Sales of Helios Germany increased by 4% (organic growth: 4%) to €1,571 million (Q2/19: €1,506 million). In H1/20, Sales of Helios Germany increased by 6% (organic growth: 6%) to €3,174 million (H1/19: €2,991 million). Due to the law to ease the financial burden on hospitals, COVID-19 effects had a slight negative impact on organic sales growth in both, Q2/20 and H1/20.
Sales of Helios Spain decreased by 12% (-11% in constant currency) to €743 million (Q2/19: €842 million). Organic growth was -14%. In H1/20, sales of Helios Spain decreased by 4% (-3% in constant currency) to €1,606 million (H1/19: €1,668 million). Organic growth was -7%. COVID-19 effects had a significant negative impact on organic sales growth in both, Q2/20 and H1/20.
EBIT of Fresenius Helios decreased by 28% (-29% in constant currency) to €198 million (Q2/19: €276 million) with an EBIT margin of 8.6% (Q2/19: 11.7%). In H1/20, EBIT of Fresenius Helios decreased by 13% (-14% in constant currency) to €472 million (H1/19: €544 million) with an EBIT margin of 9.9% (H1/19: 11.7%). COVID-19 effects had a significant negative impact on EBIT growth in both, Q2/20 and H1/20.
EBIT of Helios Germany decreased by 5% to €147 million (Q2/19: €154 million) with an EBIT margin of 9.4% (Q2/19: 10.2%). The decline was mainly caused by higher costs to protect our patients and employees as well as missing sales not fully compensated under the law to ease the financial burden on hospitals. COVID-19 effects had a moderate negative impact on EBIT growth in Q2/20. In H1/20, EBIT of Helios Germany increased by 3% to €312 million (H1/19: €303 million) with an EBIT margin of 9.8% (H1/19: 10.1%). COVID-19 effects had a slight negative impact on EBIT growth in H1/20.
EBIT of Helios Spain decreased by 57% (-58% in constant currency) to €54 million (Q2/19: €127 million) with an EBIT margin of 7.3% (Q2/19: 15.1%). In H1/20, EBIT of Helios Spain decreased by 33% (-34% in constant currency) to €166 million (H1/19: €248 million) with an EBIT margin of 10.3% (H1/19: 14.9%). COVID-19 effects had a very significant negative impact on EBIT growth in both Q2/20 and H1/20 with uncompensated foregone elective procedures so far, and higher expenses amidst the comprehensive efforts to combat the pandemic. Despite remaining uncertainties with regard to COVID-19 related reimbursement and compensation, Q2/20 is likely to have marked the EBIT trough.
Net income1 decreased by 32% to €123 million (Q2/19: €181 million). In H1/20, net income decreased by 16% to €299 million (H1/19: €355 million).
Operating cash flow increased to €295 million (Q2/19: €208 million) with a margin of 12.7% (Q2/19: 8.9%), driven by phasing of payments under the German law to ease the financial burden on hospitals. In H1/20, operating cash flow increased to €440 million (H1/19: €311 million) with a margin of 9.2% (H1/19: 6.7%). Now including COVID-19 effects, Fresenius Helios expects for FY/20 organic sales growth of 1% to 4% and EBIT broadly stable over FY/19 in constant currency. This replaces the original 2020 outlook, excluding COVID-19 effects, projecting organic sales2 growth of 3% to 6% and EBIT3 growth of 3% to 7% in constant currency.
1 Net income attributable to shareholders of Fresenius SE & Co. KGaA
2 FY/19 base: €9,234 million
3 FY/19 base: €1,025 million
Fresenius Vamed
Fresenius Vamed manages projects and provides services for hospitals and other health care facilities worldwide and is a leading post-acute care provider in Central Europe. The portfolio ranges along the entire value chain: from project development, planning, and turnkey construction, via maintenance and technical management to total operational management.
- Very significant negative COVID-19 impact in line with expectations
- COVID-19 related delays and cancellations of project orders and execution
- Lack of post-acute care patients given COVID-19 related postponements of elective procedures and health authority issued closures of rehabilitation clinics
- New FY/20 guidance incorporates estimated COVID-19 effects
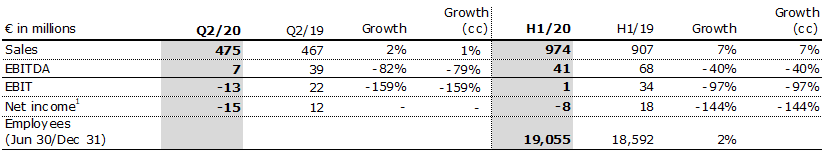
Fresenius Vamed increased sales by 2% (1% in constant currency) to €475 million (Q2/19: €467 million). Organic sales growth was -1%. Acquisitions contributed 2% to growth. Estimated COVID-19 effects had a significant negative impact on organic growth in Q2/20. In H1/20, Fresenius Vamed increased sales by 7% (7% in constant currency) to €974 million (H1/19: €907 million). Organic sales growth was 5%. Acquisitions contributed 2% to growth. Estimated COVID-19 effects had a moderate negative impact on organic sales growth in H1/20.
Sales in the service business decreased by 4% to €329 million (Q2/19: €344 million). Sales in the project business increased by 19% to €146 million (Q2/19: €123 million), mainly driven by revenue recognition from existing projects, primarily in Germany and Austria, and intercompany projects with Fresenius Helios. In H1/20, sales in the service business grew by 1% to €686 million (H1/19: €676 million). Sales in the project business increased by 25% to €288 million (H1/19: €231 million).
EBIT decreased to -€13 million (Q2/19: €22 million) with an EBIT margin of -2.7% (Q2/19: 4.7%). Estimated COVID-19 effects had a very significant negative impact on EBIT. Capacities in the post-acute care clinics were left empty given a generally lower intake of elective surgery patients from acute-care hospitals as well as authority-instigated restrictions or even closures of individual facilities. In H1/20, EBIT decreased by 97% (-97% in constant currency) to €1 million (H1/19: €34 million) with an EBIT margin of 0.1% (H1/19: 3.7%). Estimated COVID-19 effects had a very significant negative impact on EBIT in H1/20.
Net income1 decreased to -€15 million (Q2/19: €12 million). In H1/20, net income1 decreased to -€8 million (H1/19: €18 million).
Order intake was €50 million in Q2/20 (Q2/19: €115 million) and €174 million in H1/20 (H1/19: €498 million). As of June 30, 2020, order backlog was at €2,745 million (December 31, 2019: €2,865 million). Order intake and order backlog were marked by COVID-19 related cancellations and project delays.
Operating cash flow increased to €28 million (Q2/19: -€35 million) with a margin of 5.9% (Q2/19: -7.5%), driven by timing of payments in the project business as well as some compensations payments from governmental authorities in the post-acute care business. In H1/20, operating cash flow increased to €8 million (H1/19: -€50 million) with a margin of 0.8% (H1/19: -5.5%).
Now including estimated COVID-19 effects, Fresenius Vamed expects for FY/20 an organic sales2 decline of ~10% and an EBIT3 decline of ~50% in constant currency. This replaces the original 2020 outlook, excluding COVID-19 effects, projecting organic sales2 growth of 4% to 7% and EBIT3 growth of 5% to 9% in constant currency.
1 Net income attributable to shareholders of VAMED AG
2 FY/19 base: €2,206 million
3 FY/19 base: €134 million
Conference Call
As part of the publication of the results for Q2/2020, a conference call will be held on July 30, 2020 at 1:30 p.m. CEDT (7:30 a.m. EDT). All investors are cordially invited to follow the conference call in a live broadcast over the Internet at www.fresenius.com/media-calendar. Following the call, a replay will be available on our website.
For additional information on the performance indicators used please refer to our website www.fresenius.com/alternative-performance-measures.
This release contains forward-looking statements that are subject to various risks and uncertainties. Future results could differ materially from those described in these forward-looking statements due to certain factors, e.g. changes in business, economic and competitive conditions, regulatory reforms, results of clinical trials, foreign exchange rate fluctuations, uncertainties in litigation or investigative proceedings, and the availability of financing. Fresenius does not undertake any responsibility to update the forward-looking statements in this release.
- Fresenius Medical Care with very strong earnings growth and exceptional cash flow development in Q2
- Fresenius Kabi impacted by fewer elective procedures and easing extra demand for COVID 19 related products in Europe and the U.S.; only gradual recovery in China
- Fresenius Helios seeing gradual return of elective procedures; Helios Germany supported by law to ease financial burden on hospitals; COVID-19 related reimbursement at Helios Spain with remaining uncertainties
- Fresenius Vamed heavily impacted by COVID-19 related project delays and lack of post-acute care treatments
If no timeframe is specified, information refers to Q2/2020; 2020 and 2019 according to IFRS 16

1 Before special items
2 Net income attributable to shareholders of Fresenius SE & Co. KGaA
For a detailed overview of special items please see the reconciliation tables on pages 17-19 of the PDF document.
Stephan Sturm, CEO of Fresenius, said:”Particularly during the COVID-19 pandemic, Fresenius continues to make many important contributions to the provision of high-quality, affordable healthcare. In this way, we are standing with our patients around the world – and fulfilling our social responsibility. Despite the extra effort and restrictions – in particular in our hospital business – we achieved a very solid second quarter. Special credit for this should go to the tremendous dedication of our more than 300,000 employees. Fresenius stands on a broad, strong foundation, whose resilience is being proved more than ever right now. Even with all the current uncertainties, we expect increasingly dynamic earnings development in the coming quarters. I therefore remain confident that 2020 will be another successful year for Fresenius.”
New FY/20 Group guidance incorporating estimated COVID-19 impact
Fresenius’ business model has proven resilient amid the pandemic, although COVID-19 effects have impacted the Company’s operations and will continue to do so in H2/20.
Against this backdrop and based on the Group’s solid underlying business development in H1/20 and the Company’s expectation of improved profitability and hence accelerated earnings growth in H2, Fresenius now expects for FY/20, including estimated COVID-19 effects, constant currency sales growth1 of 3% to 6% and constant currency net income growth2,3 of - 4% to +1%. This replaces the original guidance, excluding COVID-19 effects, projecting constant currency sales growth1 of 4% to 7% and constant currency net income growth of 1% to 5%2,3.
The new guidance assumes only regional or local COVID-19 outbreaks rather than a widespread second COVID-19 wave triggering lock-downs in the Group’s relevant markets.
Fresenius now, including estimated COVID-19 effects, projects net debt/EBITDA4 to be around the top-end of the self-imposed target corridor of 3.0x to 3.5x by the end of FY/20.
Virtual Annual General Meeting
Fresenius has postponed its Annual General Meeting to August 28, 2020. The Group’s dividend proposal remains unchanged at €0.84 per share.
1 FY/19 base: €35,409 million
2 Net income attributable to shareholders of Fresenius SE & Co. KGaA
3 FY/19 base: €1,879 million; before special items (transaction-related expenses, revaluations of biosimilars contingent purchase price liabilities, gain related to divestitures of Care Coordination activities at FMC, expenses associated with the cost optimization program at FMC); FY/20: before special items
4 At LTM average exchange rates for both net debt and EBITDA; pro forma closed acquisitions/divestitures; excluding further potential acquisitions; before special items
For a detailed overview of special items please see the reconciliation tables on pages 17-19 of the PDF document.
2% sales growth in constant currency
Group sales increased by 2% (2% in constant currency) to €8,920 million in Q2/20 (Q2/19: €8,761 million). Organic sales growth was 2%. Acquisitions/divestitures contributed net 0% to growth. Currency translation had no significant effect. Excluding estimated COVID-19 effects1, Group sales growth would have been 6% to 7%. In H1/20, Group sales increased by 5% (5% in constant currency) to €18,055 million (H1/19: €17,256 million). Organic sales growth was 3%. Acquisitions/divestitures contributed net 2% to growth. Currency translation had no significant effect. Excluding estimated COVID-19 effects1, Group sales growth would have been 7% to 8% in H1/20.
13% net income2,3 decline in constant currency
Group EBITDA increased by 3% (3% in constant currency) to €1,762 million (Q2/192: €1,703 million). In H1/20, Group EBITDA increased by 3% (2% in constant currency) to €3,517 million (H1/192: €3,404 million).
Group EBIT remained on prior year’s level (0% in constant currency) at €1,123 million (Q2/192: €1,118 million). Missing sales, COVID-19 related expenses as well as negative operating leverage in Helios Spain and Fresenius Vamed facilities weighed on EBIT. The anticipated EBIT decreases at Helios Spain and Fresenius Kabi were partially compensated by Fresenius Medical Care’s strong EBIT growth. The EBIT margin was 12.6% (Q2/192: 12.8%).
In H1/20, EBIT remained on prior year’s level (-1% in constant currency) at €2,248 million (H1/192: €2,248 million). The EBIT margin was 12.5% (H1/192: 13.0%). Following higher levels of investments, Fresenius sees higher levels of depreciation and amortization in 2020.
Group net interest before special items improved to -€167 million (Q2/19: - €180 million) mainly due to successful refinancing activities as well as lower interest rates. Reported Group net interest improved to -€167 million (Q2/19: -€179 million). In H1/20, Group net interest before special items improved to -€341 million (H1/19: -€361 million) while reported Group net interest improved to -€349 million (H1/19: -€363 million).
The Group tax rate before special items was 23.5% (Q2/19: 22.8%) while the reported Group tax rate was 23.4% (Q2/19: 22.7%). In H1/20, the Group tax rate before special items was 23.1% (H1/19: 23.1%) while the reported Group tax rate was 23.0% (H1/19: 23.0%).
1 For estimated COVID-19 effects in Q2/20 and H1/20 please see table on page 15.
2 Before special items
3 Net income attributable to shareholders of Fresenius SE & Co. KGaA
For a detailed overview of special items please see the reconciliation tables on pages 17-19 of the PDF document.
Noncontrolling interests before special items were €321 million (Q2/19: €253 million), of which 97% was attributable to the noncontrolling interests in Fresenius Medical Care. Reported Group noncontrolling interests were €321 million (Q2/19: €255 million). In H1/20, noncontrolling interests before special items were €592 million (H1/19: €524 million). Reported Group noncontrolling interests were €592 million (H1/19: €516 million).
Group net income1 before special items decreased by 13% (-13% in constant currency) to €410 million (Q2/19: €471 million). Excluding estimated COVID-19 effects2, net income growth before special items would have been 0% to 4%. Reported Group net income1 was €411 million (Q2/19: €471 million). COVID-19 effects meaningfully increased from Q1 as the entire second quarter was affected in virtually all geographies. In H1/20, Group net income1 before special items decreased by 6% (-6% in constant currency) to €875 million (H1/19: €928 million). Excluding estimated COVID-19 effects2, net income growth before special items would have been 3% to 7%. Reported Group net income1 was €870 million (H1/19: €924 million).
Earnings per share1 before special items decreased by 13% (-14% in constant currency) to €0.74 (Q2/19: €0.85). Reported earnings per share1 were €0.74 (Q2/19: €0.85). In H1/20, earnings per share1 before special items decreased by 6% (-7% in constant currency) to €1.57 (H1/19: €1.67). Reported earnings per share1 were €1.56 (H1/19: €1.66).
Continued investment in growth
Spending on property, plant and equipment was €474 million corresponding to 5% of sales (Q2/19: €565 million; 6% of sales). The investments in Q2/20 served primarily for the modernization and expansion of dialysis clinics, production facilities as well as hospitals, and day clinics. Despite the COVID-19 pandemic, Fresenius has been largely able to continue its investment programs, although there remains some uncertainty on the timing of projects for the remainder of the year. In H1/20, spending on property, plant and equipment was €1,021 million corresponding to 6% of sales (H1/19: €1,006 million; 6% of sales).
Total acquisition spending was €97 million (Q2/19: €234 million). In H1/20, total acquisition spending was €509 million, mainly for the acquisition of two hospitals in Colombia by Fresenius Helios in Q1/20 (H1/19: €2,157 million, mainly for the acquisition of NxStage by Fresenius Medical Care).
1 Net income attributable to shareholders of Fresenius SE & Co. KGaA
2 For estimated COVID-19 effects in Q2/20 and H1/20 please see table on page 15.
For a detailed overview of special items please see the reconciliation tables on pages 17-19 of the PDF document.
Cash flow development
Group operating cash flow increased to an exceptional €3,082 million (Q2/19: €1,205 million) with a margin of 34.6% (Q2/19: 13.8%). The increase was largely driven by Fresenius Medical Care due to U.S. federal government advance payments under the Coronavirus Aid, Relief and Economic Security Act (CARES Act), as well as positive contributions from Fresenius Kabi and Helios Germany. Free cash flow before acquisitions and dividends was €2,606 million (Q2/19: €649 million). Free cash flow after acquisitions and dividends was €2,374 million (Q2/19: -€255 million).
In H1/20, Group operating cash flow increased to €3,960 million (H1/19: €1,494 million) with a margin of 21.9% (H1/19: 8.7%). Free cash flow before acquisitions and dividends was €2,911 million (H1/19: €481 million). Free cash flow after acquisitions and dividends was €2,334 million (H1/19: -€2,366 million, driven by the acquisition of NxStage by Fresenius Medical Care).
Solid balance sheet structure
Group total assets increased by 4% (4% in constant currency) to €69,554 million (Dec. 31, 2019: €67,006 million). Current assets increased by 12% (14% in constant currency) to €17,153 million (Dec. 31, 2019: €15,264 million), mainly driven by the increase of cash and cash equivalents. Non-current assets increased by 1% (2% in constant currency) to €52,401 million (Dec. 31, 2019: €51,742 million).
Total shareholders’ equity increased by 3% (4% in constant currency) to €27,252 million (Dec. 31, 2019: €26,580 million). The equity ratio was 39.2%.
Group debt increased by 1% (1% in constant currency) to €27,487 million (Dec. 31, 2019: € 27,258 million). Group net debt decreased by 5% (-5% in constant currency) to € 24,414 million (Dec. 31, 2019: € 25,604 million), mainly driven by the exceptional cash flow development.
As of June 30, 2020, the net debt/EBITDA ratio decreased to 3.39x1,2 (Dec. 31, 2019: 3.61x1,2) mainly due to the exceptional free cash flow development, despite COVID-19 effects weighing on EBITDA.
1 At LTM average exchange rates for both net debt and EBITDA; pro forma closed acquisitions/divestitures
2 Before special items
For a detailed overview of special items please see the reconciliation tables on pages 17-19 of the PDF document.
Business Segments
Fresenius Medical Care (Financial data according to Fresenius Medical Care press release)
Fresenius Medical Care is the world's largest provider of products and services for individuals with renal diseases. As of June 30, 2020, Fresenius Medical Care was treating 347,683 patients in 4,036 dialysis clinics. Along with its core business, the company provides related medical services in the field of Care Coordination.

- Solid sales growth continued and significant net income growth
- Exceptional cash flow development
- Guidance for FY/20 confirmed inclusive of anticipated COVID-19 effects
Fresenius Medical Care increased sales by 5% (5% in constant currency) to €4,557 million (Q2/19: €4,345 million). Organic sales growth was 4%. Acquisitions/divestitures contributed 1% in total. In H1/20, Fresenius Medical Care increased sales by 7% (6% in constant currency) to €9,045 million (H1/19: €8,478 million). Organic sales growth was 4%.
Reported EBIT increased by 26% (24% in constant currency) to €656 million (Q2/19: €521 million). The reported EBIT margin was 14.4% (Q2/19: 12.0%). Based on a strong, underlying business performance, the increase in margin was largely due to the recovery of COVID-19 related negative effects experienced in Q1 as well as ongoing cost saving measures. EBIT on an adjusted basis increased by 27% (increased by 25% in constant currency) to €656 million (Q2/19: €517 million). The EBIT margin on an adjusted basis was 14.4% (Q2/19: 11.9%).
1 Before special items
2 Net income attributable to shareholders of Fresenius Medical Care AG & Co. KGaA
For a detailed overview of special items please see the reconciliation tables on pages 17-19 of the PDF document.
In H1/20, Reported EBIT increased by 14% (12% in constant currency) to €1,211 million (H1/19: €1,058 million). The reported EBIT margin was 13.4% (H1/19: 12.5%). EBIT on an adjusted basis increased by 13% (increased by 11% in constant currency) to €1,211 million (H1/19: €1,074 million). The EBIT margin on an adjusted basis was 13.4% (H1/19: 12.7%).
Reported net income1 grew by 38% (36% in constant currency) to €351 million (Q2/19: 254 million) and increased on an adjusted basis by 40% (38% in constant currency) to €351 million (Q2/19: €250 million). In H1/20, reported net income1 grew by 21% (18% in constant currency) to €634 million (H1/19: 525 million) and increased on an adjusted basis by 18% (16% in constant currency) to €634 million (H1/19: €536 million).
Operating cash flow was €2,319 million (Q2/19: €852 million) with a margin of 50.9% (Q2/19: 19.6%). The increase was largely driven by the U.S. federal government advance payments under the Coronavirus Aid, Relief and Economic Security Act (CARES Act). In H1/20, operating cash flow was €2,903 million (H1/19: €928 million) with a margin of 32.1% (H1/19: 10.9%).
On the basis of the neutral net impact of COVID-19 in the first six months, Fresenius Medical Care continues to expect both revenue2 and net income1,3 to grow at a mid to high single digit rate in 2020. These targets are inclusive of anticipated COVID-19 effects, in constant currency, exclude special items4 and are based on the adjusted results 2019 including the effects of the operations of the NxStage acquisition and the IFRS 16 implementation.
For further information, please see Fresenius Medical Care’s press release at www.freseniusmedicalcare.com.
1 Net income attributable to shareholders of Fresenius Medical Care AG & Co. KGaA
2 FY/19 base: €17,477 million
3 FY/19 base: €1,236 million (FY/20: before special items)
4 Special items are effects that are unusual in nature and have not been foreseeable or not foreseeable in size or impact at the time of giving guidance.
For a detailed overview of special items please see the reconciliation tables on pages 17-19 of the PDF document.
Fresenius Kabi
Fresenius Kabi offers intravenously administered generic drugs, clinical nutrition and infusion therapies for seriously and chronically ill patients in the hospital and outpatient environments. The company is also a leading supplier of medical devices and transfusion technology products. In the biosimilars business, Fresenius Kabi develops products with a focus on oncology and autoimmune diseases.

- U.S. and European sales impacted by fewer elective procedures, only partially offset by extra demand for COVID-19 related products in April
- Only gradual recovery of elective procedures in China; solid organic growth in all other Emerging Markets
- EBIT decline despite positive COVID-19 effect given tough 2019 base
- Strong operating cash flow in Q2
- New FY/20 guidance incorporates estimated COVID-19 effects
Sales decreased by 1% (increased by 2% in constant currency) to €1,678 million (Q2/19: €1,691 million). Organic sales growth was 2%. Negative currency translation effects of 3% were mainly related to weakness of the Argentinian peso and the Brazilian real. Estimated COVID-19 effects had a moderate negative impact on sales growth. In H1/20, sales increased by 2% (4% in constant currency) to €3,467 million (H1/19: €3,392 million). Organic sales growth was 4%. Negative currency translation effects of 2% were mainly related to weakness of the Argentinian peso and the Brazilian real. Estimated COVID-19 effects had a slight negative impact on sales growth in H1/20.
Sales in North America increased by 5% (organic growth: 3%) to €600 million (Q2/19: €573 million). In H1/20, sales in North America increased by 6% (organic growth: 4%) to €1,269 million (H1/19: €1,196 million). Sales in Europe decreased by 1% (organic growth: 1%) to €566 million (Q2/19: €572 million). In H1/20, sales in Europe increased by 5% (organic growth: 5%) to €1,197 million (H1/19: €1,145 million). In both regions, extra demand for COVID-19 related drugs and devices eased in April already and hence could not fully offset the effect of fewer elective procedures throughout Q2.
Sales in Asia-Pacific decreased by 6% (organic growth: -5%) to €351 million (Q2/19: €374 million). China saw only a slow recovery of elective procedures while other Asian markets showed a stable development. In H1/20, sales in Asia-Pacific decreased by 6% (organic growth: -6%) to €670 million (H1/19: €715 million).
Sales in Latin America/Africa decreased by 6% (organic growth increased by 17%) to €161 million (Q2/19: €172 million). In H1/20, sales in Latin America/Africa decreased by 1% (organic growth: 17%) to €331 million (H1/19: €336 million).
EBIT before special items decreased by 6% (-5% in constant currency) to €292 million (Q2/191: €309 million) with an EBIT margin of 17.4% (Q2/191:18.3%). Given product mix and cost savings, estimated COVID-19 effects had a moderate positive impact on EBIT growth. The decline is driven by a positive one-time effect in Q2/19 as Idacio development expenses had to be revalued when that biosimilar was launched in Europe. In H1/20, EBIT before special items decreased by 5% (-5% in constant currency) to €581 million (H1/191: €613 million) with an EBIT margin of 16.8% (H1/191: 18.1%). Estimated COVID-19 effects had an insignificant impact on EBIT growth in H1/20.
Net income1,2 decreased by 6% (-5% in constant currency) to €196 million (Q2/19: €209 million). In H1/20, net income1,2 decreased by 4% (-4% in constant currency) to €393 million (H1/19: €411 million).
Operating cash flow increased to €437 million (Q2/19: €215 million) with a margin of 26.0% (Q2/19: 12.7%), mainly driven by strong cash inflows and temporarily delayed tax payments. In H1/20, operating cash flow was €611 million (H1/19: €360 million) with a margin of 17.6% (H1/19: 10.6%).
Now including estimated COVID-19 effects, Fresenius Kabi projects for FY/20 organic sales3 growth of 2% to 5% and an EBIT4 development of -6% to -3% in constant currency. This replaces the original 2020 outlook, excluding COVID-19 effects, projecting organic sales3 growth of 3% to 6% and an EBIT4 development of -4% to 0% in constant currency.
1 Before special items
2 Net income attributable to shareholders of Fresenius SE & Co. KGaA
3 FY/19 base: €6,919 million
4 FY/19 base: €1,205 million, before special items, FY/20: before special items
For a detailed overview of special items please see the reconciliation tables on pages 17-19 of the PDF document.
Fresenius Helios
Fresenius Helios is Europe's leading private hospital operator. The company comprises Helios Germany and Helios Spain (Quirónsalud). Helios Germany operates 86 hospitals, ~125 outpatient centers and 6 prevention centers. Quirónsalud operates 46 hospitals, 70 outpatient centers and around 300 occupational risk prevention centers. In addition, the company is active in Latin America with 6 hospitals and as a provider of medical diagnostics.

- Law to ease financial burden on hospitals continues to mitigate COVID-19 related sales losses and cost increases in Germany
- COVID-19 impact on Helios Spain significant, but less pronounced than feared; COVID-19 related reimbursement and compensation with remaining uncertainties
- Gradual recovery of elective procedures in Germany and Spain since May
- New FY/20 guidance incorporates COVID-19 effects
Sales decreased by 1% (-1% in constant currency) to €2,315 million (Q2/19: €2,349 million). Organic growth was -2%. In H1/20, Fresenius Helios increased sales by 3% (3% in constant currency) to €4,781 million (H1/19: €4,660 million). Organic growth was 1%. COVID-19 effects had a significant negative impact on organic sales growth in both, Q2/20 and H1/20. Fresenius sees a gradual recovery of elective procedures in Germany and Spain since May. All Helios hospitals established comprehensive hygiene and distance control concepts.
Sales of Helios Germany increased by 4% (organic growth: 4%) to €1,571 million (Q2/19: €1,506 million). In H1/20, Sales of Helios Germany increased by 6% (organic growth: 6%) to €3,174 million (H1/19: €2,991 million). Due to the law to ease the financial burden on hospitals, COVID-19 effects had a slight negative impact on organic sales growth in both, Q2/20 and H1/20.
Sales of Helios Spain decreased by 12% (-11% in constant currency) to €743 million (Q2/19: €842 million). Organic growth was -14%. In H1/20, sales of Helios Spain decreased by 4% (-3% in constant currency) to €1,606 million (H1/19: €1,668 million). Organic growth was -7%. COVID-19 effects had a significant negative impact on organic sales growth in both, Q2/20 and H1/20.
EBIT of Fresenius Helios decreased by 28% (-29% in constant currency) to €198 million (Q2/19: €276 million) with an EBIT margin of 8.6% (Q2/19: 11.7%). In H1/20, EBIT of Fresenius Helios decreased by 13% (-14% in constant currency) to €472 million (H1/19: €544 million) with an EBIT margin of 9.9% (H1/19: 11.7%). COVID-19 effects had a significant negative impact on EBIT growth in both, Q2/20 and H1/20.
EBIT of Helios Germany decreased by 5% to €147 million (Q2/19: €154 million) with an EBIT margin of 9.4% (Q2/19: 10.2%). The decline was mainly caused by higher costs to protect our patients and employees as well as missing sales not fully compensated under the law to ease the financial burden on hospitals. COVID-19 effects had a moderate negative impact on EBIT growth in Q2/20. In H1/20, EBIT of Helios Germany increased by 3% to €312 million (H1/19: €303 million) with an EBIT margin of 9.8% (H1/19: 10.1%). COVID-19 effects had a slight negative impact on EBIT growth in H1/20.
EBIT of Helios Spain decreased by 57% (-58% in constant currency) to €54 million (Q2/19: €127 million) with an EBIT margin of 7.3% (Q2/19: 15.1%). In H1/20, EBIT of Helios Spain decreased by 33% (-34% in constant currency) to €166 million (H1/19: €248 million) with an EBIT margin of 10.3% (H1/19: 14.9%). COVID-19 effects had a very significant negative impact on EBIT growth in both Q2/20 and H1/20 with uncompensated foregone elective procedures so far, and higher expenses amidst the comprehensive efforts to combat the pandemic. Despite remaining uncertainties with regard to COVID-19 related reimbursement and compensation, Q2/20 is likely to have marked the EBIT trough.
Net income1 decreased by 32% to €123 million (Q2/19: €181 million). In H1/20, net income decreased by 16% to €299 million (H1/19: €355 million).
Operating cash flow increased to €295 million (Q2/19: €208 million) with a margin of 12.7% (Q2/19: 8.9%), driven by phasing of payments under the German law to ease the financial burden on hospitals. In H1/20, operating cash flow increased to €440 million (H1/19: €311 million) with a margin of 9.2% (H1/19: 6.7%).
Now including COVID-19 effects, Fresenius Helios expects for FY/20 organic sales2 growth of 1% to 4% and EBIT3 broadly stable over FY/19 in constant currency. This replaces the original 2020 outlook, excluding COVID-19 effects, projecting organic sales2 growth of 3% to 6% and EBIT3 growth of 3% to 7% in constant currency.
1 Net income attributable to shareholders of Fresenius SE & Co. KGaA
2 FY/19 base: €9,234 million
3 FY/19 base: €1,025 million
Fresenius Vamed
Fresenius Vamed manages projects and provides services for hospitals and other health care facilities worldwide and is a leading post-acute care provider in Central Europe. The portfolio ranges along the entire value chain: from project development, planning, and turnkey construction, via maintenance and technical management to total operational management.

- Very significant negative COVID-19 impact in line with expectations
- COVID-19 related delays and cancellations of project orders and execution
- Lack of post-acute care patients given COVID-19 related postponements of elective procedures and health authority issued closures of rehabilitation clinics
- New FY/20 guidance incorporates estimated COVID-19 effects
Fresenius Vamed increased sales by 2% (1% in constant currency) to €475 million (Q2/19: €467 million). Organic sales growth was -1%. Acquisitions contributed 2% to growth. Estimated COVID-19 effects had a significant negative impact on organic growth in Q2/20. In H1/20, Fresenius Vamed increased sales by 7% (7% in constant currency) to €974 million (H1/19: €907 million). Organic sales growth was 5%. Acquisitions contributed 2% to growth. Estimated COVID-19 effects had a moderate negative impact on organic sales growth in H1/20.
Sales in the service business decreased by 4% to €329 million (Q2/19: €344 million).
Sales in the project business increased by 19% to €146 million (Q2/19: €123 million), mainly driven by revenue recognition from existing projects, primarily in Germany and Austria, and intercompany projects with Fresenius Helios. In H1/20, sales in the service business grew by 1% to €686 million (H1/19: €676 million). Sales in the project business increased by 25% to €288 million (H1/19: €231 million).
EBIT decreased to -€13 million (Q2/19: €22 million) with an EBIT margin of -2.7% (Q2/19: 4.7%). Estimated COVID-19 effects had a very significant negative impact on EBIT. Capacities in the post-acute care clinics were left empty given a generally lower intake of elective surgery patients from acute-care hospitals as well as authority-instigated restrictions or even closures of individual facilities. In H1/20, EBIT decreased by 97% (-97% in constant currency) to €1 million (H1/19: €34 million) with an EBIT margin of 0.1% (H1/19: 3.7%). Estimated COVID-19 effects had a very significant negative impact on EBIT in H1/20.
Net income1 decreased to -€15 million (Q2/19: €12 million). In H1/20, net income1 decreased to -€8 million (H1/19: €18 million).
Order intake was €50 million in Q2/20 (Q2/19: €115 million) and €174 million in H1/20 (H1/19: €498 million). As of June 30, 2020, order backlog was at €2,745 million (December 31, 2019: €2,865 million). Order intake and order backlog were marked by COVID-19 related cancellations and project delays.
Operating cash flow increased to €28 million (Q2/19: -€35 million) with a margin of 5.9% (Q2/19: -7.5%), driven by timing of payments in the project business as well as some compensations payments from governmental authorities in the post-acute care business. In H1/20, operating cash flow increased to €8 million (H1/19: -€50 million) with a margin of 0.8% (H1/19: -5.5%).
Now including estimated COVID-19 effects, Fresenius Vamed expects for FY/20 an organic sales2 decline of ~10% and an EBIT3 decline of ~50% in constant currency. This replaces the original 2020 outlook, excluding COVID-19 effects, projecting organic sales2 growth of 4% to 7% and EBIT3 growth of 5% to 9% in constant currency.
1 Net income attributable to shareholders of VAMED AG
2 FY/19 base: €2,206 million
3 FY/19 base: €134 million
Conference Call
As part of the publication of the results for Q2/2020, a conference call will be held on July 30, 2020 at 1:30 p.m. CEDT (7:30 a.m. EDT). All investors are cordially invited to follow the conference call in a live broadcast over the Internet at www.fresenius.com/investors. Following the call, a replay will be available on our website.
For additional information on the performance indicators used please refer to our website www.fresenius.com/alternative-performance-measures.
This release contains forward-looking statements that are subject to various risks and uncertainties. Future results could differ materially from those described in these forward-looking statements due to certain factors, e.g. changes in business, economic and competitive conditions, regulatory reforms, results of clinical trials, foreign exchange rate fluctuations, uncertainties in litigation or investigative proceedings, and the availability of financing. Fresenius does not undertake any responsibility to update the forward-looking statements in this release.
The Berlin-based digital health company Curalie, a subsidiary of the Fresenius healthcare group, has entered a cooperation agreement with the “Wir für Gesundheit” quality medical care network and the health insurer Debeka. In the first step, a prevention app through which regular medical check-ups can be carried out, along with other functions, will be added to PlusCard. A supplementary company health insurance that companies can offer to their employees, PlusCard was jointly developed by “Wir für Gesundheit” and Debeka and has been offered since 2014. Additional digital components are planned for the prevention app, including a telemedicine function for the care of chronically ill patients.
The Berlin-based digital health company Curalie, a subsidiary of the Fresenius healthcare group, has entered a cooperation agreement with the “Wir für Gesundheit” quality medical care network and the health insurer Debeka. In the first step, a prevention app through which regular medical check-ups can be carried out, along with other functions, will be added to PlusCard. A supplementary company health insurance that companies can offer to their employees, PlusCard was jointly developed by “Wir für Gesundheit” and Debeka and has been offered since 2014. Additional digital components are planned for the prevention app, including a telemedicine function for the care of chronically ill patients.
Fresenius will hold its Annual General Meeting (AGM) on August 28, 2020 as a virtual event. Originally, the AGM was scheduled for May 20, 2020. It had to be postponed due to the coronavirus pandemic. As it is currently impossible to predict for how long the restrictions for large public events will be in effect, Fresenius will use the option provided by the German legislator to hold a virtual event to safeguard the health of shareholders, employees and service providers.
The proposed dividend by the General Partner and the Supervisory Board remains unchanged at €0.84 per share entitled to a dividend.
Shareholders will be provided the possibility to follow the entire AGM on the internet. Fresenius will include further details in the AGM invitation that is to be published in the Federal Gazette (Bundesanzeiger) and on the corporate website in July.
This release contains forward-looking statements that are subject to various risks and uncertainties. Future results could differ materially from those described in these forward-looking statements due to certain factors, e.g. changes in business, economic and competitive conditions, regulatory reforms, results of clinical trials, foreign exchange rate fluctuations, uncertainties in litigation or investigative proceedings, and the availability of financing. Fresenius does not undertake any responsibility to update the forward-looking statements in this release.
-

Dr. Sebastian Biedenkopf, currently General Counsel of Robert Bosch GmbH, will join the Management Board of Fresenius as Chief Legal and Compliance Officer, and Labor Relations Director, no later than January 1, 2021 Download Image (JPG 10.71 MB) -
![]()
Dr. Jürgen Götz is leaving the company at his own request at the end of June, after more than 15 years with Fresenius. Download Image (JPG 2.87 MB)

Dr. Sebastian Biedenkopf, currently General Counsel of Robert Bosch GmbH, will join the Management Board of Fresenius as Chief Legal and Compliance Officer, and Labor Relations Director, no later than January 1, 2021. He will succeed Dr. Jürgen Götz, who is leaving the company at his own request at the end of June.
Dr. Biedenkopf, 56, has headed the international legal department of the Bosch Group since September 2013. From 2008 until 2012 he held various positions at Conergy AG in Hamburg, lastly as Chief Financial Officer and interim Chief Executive Officer. He holds a doctorate in law and previously served as General Counsel and Chief Compliance Officer at Maxingvest AG (formerly Tchibo Holding AG) in Hamburg, and in various positions at the Bertelsmann Group.
The Chairman of the Supervisory Board of Fresenius, Dr. Gerd Krick, said: “In Dr. Sebastian Biedenkopf we have won a highly experienced, versatile legal expert with profound knowledge in various areas. With his very strongly developed business skills and international outlook, he will make an outstanding fit for Fresenius, and perfectly complement our proven management team. Great thanks go to Dr. Jürgen Götz for the trustful collaboration over many years and his tireless work. Drawing on deep legal expertise, he made important contributions to our successful growth. I respect his wish to pursue other challenges outside of our company after more than 15 years with Fresenius, and in the name of the Supervisory Board I wish him all the best.”
Stephan Sturm, CEO of Fresenius, said: “Dr. Sebastian Biedenkopf has, in various capacities, helped shape strategies, and will bring many new ideas and perspectives to Fresenius. I am very pleased that I will be working with him, and I am convinced that with his know-how in the Legal and Human Resources areas, as well as company management, he will make an ideal addition to our Management Board. In his new role he will be able to build on what his successor accomplished over the years: I want to thank Jürgen Götz for the always trustful and very collegial collaboration. On behalf of the Management Board and all the employees, I wish him all the best.”
Dr. Sebastian Biedenkopf said: “During the discussions in recent weeks, I have gotten to know Fresenius as a superbly positioned company with an impressive culture. I am very much looking forward to putting my experience and knowledge to work here, and having this opportunity to contribute to the continued successful development of Fresenius.”
- Fresenius Medical Care with strong sales growth in Q1
- Fresenius Kabi with expected dip in China partially offset by spike in demand for drugs and devices for COVID-19 patients in Europe and the US
- Helios Germany supported by law to ease financial burden on hospitals
- Helios Spain’s significant contribution to combat COVID-19 faces reimbursement uncertainties
- Fresenius Vamed with solid Q1, however already marked by COVID-19 related post-acute patient losses and project delays
- Original guidance for 2020 excluding any effects of the COVID-19 pandemic maintained; Guidance update to include COVID-19 effects expected with Q2/20 financial results
- Group financial position remains strong
If no timeframe is specified, information refers to Q1/2020
2020 and 2019 according to IFRS 16
1 Not comparable to FY/20 guidance as inclusive of COVID-19 effects
2 Before special items
3 Net income attributable to shareholders of Fresenius SE & Co. KGaA
For a detailed overview of special items please see the reconciliation tables on pages 17-18 of the PDF document.
Stephan Sturm, CEO of Fresenius, said: “The COVID-19 pandemic has created unprecedented challenges for Fresenius. We are doing everything we can to continue providing the best possible care for our patients around the world. The last few weeks have shown that we have a crucial role to play in the health care systems around the world, and never more so than at a time of crisis. Our success to date is due, above all, to the tremendous dedication and commitment of our employees. Our solid first-quarter business results demonstrate the resilience of our operations and business models. It is, however, too early to say with any certainty what impact COVID-19 will have on the company’s full business year. What can be said with certainty is that we will keep working hard for our patients, and will continue to make an important contribution to overcoming this pandemic.”
Group guidance for FY/20 – Impact of COVID-19 on outlook cannot be reliably assessed at this time
Fresenius’ FY guidance published on February 20, 2020 did not take into account effects of the COVID-19 pandemic. It projected sales growth1 of 4% to 7% in constant currency and net income growth2,3 of 1% to 5% in constant currency. Fresenius anticipates that, following the solid start to the year, COVID-19 will continue to impact its business; at this time, however, a reliable assessment and quantification of the positive and negative effects is not possible. The Group hence maintains its original guidance, excluding any COVID-19 effects. Fresenius will revisit this guidance when communicating its Q2/20 results with the aim to incorporate a reliable assessment of COVID-19 effects.
This approach also applies for the Group’s net debt/EBITDA target. The original guidance, excluding effects of the COVID-19 pandemic, projects net debt/EBITDA4 to be towards the top-end of the self-imposed target corridor of 3.0x to 3.5x at the end of 2020.
Fresenius expects to see a more pronounced negative COVID-19 effect on its financial results in the second quarter than in the first quarter of 2020.
7% sales growth in constant currency
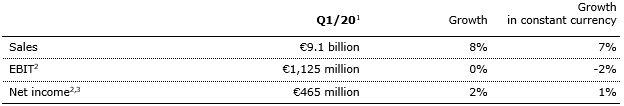
Group sales increased by 8% (7% in constant currency) to €9,135 million in Q1/20 (Q1/19: €8,495 million) driven by all business segments. COVID-19 had only a slight negative effect on sales growth. Organic sales growth was 5%. Acquisitions/divestitures contributed net 2% to growth. Positive currency translation effects of 1% were mainly driven by the U.S. dollar strengthening against the euro.
1 FY/19 base: €35,409 million
2 Net income attributable to shareholders of Fresenius SE & Co. KGaA
3 FY/19 base: €1,879 million; before special items (transaction-related expenses, revaluations of biosimilars contingent purchase price liabilities, gain related to divestitures of Care Coordination activities at FMC, expenses associated with the cost optimization program at FMC); FY/20: before special items
4 Both net debt and EBITDA calculated at expected annual average exchange rates; excluding further potential acquisitions
For a detailed overview of special items please see the reconciliation tables on pages 17-18 of the PDF document.
1% net income1,2 growth in constant currency
Group EBITDA increased by 3% (2% in constant currency) to €1,755 million (Q1/191: €1,701 million).
Group EBIT remained on prior year’s level (-2% in constant currency) at €1,125 million (Q1/191: €1,130 million), impacted by negative COVID-19 effects. At Fresenius Kabi additional demand for drugs and devices to treat COVID-19 patients late in the quarter only partially offset the anticipated headwinds in China during most of the quarter. Helios Spain also faced very significant negative COVID-19 effects in March, mainly at its private hospital and ORP businesses. The EBIT margin was 12.3% (Q1/191: 13.3%).
Group net interest before special items improved to -€174 million in Q1/20 (Q1/19: -€181 million) mainly due to successful refinancing activities. Reported Group net interest improved to -€182 million (Q1/19: -€184 million).
The Group tax rate before special items was 22.6% (Q1/19: 23.3%). The reported Group tax rate was 22.6% (Q1/19: 23.3%).
Noncontrolling interest before special items was -€271 million (Q1/19: -€271 million), of which 96% was attributable to the noncontrolling interest in Fresenius Medical Care. Reported Group noncontrolling interest was -€271 million (Q1/19: -€261 million).
1 Before special items
2 Net income attributable to shareholders of Fresenius SE & Co. KGaA
For a detailed overview of special items please see the reconciliation tables on pages 17-18 of the PDF document.
Group net income1 before special items increased by 2% (1% in constant currency) to €465 million (Q1/19: €457 million). Reported Group net income1 was €459 million (Q1/19: €453 million). COVID-19 had a significant negative effect on net income growth.
Earnings per share1 before special items increased by 1% (1% in constant currency) to €0.83 (Q1/19: €0.82). Reported earnings per share1 were €0.82 (Q1/19: €0.81).
Continued investment in growth
Spending on property, plant and equipment was €547 million corresponding to 6% of sales (Q1/19: €441 million; 5% of sales). The investments in Q1/20 served primarily for the modernization and expansion of dialysis clinics, production facilities as well as hospitals, and day clinics. Subject to duration and magnitude of the COVID-19 pandemic, Fresenius may face delays of investment projects planned for 2020.
Total acquisition spending was €412 million (Q1/19: €1,923 million), mainly for the acquisition of two hospitals in Colombia by Fresenius Helios.
Cash flow development
Group operating cash flow increased to €878 million (Q1/19: €289 million) with a margin of 9.6% (Q1/19: 3.4%). Growth was driven by a favorable working capital development at both Fresenius Medical Care and Fresenius Kabi. Free cash flow before acquisitions and dividends was €305 million (Q1/19: -€168 million). Free cash flow after acquisitions and dividends was -€40 million (Q1/19: -€2,111 million, driven by the acquisition of NxStage by Fresenius Medical Care).
1 Net income attributable to shareholders of Fresenius SE & Co. KGaA
For a detailed overview of special items please see the reconciliation tables on pages 17-18 of the PDF document.
Solid balance sheet structure
Group total assets increased by 3% (3% in constant currency) to €68,972 million (Dec. 31, 2019: €67,006 million). Current assets increased by 7% (8% in constant currency) to €16,341 million (Dec. 31, 2019: €15,264 million). Non-current assets increased by 2% (1% in constant currency) to €52,631 million (Dec. 31, 2019: €51,742 million).
Total shareholders’ equity increased by 1% (1% in constant currency) to €26,956 million (Dec. 31, 2019: €26,580 million). The equity ratio was 39.1%.
Group debt increased by 5% (4% in constant currency) to €28,557 million (Dec. 31, 2019: € 27,258 million). Group net debt increased by 4% (3% in constant currency) to € 26,529 million (Dec. 31, 2019: € 25,604 million) driven by the closing of two hospital acquisitions in Colombia by Fresenius Helios and execution of the share buy-back program at Fresenius Medical Care as well as currency translation effects.
As of March 31, 2020, the net debt/EBITDA ratio increased to 3.68x1,2 (Dec. 31, 2019: 3.61x1,2) mainly due to the acquisitions made by Fresenius Helios, the share-buy back program at Fresenius Medical Care and negative COVID-19 effects on EBITDA.
1 At LTM average exchange rates for both net debt and EBITDA; pro forma closed acquisitions/divestitures
2 Before special items
For a detailed overview of special items please see the reconciliation tables on pages 17-18 of the PDF document.
Business Segments
Fresenius Medical Care (Financial data according to Fresenius Medical Care press release)
Fresenius Medical Care is the world's largest provider of products and services for individuals with renal diseases. As of March 31, 2020, Fresenius Medical Care was treating 348,703 patients in 4,002 dialysis clinics. Along with its core business, the company provides related medical services in the field of Care Coordination.

- 9% revenue increase supported by growth in all regions
- Solid cash-flow development
- Financial targets confirmed
Fresenius Medical Care increased sales by 9% (7% in constant currency) to €4,488 million (Q1/19: €4,133 million). Organic sales growth was 4%. Positive currency translation effects of 2% were mainly related to the U.S. dollar strengthening against the euro.
Reported EBIT increased by 3% (1% in constant currency) to €555 million (Q1/19: €537 million) mainly driven by a favorable impact from higher treatment volume and lower costs for pharmaceuticals. The reported EBIT margin was 12.4% (Q1/19: 13.0%). The decrease in margin was largely due to the unfavorable COVID-19 pandemic effect and the prior year reduction of a contingent consideration liability related to Xenios. EBIT on an adjusted basis was flat (decreased by 3% in constant currency) at €555 million (Q1/19: €557 million). The EBIT margin on an adjusted basis was 12.4% (Q1/19: 13.5%).
Reported net income2 grew by 4% (2% in constant currency) to €283 million (Q1/19: 271 million) and decreased on an adjusted basis by 1% (-3% in constant currency) to €283 million (Q1/19: €286 million).
Operating cash flow was €584 million (Q1/19: €76 million) with a margin of 13.0% (Q1/19: 1.8%). The increase was largely driven by working capital improvement, including a positive effect from cash collections, timing of payments and change in year over year inventory levels.
Fresenius Medical Care’s FY guidance published on February 20, 2020 did not take into account COVID-19 effects. Since it is too early to reliably assess and quantify the positive and negative effects of the COVID-19 pandemic, the Company confirms its 2020 outlook of expected sales3 and net income2,4 growth both within a mid to high single digit percentage range in constant currency. These targets are based on the adjusted results 2019 including the effects of the operations of the NxStage acquisition and the IFRS 16 implementation.
For further information, please see Fresenius Medical Care’s press release at www.freseniusmedicalcare.com.
1 Q1/19 before special
2 Net income attributable to shareholders of Fresenius Medical Care AG & Co. KGaA
3 FY/19 base: €17,477 million
4 FY/19 base: €1,236 million (FY/20: before special items)
For a detailed overview of special items please see the reconciliation tables on pages 17-18 of the PDF document.
Fresenius Kabi
Fresenius Kabi offers intravenously administered generic drugs, clinical nutrition and infusion therapies for seriously and chronically ill patients in the hospital and outpatient environments. The company is also a leading supplier of medical devices and transfusion technology products. In the biosimilars business, Fresenius Kabi develops products with a focus on oncology and autoimmune diseases.
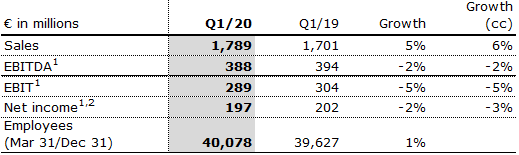
- Insignificant COVID-19 effect on sales growth, moderate negative effect on EBIT growth
- Anticipated softer demand in China during most of Q1/20 due to fewer elective surgeries followed by gradual resumption towards normal operations late in the quarter
- Increased demand for essential drugs and devices for the treatment of COVID-19 patients in North America and Europe late in Q1/20
- No major interruption at any production site
Fresenius Kabi increased sales by 5% (6% in constant currency) to €1,789 million (Q1/19: €1,701 million). Organic sales growth was 6%. Negative currency translation effects of 1% were mainly related to weakness of the Argentinian peso and the Brazilian real.
Sales in North America increased by 7% (organic growth: 5%) to €669 million (Q1/19: €623 million). Sales in Europe grew by 10% (organic growth: 10%) to €631 million (Q1/19: €573 million). In both regions, sales were driven by a spike of demand for sedation drugs, pain killers and infusion pumps starting late in Q1/20.
Sales in Asia-Pacific decreased by 6% (organic growth: -6%) to €319 million (Q1/19: €341 million). As anticipated, softer demand for clinical nutrition products and IV drugs in China was driven by the COVID-19 related postponement of elective treatments.
Sales in Latin America/Africa increased by 4% (organic growth: 16%) to €170 million (Q1/19: €164 million).
EBIT before special items decreased by 5% (-5% in constant currency) to €289 million (Q1/191: €304 million) with an EBIT margin of 16.2% (Q1/191: 17.9%). The COVID-19 pandemic had a moderate net negative effect on EBIT.
Net income1,2 decreased by 2% (-3% in constant currency) to €197 million (Q1/19: €202 million).
Operating cash flow was €174 million (Q1/19: €145 million) with a margin of 9.7% (Q1/19: 8.5%), driven by an improved working capital position.
Since it is too early to reliably assess and quantify the positive and negative effects of the COVID-19 pandemic, Fresenius Kabi maintains its 2020 outlook of expected organic sales3 growth of 3% to 6% and an EBIT4 development of -4% to 0% in constant currency, excluding any effects from COVID-19.
1 Before special items
2 Net income attributable to shareholders of Fresenius SE & Co. KGaA
3 FY/19 base: €6,919 million
4 FY/19 base: €1,205 million, before special items, FY/20: before special items
For a detailed overview of special items please see the reconciliation tables on pages 17-18 of the PDF document.
Fresenius Helios
Fresenius Helios is Europe's leading private hospital operator. The company comprises Helios Germany and Helios Spain (Quirónsalud). Helios Germany operates 86 hospitals, ~125 outpatient centers and 7 prevention centers. Quirónsalud operates 46 hospitals, 72 outpatient centers and around 300 occupational risk prevention centers. In addition, the company is active in Latin America with 6 hospitals and as a provider of medical diagnostics.
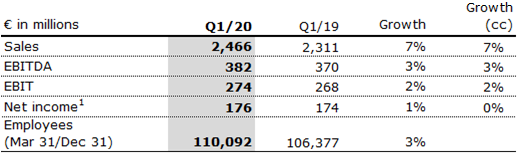
- Strong business development in January and February; from March, postponement and cancellation of elective treatments
- Excluding slight negative COVID-19 effect, Q1/20 sales growth moderately above outlook range; significant negative COVID-19 effect on EBIT
- Law to ease financial burden on hospitals to offset large part of COVID-19 related sales losses and cost increases in Germany
- Some remaining uncertainties regarding the compensation of Spanish hospitals for their efforts to combat the COVID-19 pandemic
Fresenius Helios increased sales by 7% (organic growth: 5%) to €2,466 million (Q1/19: €2,311 million).
Sales of Helios Germany increased by 8% (organic growth: 8%) to €1,603 million (Q1/19: €1,485 million). Organic sales growth was positively influenced by pricing effects and admissions growth in January and February. From March, COVID-19 had an insignificant net effect as foregone sales from elective admissions were largely offset by the law to ease the financial burden on hospitals.
Sales of Helios Spain increased by 4% (organic growth: 1%) to €863 million (Q1/19: €826 million) driven by the recent hospital acquisitions in Colombia. COVID-19 related foregone elective surgeries significantly weighed on organic sales growth from March.
EBIT of Fresenius Helios increased by 2% to €274 million (Q1/19: €268 million) with an EBIT margin of 11.1% (Q1/19: 11.6%).
EBIT of Helios Germany increased by 11% to €165 million (Q1/19: €149 million) with an EBIT margin of 10.3% (Q1/19: 10.0%). EBIT was positively influenced by pricing effects and admissions growth in January and February. From March, COVID-19 had an insignificant net effect as foregone EBIT from elective admissions was largely offset by the law to ease the financial burden on hospitals.
EBIT of Helios Spain decreased by 7% to €112 million (Q1/19: €121 million) with an EBIT margin of 13.0% (Q1/19: 14.6%). January and February showed positive admission growth. From March, COVID-19 had a very significant negative effect on EBIT as foregone elective treatments met higher costs amidst the comprehensive efforts to combat the pandemic.
Net income1 increased by 1% to €176 million (Q1/19: €174 million).
Operating cash flow increased to €145 million (Q1/19: €103 million) with a margin of 5.9% (Q1/19: 4.5%), driven by a good operating performance in both regions.
Since it is too early to reliably assess and quantify the positive and negative effects of the COVID-19 pandemic, Fresenius Helios maintains its 2020 outlook of expected organic sales2 growth of 3% to 6% and EBIT3 growth of 3% to 7% in constant currency, excluding any effects from COVID-19.
1 Net income attributable to shareholders of Fresenius SE & Co. KGaA
2 FY/19 base: €9,234 million
3 FY/19 base: €1,025 million
Fresenius Vamed
Fresenius Vamed manages projects and provides services for hospitals and other health care facilities worldwide and is a leading post-acute care provider in Central Europe. The portfolio ranges along the entire value chain: from project development, planning, and turnkey construction, via maintenance and technical management to total operational management.
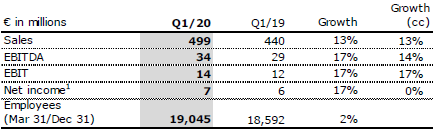
- Both project and service business contributing to organic sales growth of 10%
- Slight negative COVID-19 effect on sales, very significant negative effect on EBIT growth
- Post-acute care services impacted by COVID-19 related postponements of elective surgeries and health authority enforced closures of rehabilitation clinics; technical services insignificantly impacted by COVID-19
- Further COVID-19 related delays of project business orders and execution expected throughout 2020
Fresenius Vamed increased sales by 13% to €499 million (Q1/19: €440 million). Organic sales growth was 10%. Acquisitions contributed 3% to growth. Both service and project business showed strong growth momentum. COVID-19 had only a slight negative effect on sales.
Sales in the service business grew by 8% to €357 million (Q1/19: €332 million). Sales of the project business increased by 31% to €142 million (Q1/19: €108 million).
EBIT increased by 17% to €14 million (Q1/19: €12 million) with an EBIT margin of 2.8% (Q1/19: 2.7%). COVID-19 had a very significant negative effect on EBIT growth. Capacities in the post-acute care clinics were left idle given a generally lower intake of elective surgery patients from acute-care hospitals as well as authority-instigated restrictions or even closures of individual facilities.
Net income1 increased by 17% to €7 million (Q1/19: €6 million).
Order intake was €124 million (Q1/19: €383 million). Order intake in the prior year was exceptionally strong. As of March 31, 2020, order backlog was at €2,846 million (December 31, 2019: €2,865 million) and already marked by COVID-19 related project delays.
Operating cash flow decreased to -€20 million (Q1/19: -€15 million) with a margin of
-4.0% (Q1/19: -3.4%), given continuing phasing effects, some delays in the international project business as well as working capital build-ups.
Since it is too early to reliably assess and quantify the positive and negative effects of the COVID-19 pandemic, Fresenius Vamed maintains its 2020 outlook of expected organic sales2 growth of 4% to 7% and EBIT3 growth of 5% to 9% in constant currency, excluding any effects from COVID-19.
1 Net income attributable to shareholders of VAMED AG
2 FY/19 base: €2,206 million
3 FY/19 base: €134 million
Conference Call
As part of the publication of the results for Q1 2020, a conference call will be held on May 6, 2020 at 1:30 p.m. CEDT (7:30 a.m. EDT). All investors are cordially invited to follow the conference call in a live broadcast over the Internet at www.fresenius.com/investors. Following the call, a replay will be available on our website.
For additional information on the performance indicators used please refer to our website https://www.fresenius.com/alternative-performance-measures.
This release contains forward-looking statements that are subject to various risks and uncertainties. Future results could differ materially from those described in these forward-looking statements due to certain factors, e.g. changes in business, economic and competitive conditions, regulatory reforms, results of clinical trials, foreign exchange rate fluctuations, uncertainties in litigation or investigative proceedings, and the availability of financing. Fresenius does not undertake any responsibility to update the forward-looking statements in this release.
- Fresenius Medical Care with strong sales growth in Q1
- Fresenius Kabi with expected dip in China partially offset by spike in demand for drugs and devices for COVID-19 patients in Europe and the US
- Helios Germany supported by law to ease financial burden on hospitals
- Helios Spain’s significant contribution to combat COVID-19 faces reimbursement uncertainties
- Fresenius Vamed with solid Q1, however already marked by COVID-19 related post-acute patient losses and project delays
- Original guidance for 2020 excluding any effects of the COVID-19 pandemic maintained; Guidance update to include COVID-19 effects expected with Q2/20 financial results
- Group financial position remains strong
If no timeframe is specified, information refers to Q1/2020
2020 and 2019 according to IFRS 16

1 Not comparable to FY/20 guidance as inclusive of COVID-19 effects
2 Before special items
3 Net income attributable to shareholders of Fresenius SE & Co. KGaA
For a detailed overview of special items please see the reconciliation tables on pages 17-18 of the PDF document.
Stephan Sturm, CEO of Fresenius, said: “The COVID-19 pandemic has created unprecedented challenges for Fresenius. We are doing everything we can to continue providing the best possible care for our patients around the world. The last few weeks have shown that we have a crucial role to play in the health care systems around the world, and never more so than at a time of crisis. Our success to date is due, above all, to the tremendous dedication and commitment of our employees. Our solid first-quarter business results demonstrate the resilience of our operations and business models. It is, however, too early to say with any certainty what impact COVID-19 will have on the company’s full business year. What can be said with certainty is that we will keep working hard for our patients, and will continue to make an important contribution to overcoming this pandemic.”
Group guidance for FY/20 – Impact of COVID-19 on outlook cannot be reliably assessed at this time
Fresenius’ FY guidance published on February 20, 2020 did not take into account effects of the COVID-19 pandemic. It projected sales growth1 of 4% to 7% in constant currency and net income growth2,3 of 1% to 5% in constant currency. Fresenius anticipates that, following the solid start to the year, COVID-19 will continue to impact its business; at this time, however, a reliable assessment and quantification of the positive and negative effects is not possible. The Group hence maintains its original guidance, excluding any COVID-19 effects. Fresenius will revisit this guidance when communicating its Q2/20 results with the aim to incorporate a reliable assessment of COVID-19 effects.
This approach also applies for the Group’s net debt/EBITDA target. The original guidance, excluding effects of the COVID-19 pandemic, projects net debt/EBITDA4 to be towards the top-end of the self-imposed target corridor of 3.0x to 3.5x at the end of 2020.
Fresenius expects to see a more pronounced negative COVID-19 effect on its financial results in the second quarter than in the first quarter of 2020.
1 FY/19 base: €35,409 million
2 Net income attributable to shareholders of Fresenius SE & Co. KGaA
3 FY/19 base: €1,879 million; before special items (transaction-related expenses, revaluations of biosimilars contingent purchase price liabilities, gain related to divestitures of Care Coordination activities at FMC, expenses associated with the cost optimization program at FMC); FY/20: before special items
4 Both net debt and EBITDA calculated at expected annual average exchange rates; excluding further potential acquisitions
For a detailed overview of special items please see the reconciliation tables on pages 17-18 of the PDF document.
7% sales growth in constant currency
Group sales increased by 8% (7% in constant currency) to €9,135 million in Q1/20 (Q1/19: €8,495 million) driven by all business segments. COVID-19 had only a slight negative effect on sales growth. Organic sales growth was 5%. Acquisitions/divestitures contributed net 2% to growth. Positive currency translation effects of 1% were mainly driven by the U.S. dollar strengthening against the euro.
1% net income1,2 growth in constant currency
Group EBITDA increased by 3% (2% in constant currency) to €1,755 million (Q1/191: €1,701 million).
Group EBIT remained on prior year’s level (-2% in constant currency) at €1,125 million (Q1/191: €1,130 million), impacted by negative COVID-19 effects. At Fresenius Kabi additional demand for drugs and devices to treat COVID-19 patients late in the quarter only partially offset the anticipated headwinds in China during most of the quarter. Helios Spain also faced very significant negative COVID-19 effects in March, mainly at its private hospital and ORP businesses. The EBIT margin was 12.3% (Q1/191: 13.3%).
Group net interest before special items improved to -€174 million in Q1/20 (Q1/19: -€181 million) mainly due to successful refinancing activities. Reported Group net interest improved to -€182 million (Q1/19: -€184 million).
The Group tax rate before special items was 22.6% (Q1/19: 23.3%). The reported Group tax rate was 22.6% (Q1/19: 23.3%).
Noncontrolling interest before special items was -€271 million (Q1/19: -€271 million), of which 96% was attributable to the noncontrolling interest in Fresenius Medical Care. Reported Group noncontrolling interest was -€271 million (Q1/19: -€261 million).
1 Before special items
2 Net income attributable to shareholders of Fresenius SE & Co. KGaA
For a detailed overview of special items please see the reconciliation tables on pages 17-18 of the PDF document.
Group net income1 before special items increased by 2% (1% in constant currency) to €465 million (Q1/19: €457 million). Reported Group net income1 was €459 million (Q1/19: €453 million). COVID-19 had a significant negative effect on net income growth.
Earnings per share1 before special items increased by 1% (1% in constant currency) to €0.83 (Q1/19: €0.82). Reported earnings per share1 were €0.82 (Q1/19: €0.81).
Continued investment in growth
Spending on property, plant and equipment was €547 million corresponding to 6% of sales (Q1/19: €441 million; 5% of sales). The investments in Q1/20 served primarily for the modernization and expansion of dialysis clinics, production facilities as well as hospitals, and day clinics. Subject to duration and magnitude of the COVID-19 pandemic, Fresenius may face delays of investment projects planned for 2020.
Total acquisition spending was €412 million (Q1/19: €1,923 million), mainly for the acquisition of two hospitals in Colombia by Fresenius Helios.
Cash flow development
Group operating cash flow increased to €878 million (Q1/19: €289 million) with a margin of 9.6% (Q1/19: 3.4%). Growth was driven by a favorable working capital development at both Fresenius Medical Care and Fresenius Kabi. Free cash flow before acquisitions and dividends was €305 million (Q1/19: -€168 million). Free cash flow after acquisitions and dividends was -€40 million (Q1/19: -€2,111 million, driven by the acquisition of NxStage by Fresenius Medical Care).
1 Net income attributable to shareholders of Fresenius SE & Co. KGaA
For a detailed overview of special items please see the reconciliation tables on pages 17-18 of the PDF document.
Solid balance sheet structure
Group total assets increased by 3% (3% in constant currency) to €68,972 million (Dec. 31, 2019: €67,006 million). Current assets increased by 7% (8% in constant currency) to €16,341 million (Dec. 31, 2019: €15,264 million). Non-current assets increased by 2% (1% in constant currency) to €52,631 million (Dec. 31, 2019: €51,742 million).
Total shareholders’ equity increased by 1% (1% in constant currency) to €26,956 million (Dec. 31, 2019: €26,580 million). The equity ratio was 39.1%.
Group debt increased by 5% (4% in constant currency) to €28,557 million (Dec. 31, 2019: €?27,258 million). Group net debt increased by 4% (3% in constant currency) to €?26,529 million (Dec. 31, 2019: €?25,604 million) driven by the closing of two hospital acquisitions in Colombia by Fresenius Helios and execution of the share buy-back program at Fresenius Medical Care as well as currency translation effects.
As of March 31, 2020, the net debt/EBITDA ratio increased to 3.68x1,2 (Dec. 31, 2019: 3.61x1,2) mainly due to the acquisitions made by Fresenius Helios, the share-buy back program at Fresenius Medical Care and negative COVID-19 effects on EBITDA.
1 At LTM average exchange rates for both net debt and EBITDA; pro forma closed acquisitions/divestitures
2 Before special items
For a detailed overview of special items please see the reconciliation tables on pages 17-18 of the PDF document.
Increased number of employees
As of March 31, 2020, the number of employees was 299,594 (Dec. 31, 2019: 294,134).
Business Segments
Fresenius Medical Care (Financial data according to Fresenius Medical Care press release)
Fresenius Medical Care is the world's largest provider of products and services for individuals with renal diseases. As of March 31, 2020, Fresenius Medical Care was treating 348,703 patients in 4,002 dialysis clinics. Along with its core business, the company provides related medical services in the field of Care Coordination.
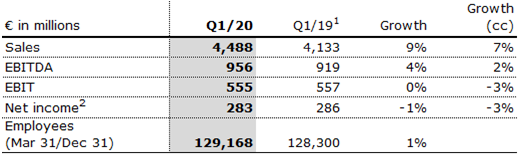
- 9% revenue increase supported by growth in all regions
- Solid cash-flow development
- Financial targets confirmed
Fresenius Medical Care increased sales by 9% (7% in constant currency) to €4,488 million (Q1/19: €4,133 million). Organic sales growth was 4%. Positive currency translation effects of 2% were mainly related to the U.S. dollar strengthening against the euro.
Reported EBIT increased by 3% (1% in constant currency) to €555 million (Q1/19: €537 million) mainly driven by a favorable impact from higher treatment volume and lower costs for pharmaceuticals. The reported EBIT margin was 12.4% (Q1/19: 13.0%). The decrease in margin was largely due to the unfavorable COVID-19 pandemic effect and the prior year reduction of a contingent consideration liability related to Xenios. EBIT on an adjusted basis was flat (decreased by 3% in constant currency) at €555 million (Q1/19: €557 million). The EBIT margin on an adjusted basis was 12.4% (Q1/19: 13.5%).
1 Q1/19 before special
2 Net income attributable to shareholders of Fresenius Medical Care AG & Co. KGaA
For a detailed overview of special items please see the reconciliation tables on pages 17-18 of the PDF document.
Reported net income1 grew by 4% (2% in constant currency) to €283 million (Q1/19: 271 million) and decreased on an adjusted basis by 1% (-3% in constant currency) to €283 million (Q1/19: €286 million).
Operating cash flow was €584 million (Q1/19: €76 million) with a margin of 13.0% (Q1/19: 1.8%). The increase was largely driven by working capital improvement, including a positive effect from cash collections, timing of payments and change in year over year inventory levels.
Fresenius Medical Care’s FY guidance published on February 20, 2020 did not take into account COVID-19 effects. Since it is too early to reliably assess and quantify the positive and negative effects of the COVID-19 pandemic, the Company confirms its 2020 outlook of expected sales2 and net income1,3 growth both within a mid to high single digit percentage range in constant currency. These targets are based on the adjusted results 2019 including the effects of the operations of the NxStage acquisition and the IFRS 16 implementation.
For further information, please see Fresenius Medical Care’s press release at www.freseniusmedicalcare.com.
1 Net income attributable to shareholders of Fresenius Medical Care AG & Co. KGaA
2 FY/19 base: €17,477 million
3 FY/19 base: €1,236 million (FY/20: before special items)
For a detailed overview of special items please see the reconciliation tables on pages 17-18 of the PDF document.
Fresenius Kabi
Fresenius Kabi offers intravenously administered generic drugs, clinical nutrition and infusion therapies for seriously and chronically ill patients in the hospital and outpatient environments. The company is also a leading supplier of medical devices and transfusion technology products. In the biosimilars business, Fresenius Kabi develops products with a focus on oncology and autoimmune diseases.

- Insignificant COVID-19 effect on sales growth, moderate negative effect on EBIT growth
- Anticipated softer demand in China during most of Q1/20 due to fewer elective surgeries followed by gradual resumption towards normal operations late in the quarter
- Increased demand for essential drugs and devices for the treatment of COVID-19 patients in North America and Europe late in Q1/20
- No major interruption at any production site
Fresenius Kabi increased sales by 5% (6% in constant currency) to €1,789 million (Q1/19: €1,701 million). Organic sales growth was 6%. Negative currency translation effects of 1% were mainly related to weakness of the Argentinian peso and the Brazilian real.
Sales in North America increased by 7% (organic growth: 5%) to €669 million (Q1/19: €623 million). Sales in Europe grew by 10% (organic growth: 10%) to €631 million (Q1/19: €573 million). In both regions, sales were driven by a spike of demand for sedation drugs, pain killers and infusion pumps starting late in Q1/20.
Sales in Asia-Pacific decreased by 6% (organic growth: -6%) to €319 million (Q1/19: €341 million). As anticipated, softer demand for clinical nutrition products and IV drugs in China was driven by the COVID-19 related postponement of elective treatments.
Sales in Latin America/Africa increased by 4% (organic growth: 16%) to €170 million (Q1/19: €164 million).
1 Before special items
2 Net income attributable to shareholders of Fresenius SE & Co. KGaA
For a detailed overview of special items please see the reconciliation tables on pages 17-18 of the PDF document.
EBIT before special items decreased by 5% (-5% in constant currency) to €289 million (Q1/191: €304 million) with an EBIT margin of 16.2% (Q1/191: 17.9%). The COVID-19 pandemic had a moderate net negative effect on EBIT.
Net income1,2 decreased by 2% (-3% in constant currency) to €197 million (Q1/19: €202 million).
Operating cash flow was €174 million (Q1/19: €145 million) with a margin of 9.7% (Q1/19: 8.5%), driven by an improved working capital position.
Since it is too early to reliably assess and quantify the positive and negative effects of the COVID-19 pandemic, Fresenius Kabi maintains its 2020 outlook of expected organic sales3 growth of 3% to 6% and an EBIT4 development of -4% to 0% in constant currency, excluding any effects from COVID-19.
1 Before special items
2 Net income attributable to shareholders of Fresenius SE & Co. KGaA
3 FY/19 base: €6,919 million
4 FY/19 base: €1,205 million, before special items, FY/20: before special items
For a detailed overview of special items please see the reconciliation tables on pages 17-18 of the PDF document.
Fresenius Helios
Fresenius Helios is Europe's leading private hospital operator. The company comprises Helios Germany and Helios Spain (Quirónsalud). Helios Germany operates 86 hospitals, ~125 outpatient centers and 7 prevention centers. Quirónsalud operates 46 hospitals, 72 outpatient centers and around 300 occupational risk prevention centers. In addition, the company is active in Latin America with 6 hospitals and as a provider of medical diagnostics.

- Strong business development in January and February; from March, postponement and cancellation of elective treatments
- Excluding slight negative COVID-19 effect, Q1/20 sales growth moderately above outlook range; significant negative COVID-19 effect on EBIT
- Law to ease financial burden on hospitals to offset large part of COVID-19 related sales losses and cost increases in Germany
- Some remaining uncertainties regarding the compensation of Spanish hospitals for their efforts to combat the COVID-19 pandemic
Fresenius Helios increased sales by 7% (organic growth: 5%) to €2,466 million (Q1/19: €2,311 million).
Sales of Helios Germany increased by 8% (organic growth: 8%) to €1,603 million (Q1/19: €1,485 million). Organic sales growth was positively influenced by pricing effects and admissions growth in January and February. From March, COVID-19 had an insignificant net effect as foregone sales from elective admissions were largely offset by the law to ease the financial burden on hospitals.
Sales of Helios Spain increased by 4% (organic growth: 1%) to €863 million (Q1/19: €826 million) driven by the recent hospital acquisitions in Colombia. COVID-19 related foregone elective surgeries significantly weighed on organic sales growth from March.
EBIT of Fresenius Helios increased by 2% to €274 million (Q1/19: €268 million) with an EBIT margin of 11.1% (Q1/19: 11.6%).
1 Net income attributable to shareholders of Fresenius SE & Co. KGaA
EBIT of Helios Germany increased by 11% to €165 million (Q1/19: €149 million) with an EBIT margin of 10.3% (Q1/19: 10.0%). EBIT was positively influenced by pricing effects and admissions growth in January and February. From March, COVID-19 had an insignificant net effect as foregone EBIT from elective admissions was largely offset by the law to ease the financial burden on hospitals.
EBIT of Helios Spain decreased by 7% to €112 million (Q1/19: €121 million) with an EBIT margin of 13.0% (Q1/19: 14.6%). January and February showed positive admission growth. From March, COVID-19 had a very significant negative effect on EBIT as foregone elective treatments met higher costs amidst the comprehensive efforts to combat the pandemic.
Net income1 increased by 1% to €176 million (Q1/19: €174 million).
Operating cash flow increased to €145 million (Q1/19: €103 million) with a margin of 5.9% (Q1/19: 4.5%), driven by a good operating performance in both regions.
Since it is too early to reliably assess and quantify the positive and negative effects of the COVID-19 pandemic, Fresenius Helios maintains its 2020 outlook of expected organic sales2 growth of 3% to 6% and EBIT3 growth of 3% to 7% in constant currency, excluding any effects from COVID-19.
1 Net income attributable to shareholders of Fresenius SE & Co. KGaA
2 FY/19 base: €9,234 million
3 FY/19 base: €1,025 million
Fresenius Vamed
Fresenius Vamed manages projects and provides services for hospitals and other health care facilities worldwide and is a leading post-acute care provider in Central Europe. The portfolio ranges along the entire value chain: from project development, planning, and turnkey construction, via maintenance and technical management to total operational management.

- Both project and service business contributing to organic sales growth of 10%
- Slight negative COVID-19 effect on sales, very significant negative effect on EBIT growth
- Post-acute care services impacted by COVID-19 related postponements of elective surgeries and health authority enforced closures of rehabilitation clinics; technical services insignificantly impacted by COVID-19
- Further COVID-19 related delays of project business orders and execution expected throughout 2020
Fresenius Vamed increased sales by 13% to €499 million (Q1/19: €440 million). Organic sales growth was 10%. Acquisitions contributed 3% to growth. Both service and project business showed strong growth momentum. COVID-19 had only a slight negative effect on sales.
Sales in the service business grew by 8% to €357 million (Q1/19: €332 million). Sales of the project business increased by 31% to €142 million (Q1/19: €108 million).
EBIT increased by 17% to €14 million (Q1/19: €12 million) with an EBIT margin of 2.8% (Q1/19: 2.7%). COVID-19 had a very significant negative effect on EBIT growth. Capacities in the post-acute care clinics were left idle given a generally lower intake of elective surgery patients from acute-care hospitals as well as authority-instigated restrictions or even closures of individual facilities.
1 Net income attributable to shareholders of VAMED AG
Net income1 increased by 17% to €7 million (Q1/19: €6 million).
Order intake was €124 million (Q1/19: €383 million). Order intake in the prior year was exceptionally strong. As of March 31, 2020, order backlog was at €2,846 million (December 31, 2019: €2,865 million) and already marked by COVID-19 related project delays.
Operating cash flow decreased to -€20 million (Q1/19: -€15 million) with a margin of
-4.0% (Q1/19: -3.4%), given continuing phasing effects, some delays in the international project business as well as working capital build-ups.
Since it is too early to reliably assess and quantify the positive and negative effects of the COVID-19 pandemic, Fresenius Vamed maintains its 2020 outlook of expected organic sales2 growth of 4% to 7% and EBIT3 growth of 5% to 9% in constant currency, excluding any effects from COVID-19.
1 Net income attributable to shareholders of VAMED AG
2 FY/19 base: €2,206 million
3 FY/19 base: €134 million
Conference Call
As part of the publication of the results for Q1 2020, a conference call will be held on May 6, 2020 at 1:30 p.m. CEDT (7:30 a.m. EDT). All investors are cordially invited to follow the conference call in a live broadcast over the Internet at www.fresenius.com/investors. Following the call, a replay will be available on our website.
For additional information on the performance indicators used please refer to our website https://www.fresenius.com/alternative-performance-measures.
This release contains forward-looking statements that are subject to various risks and uncertainties. Future results could differ materially from those described in these forward-looking statements due to certain factors, e.g. changes in business, economic and competitive conditions, regulatory reforms, results of clinical trials, foreign exchange rate fluctuations, uncertainties in litigation or investigative proceedings, and the availability of financing. Fresenius does not undertake any responsibility to update the forward-looking statements in this release.