Participations in affiliated and associated companies 2022
Mediathek Category
Mediathek Preview File
Mediathek Download
Mediathek Date
Share
Services
Fresenius Kabi’s tocilizumab biosimilar candidate, MSB11456, has received a positive recommendation for a marketing authorization from the European Medicines Agency’s (EMA) Committee for Medicinal Products for Human Use (CHMP). MSB11456 becomes the first tocilizumab biosimilar candidate to be granted a positive opinion by the CHMP for the treatment of several autoimmune diseases. This achievement marks a significant milestone in Fresenius Kabi’s Vision 2026 growth strategy.
For more information, please see the website of Fresenius Kabi.
September 12, 2023
New York, USA
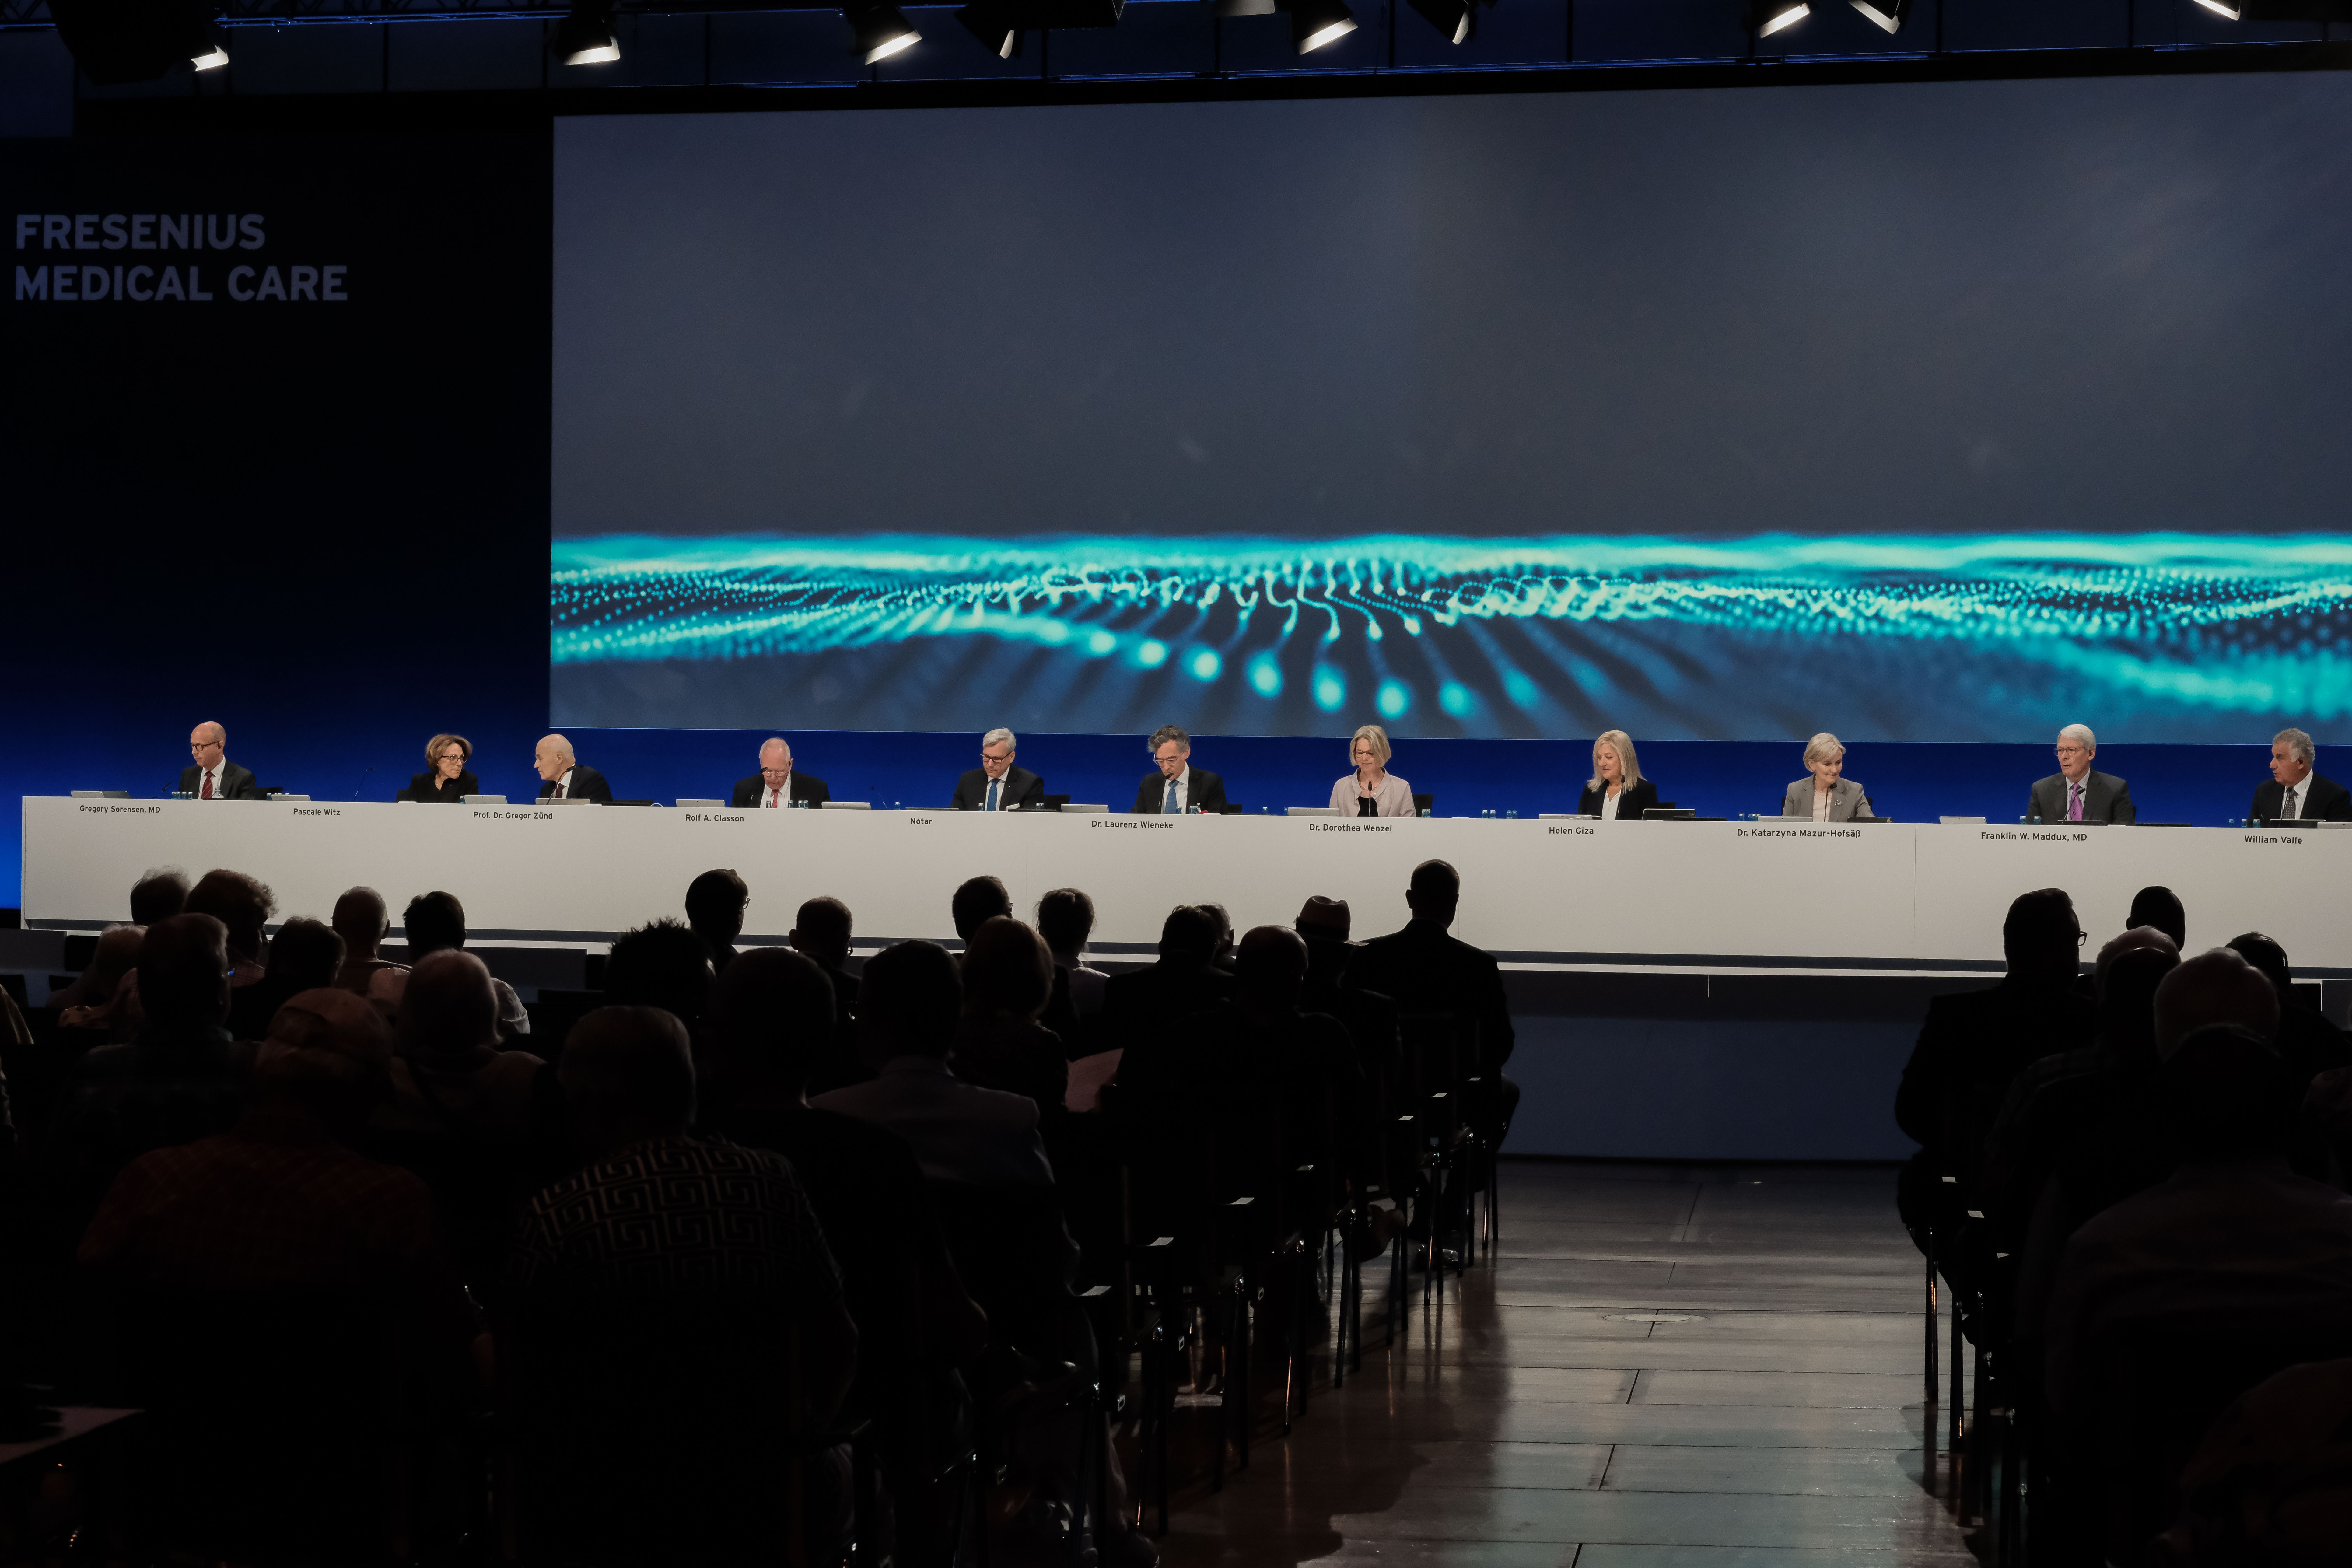
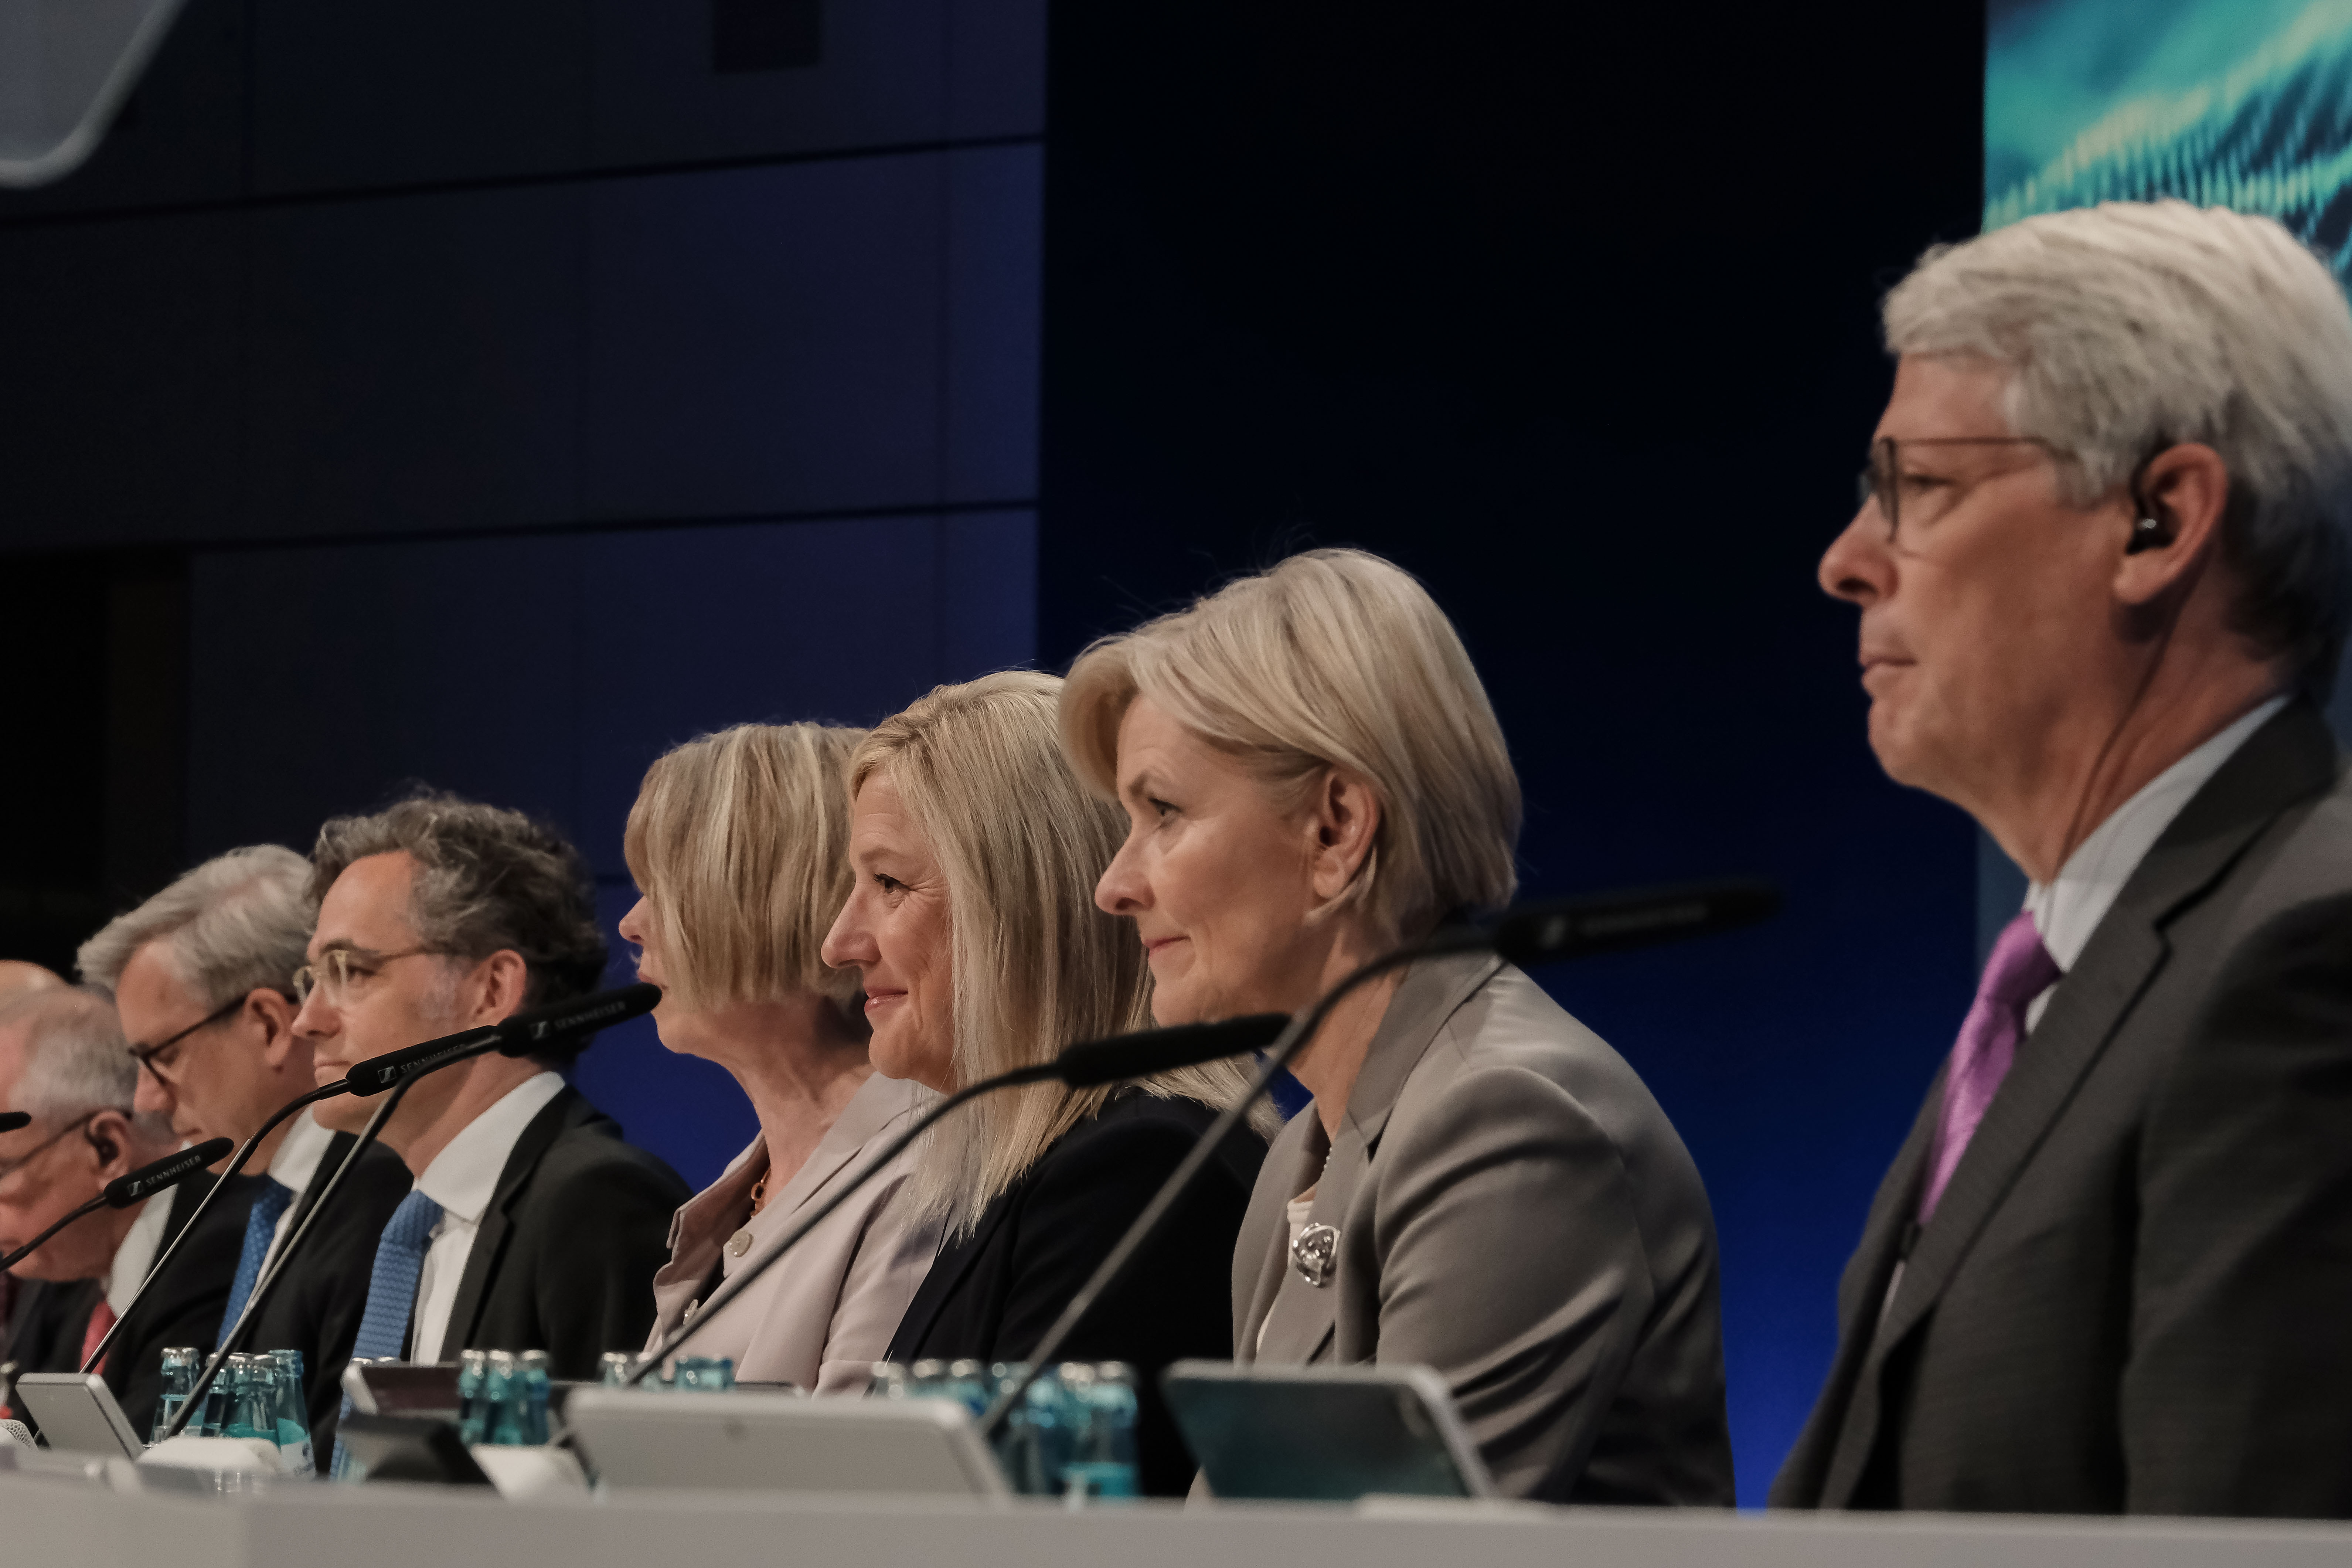
Fresenius Medical Care, the world’s leading provider of products and services for individuals with renal diseases, held an Extraordinary General Meeting (EGM) today. The Company’s shareholders approved all agenda items with large majority, including the conversion of Fresenius Medical Care from the legal form of a partnership limited by shares (Kommanditgesellschaft auf Aktien, KGaA) into a German stock corporation (Aktiengesellschaft, AG), and elected the four shareholder representatives on the Supervisory Board of the new Fresenius Medical Care AG. In its constituting meeting following the EGM, the new Supervisory Board elected Michael Sen as its Chair.
Michael Sen, Chair of the Supervisory Board of Fresenius Medical Care AG, said: “Our shareholders’ vote today clearly is a sign of confidence showing that we are on the right track with Fresenius and with Fresenius Medical Care. As the Chair of the Supervisory Board, I am delighted to lead this new Supervisory Board consisting of highly qualified individuals. Their diverse backgrounds and experiences will provide a great balance between continuity and fresh perspectives. I look forward to working with this great team. Furthermore, I would like to express my sincere appreciation to the long-standing Chair of the Supervisory Board, Dr Dieter Schenk, who has supported and guided the company for almost three decades. My gratitude also goes to Rolf Classon, Dr Dorothea Wenzel and Professor Dr Gregor Zünd whose mandates as Supervisory Board members will end once the conversion is completed.”
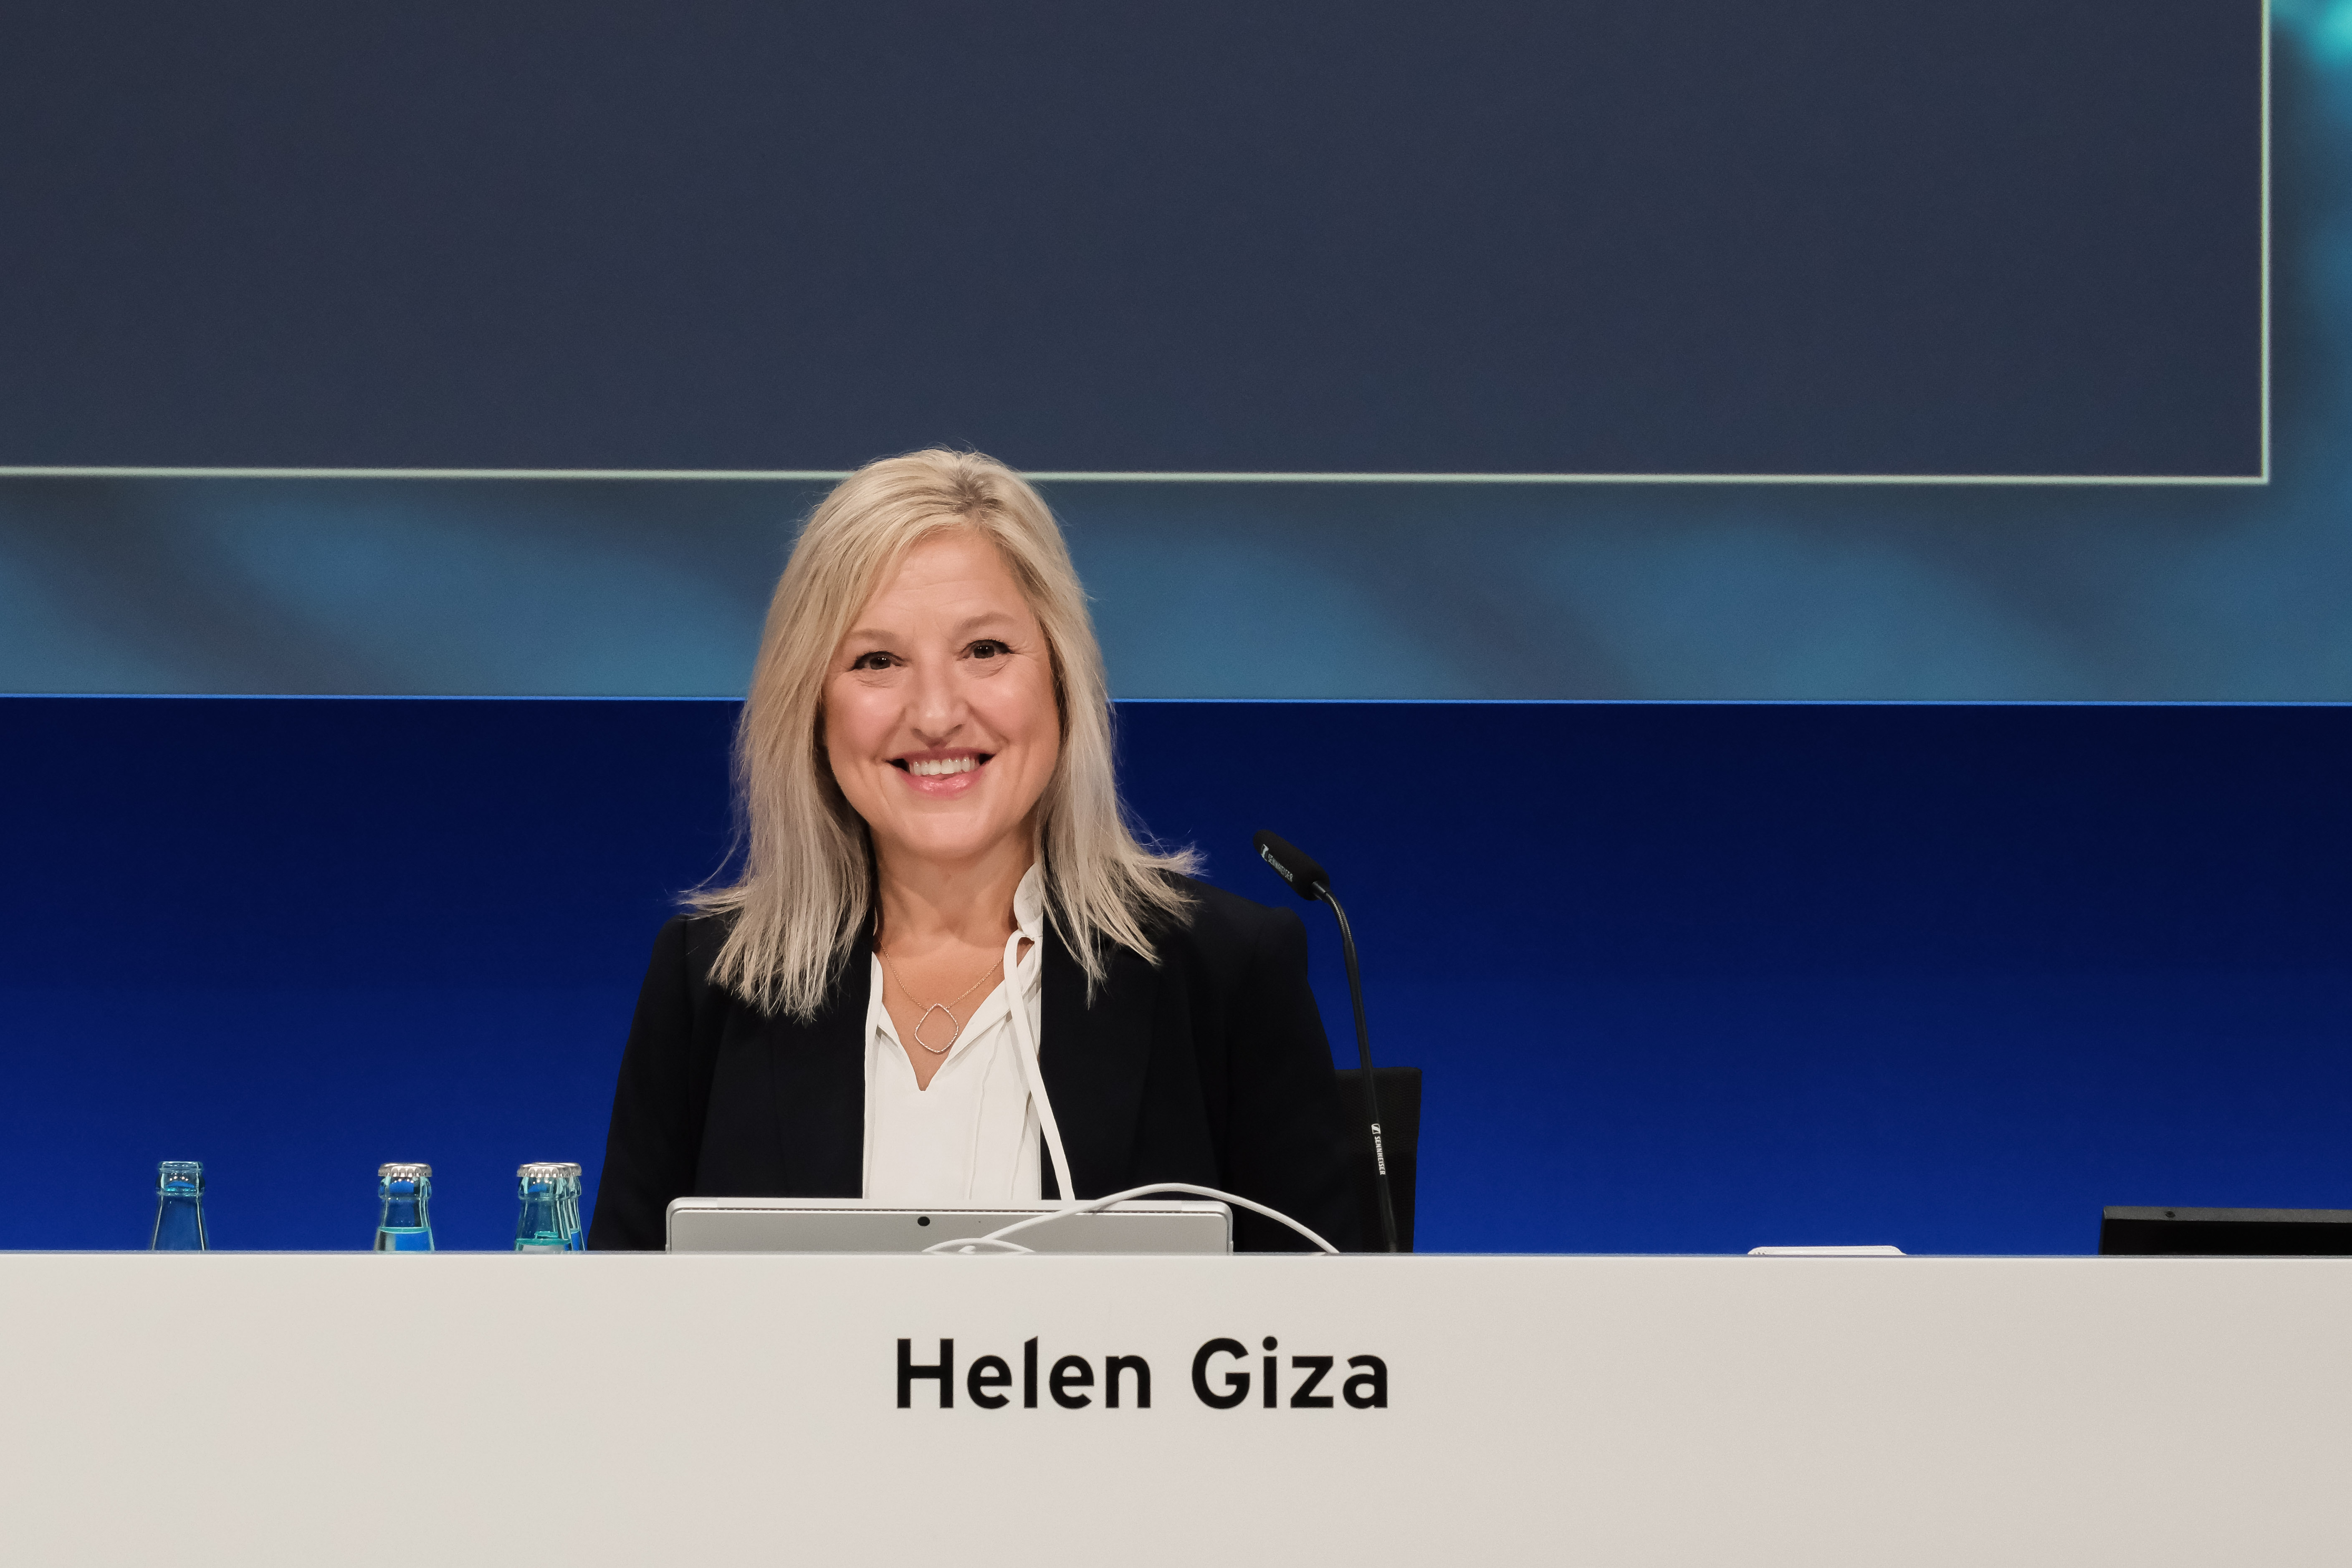
Helen Giza, CEO of Fresenius Medical Care AG, said: “Today’s decision of our shareholders to convert Fresenius Medical Care into a German stock corporation opens a new chapter in the development of the Company. I strongly believe that following the conversion, the decision-making processes will be accelerated. Therefore, we will be more agile in our efforts in unlocking value as the leading kidney care Company. The role of our free float shareholders will also be particularly strengthened. I’m excited about collaborating with our new Supervisory Board and leading Fresenius Medical Care into a successful future, together with my team and our committed employees around the world.”
Following the conversion into a German stock corporation, Fresenius Medical Care will have a standard German two-tier Board system that is familiar to shareholders and in line with widely recognized corporate governance practices. The co-determined Supervisory Board will in future consist of twelve members. At today’s EGM, Shervin J. Korangy, Dr Marcus Kuhnert, Gregory Sorensen, M.D. and Pascale Witz were elected members of the new Supervisory Board. In addition to them, Fresenius SE & Co. KGaA (Fresenius), which holds approx. 32.2 percent of the ordinary share capital, appoints two members to the new Supervisory Board: its CEO Michael Sen, who has been elected as Chair of the new Supervisory Board, as well as its CFO Sara Hennicken. This is a testament to Fresenius’ close relationship with Fresenius Medical Care and its continued commitment to the Company. The other six members of the new Supervisory Board will be elected by the employees at a later point in time. The new Supervisory Board will perform all supervisory functions, including strategy review, management appointments, remuneration, approval of important management decisions and audit once the conversion becomes effective.
Today, the new Supervisory Board of Fresenius Medical Care AG also formally appointed the Management Board of the future Fresenius Medical Care AG, which consists of the members of the existing Management Board of Fresenius Medical Care Management AG.
In addition to the simplification of the corporate governance, the conversion into a German stock corporation provides further advantages. The simplified structure will, for instance, lead to a more efficient and faster decision-making as it allows for a clearer focus on the interests of the Fresenius Medical Care group and frees up management resources. Fresenius Medical Care will also have greater flexibility concerning its financial strategy. Furthermore, the role of free float shareholders will be strengthened as their influence on the composition of Fresenius Medical Care’s management increases.
Given the approval of all agenda items at today’s EGM, all necessary administrative, compliance and regulatory steps will now be initiated. The entire process of the conversion of Fresenius Medical Care into a German stock corporation is expected to be completed by the end of 2023. Until completion, the current corporate governance structure and the corresponding corporate bodies, including the current Supervisory Boards, remain in place.
This release contains forward-looking statements that are subject to various risks and uncertainties. Actual results could differ materially from those described in these forward-looking statements due to various factors, including, but not limited to, changes in business, economic and competitive conditions, legal changes, regulatory approvals, impacts related to the COVID-19 pandemic results of clinical studies, foreign exchange rate fluctuations, uncertainties in litigation or investigative proceedings, and the availability of financing. These and other risks and uncertainties are detailed in Fresenius Medical Care AG & Co. KGaA's reports filed with the U.S. Securities and Exchange Commission. Fresenius Medical Care AG & Co. KGaA does not undertake any responsibility to update the forward-looking statements in this release.
Fresenius Kabi announced today that its biosimilar candidate FKS518, a denosumab biosimilar candidate for the US reference product Prolia®*, successfully met its primary and secondary objectives in a recently conducted clinical trial on pharmacokinetic similarity. For more information, please see the website of Fresenius Kabi.
*Prolia® is a registered trademark of Amgen Inc.