

Q1/2018:
- Sales: €8.1 billion (-1%, +7% in constant currency1)
- EBIT2: €1,054 million (-13%, -5% in constant currency)
- EBIT2: €1,089 million (-10%, -2% in constant currency) (excluding biosimilars business)
- Net income2,3: €450 million (-2%, +7% in constant currency)
- Net income2,3: €476 million (+4%, +12% in constant currency) (excluding biosimilars business)
1 Growth rates adjusted for IFRS 15 adoption (Q1/17 base: €8,223 million) 2 Before special items (i.e., expenses related to (i) the Akorn transaction, and (ii) the re-valuation of Sound Physicians’ share-based payment program caused by its announced divestiture) 3 Net income attributable to shareholders of Fresenius SE & Co. KGaA
For a detailed overview of special items please see the reconciliation table on page 16 of the PDF.
Fresenius terminates merger agreement with Akorn
Fresenius decided on April 22, 2018, to terminate the company’s merger agreement with Akorn, due to Akorn’s failure to fulfill several closing conditions. Fresenius’ decision is based on, among other factors, material breaches of FDA (Food and Drug Administration) data integrity requirements relating to Akorn’s operations found during Fresenius’ independent investigation. Fresenius had offered to delay its decision in order to allow Akorn additional opportunity to complete its own investigation and present any information it wished Fresenius to consider, but Akorn declined that offer.
Akorn disagrees with Fresenius’ position and has filed a corresponding complaint. Fresenius in turn has filed a counterclaim on April 30, 2018.
Group guidance1 for 2018 confirmed
Fresenius confirms its guidance for 2018. Group sales are expected to increase by 5% to 8%2 in constant currency. Net income3,4 is expected to grow by 6% to 9% in constant currency. Excluding expenditures for the further development of the biosimilars business, net income3,5 is expected to grow by ~10% to 13% in constant currency.
Fresenius expects to further reduce its net debt/EBITDA6 ratio by year-end 2018.
7% sales growth in constant currency7
Group sales decreased by 1%7 (increased by 7%7 in constant currency) to €8,121 million (Q1/2017: €8,362 million). Organic sales growth was 4%. Acquisitions/divestitures contributed net 3% to growth. Sales growth was impacted by the anticipated decline in the pharmacy business within Care Coordination at Fresenius Medical Care North America. Also at Fresenius Medical Care, the prior-year quarter saw the compensation for treatments of U.S. war veterans in previous years ("VA agreement"), contributing €100 million as a one-time effect. Negative currency translation effects (8%) were mainly driven by the devaluation of the U.S. dollar and the Chinese yuan against the euro.
1 Excluding effects of the Akorn, NxStage and Sound Physicians transactions2 2017 base adjusted for IFRS 15 adoption (deduction of €486 million at Fresenius Medical Care) 3 Net income attributable to shareholders of Fresenius SE & Co. KGaA 4 2017 base: €1,816 million; 2018 before special items (i.e., transaction-related effects); including expenditures for further development of biosimilars business (€43 million after tax in FY/17 and ~€120 million after tax in FY/18) 5 2017 base: €1,859 million; 2018 before special items (i.e., transaction-related effects) 6 Calculated at expected annual average exchange rates, for both net debt and EBITDA; excluding effects of the Akorn, NxStage and Sound Physicians transactions; excluding further potential acquisitions; at current IFRS rules 7 Growth rates adjusted for IFRS 15 adoption (Q1/17 base: €8,223 million)
Group sales by region:

1 2017 adjusted for IFRS 15 adoption (deduction of €139 million at Fresenius Medical Care)
7% net income1,2 growth in constant currency
Group EBITDA2 decreased by 10% (-2% in constant currency) to €1,403 million (Q1/2017: €1,560 million). Group EBIT2 decreased by 13% (-5% in constant currency) to €1,054 million (Q1/2017: €1,216 million). The prior-year quarter was strongly influenced by a positive one-time effect: the VA agreement contributed €99 million, or 10%, to EBIT growth in constant currency in Q1/17. The EBIT margin2 was 13.0% (12.7% before IFRS 15; Q1/2017: 14.5%). Group EBIT2 before expenses for the further development of the biosimilars business decreased by 10% (-2% in constant currency) to €1,089 million. Group EBIT2 before VA agreement and excluding the expenses for the biosimilars business increased by 6% in constant currency.
Group net interest2 was -€146 million (Q1/2017: -€157 million). The decrease is mainly driven by currency effects and positive refinancing activities.
The decrease of the Group tax rate before special items to 21.0% (Q1/2017: 29.1%) was mainly due to the U.S. tax reform and a one-time tax effect at Fresenius Medical Care.
Noncontrolling interest2 was €267 million (Q1/2017: €294 million), of which 95% was attributable to the noncontrolling interest in Fresenius Medical Care.
Group net income1,2 decreased by 2% (increased by 7% in constant currency) to €450 million (Q1/2017: €457 million). Earnings per share1,2 decreased by 2% (increased by 6% in constant currency) to €0.81 (Q1/2017: €0.83).
Group net income1,2 before expenses for the further development of the biosimilars business increased by 4% (12% in constant currency) to €476 million (Q1/2017: €457 million). Earnings per share1,2 before expenses for the further development of the biosimilars business increased by 4% (11% in constant currency) to €0.86 (Q1/2017: €0.83).
Group net income1 after special items decreased by 4% (increased by 4% in constant currency) to €440 million (Q1/2017: €457 million). Earnings per share1 after special items decreased by 5% (increased by 4% in constant currency) to €0.79 (Q1/2017: €0.83).
1 Net income attributable to shareholders of Fresenius SE & Co. KGaA 2 Before special items
For a detailed overview of special items please see the reconciliation table on page 16 of the PDF.
Continued investment in growth
Spending on property, plant and equipment was €380 million (Q1/2017: €328 million), primarily for the modernization and expansion of dialysis clinics, production facilities as well as hospitals and day clinics. This corresponds to 4.7% of sales.
Total acquisition spending was €192 million (Q1/2017: €6,083 million). The prior-year quarter included the acquisition of Quirónsalud.
Cash flow development
Operating cash flow decreased by 50% to €236 million (Q1/2017: €476 million) with a margin of 2.9% (Q1/2017: 5.7%). The decrease is mainly attributable to prior years’ received payment under the VA agreement of ~€200 million as well as to the seasonality in invoicing at Fresenius Medical Care North America, which is not expected to impact full year 2018 cash flow.
Free cash flow before acquisitions and dividends decreased to -€155 million (Q1/2017: €148 million). Free cash flow after acquisitions and dividends was -€389 million (Q1/2017: -€5,393 million).
Solid balance sheet structure
The Group’s total assets increased by 1% (2% in constant currency) to €53,502 million (Dec. 31, 2017: €53,133 million). Current assets grew by 6% (8% in constant currency) to €13,409 million (Dec. 31, 2017: €12,604 million). Non-current assets decreased by 1% (0% in constant currency) to €40,093 million (Dec. 31, 2017: € 40,529 million).
Total shareholders’ equity increased by 1% (3% in constant currency) to €22,020 million (Dec. 31, 2017: €21,720 million). The equity ratio increased to 41.2% (Dec. 31, 2017: 40.9%).
Group debt increased by 1% (2% in constant currency) to €19,200 million (Dec. 31, 2017: € 19,042 million). Group net debt increased by 2% (3% in constant currency) to € 17,716 million (Dec. 31, 2017: € 17,406 million).
As of March 31, 2018, the net debt/EBITDA ratio was 2.98 , (December 31, 2017: 2.841,2).
1 At LTM average exchange rates for both net debt and EBITDA; pro forma closed acquisitions, excluding Akorn, NxStage and Sound Physicians transactions 2 Before special items
For a detailed overview of special items please see the reconciliation table on page 16 of the PDF.
Business Segments
Fresenius Medical Care
Fresenius Medical Care is the world's largest provider of products and services for individuals with renal diseases. As of March 31, 2018, Fresenius Medical Care was treating 322,253 patients in 3,790 dialysis clinics. Along with its core business, the company provides related medical services in the field of Care Coordination.

- Q1/2018 growth impacted by significant currency headwinds and positive one-time effect in prior years’ quarter
- 2018 outlook of net income growth4,7 of 13 to 15% in constant currency confirmed
- 2018 sales growth8 target adjusted to 5 to 7% at constant currency (previously ~8%), mainly due to recent reduction in dosing of calcimimetic drugs in the U.S.
Reported sales were strongly impacted by headwinds from foreign exchange rates and by the anticipated decline in the pharmacy business within Care Coordination at Fresenius Medical Care North America. Sales decreased by 10%1 (increased by 2%1 in constant currency) to €3,976 million (Q1/2017: €4,548 million). Organic sales growth was 3%. Acquisitions/divestitures and the VA agreement in the prior-year quarter decreased sales by 1%. Currency translation effects reduced sales by 12%. Excluding the VA agreement in the prior-year quarter, sales growth1 was 4% in constant currency.
1 Growth rate adjusted for IFRS 15 adoption (Q1/17 base: €4,409 million) 2 Excluding VA agreement: 4% 3 Adjusted for re-valuation of Sound Physicians’ share-based payment program and excluding VA agreement: 3% 4 Net income attributable to shareholders of Fresenius Medical Care AG & Co. KGaA 5 Adjusted for re-valuation of Sound Physicians’ share-based payment program, the effect of the U.S. Tax Reform and excluding VA agreement: 8% 6 Consistent with guidance, adjusted for re-valuation of Sound Physicians’ share-based payment program, including the effect of the U.S. Tax Reform and including VA agreement 7 2017 base: €1,280 million; 2018 including benefits from U.S. tax reform and adjusted for the Sound valuation impact 8 2017 reported sales: €17,784 million, adjusted for IFRS 15 adoption (deduction of €486 million)
Health Care services sales (dialysis services and care coordination) decreased by 12%1 (increased by 1%1 in constant currency) to €3,209 million (Q1/2017: €3,769 million). Health Care product sales decreased by 2% (increased by 6% in constant currency) to €767 million (Q1/2017: €779 million).
In North America, sales decreased by 14%1 (-1%1 in constant currency) to €2,774 million (Q1/2017: €3,375 million). Health Care services sales decreased by 14%1 (-1%1 in constant currency) to €2,590 million (Q1/2017: €3,165 million) mainly due to the prior-year VA agreement (€100 million). Excluding the 2017 effect from the VA Agreement Health Care services sales increased by 2%1 in constant currency. Health Care product sales decreased by 12% (increased by 1% in constant currency) to €184 million (Q1/2017: €210 million).
Sales outside North America increased by 2% (10% in constant currency) to €1,198 million (Q1/2017: €1,169 million). Health Care services sales increased by 2% (12% in constant currency) to €619 million (Q1/2017: €604 million). Health Care product sales increased by 3% (8% in constant currency) to €579 million (Q1/2017: €564 million).
Fresenius Medical Care’s EBIT decreased by 24% (-15% in constant currency) to €497 million (Q1/2017: €651 million). The EBIT margin was 12.5% (Q1/2017: 14.3%). Adjusted for the effect of the implementation of IFRS 15, the re-valuation of Sound Physicians’ share-based payment program in connection with the announced divestiture of Sound Physicians and for the positive effect of the VA Agreement in Q1/2017, EBIT was up by 3% in constant currency and EBIT margin was stable at 12.8%.
Net income2 of Fresenius Medical Care decreased by 10% (0% in constant currency) to €279 million (Q1/2017: €308 million). Consistent with guidance, i.e. adjusted for the re-valuation of Sound Physicians’ share-based payment program, net income growth2 was 5% in constant currency. Adjusted for the re-valuation of Sound Physicians’ share-based payment program and the effect of the U.S. Tax Reform in 2018 and for the positive effect of the VA agreement, net income growth2 was 8% in constant currency.
1 Growth rate adjusted for IFRS 15 adoption (Q1/17: deduction of €139 million)2 Net income attributable to shareholders of Fresenius Medical Care AG & Co. KGaA
Operating cash flow was -€45 million (Q1/2017: €170 million). The cash flow margin was 1.1% (Q1/2017: 3.7%). The decrease is mainly attributable to prior years’ payment under the VA agreement of ~€200 million as well as to the seasonality in invoicing at Fresenius Medical Care North America, which is not expected to impact full year 2018 cash flow.
Mainly driven by the change in dosing of calcimimetic drugs, Fresenius Medical Care expects sales to grow by 5 to 7%1 (previously: ~8%1 ) in constant currency. Fresenius Medical Care expects net income2 growth of 13% to 15%3 in constant currency and excluding special items of 7% to 9%4.
The 2018 targets are based on 2017 figures adjusted for the adoption of IFRS 15 implementation and exclude effects from the planned acquisition of NxStage Medical and the announced divestiture of Sound Physicians.
1 2017 reported sales: €17,784 million, adjusted for IFRS 15 adoption (deduction of €486 million) 2 Net income attributable to shareholders of Fresenius Medical Care AG & Co. KGaA 3 2017 base: €1,280 million; 2018 including benefits from U.S. tax reform and adjusted for the Sound valuation impact 4 VA Agreement, Natural Disaster Costs, FCPA related charge, U.S. Tax Reform
For further information, please see Fresenius Medical Care’s Investor News at www.freseniusmedicalcare.com.
Fresenius Kabi
Fresenius Kabi offers intravenously administered generic drugs, clinical nutrition and infusion therapies for seriously and chronically ill patients in the hospital and outpatient environments. The company is also a leading supplier of medical devices and transfusion technology products. In the biosimilars business, we are developing products with a focus on oncology and autoimmune diseases.

- Excellent start to 2018
- 9% organic sales growth; 10% EBIT1 growth in constant currency (excluding biosimilars business)
- Strong negative currency translation effects
- Strong operating cash flow
- 2018 outlook confirmed
With €1,603 million (Q1/2017: €1,604 million), sales of Fresenius Kabi were on prior years level (increased by 9% in constant currency). Organic sales growth was 9%. Strong negative currency translation effects (-9%) were mainly related to the devaluation of the U.S. dollar and the Chinese yuan against the euro.
Sales in Europe grew by 2% (organic growth: 3%) to €557 million (Q1/2017: €544 million).
Sales in North America decreased by 5% (organic growth: 10%) to €591 million (Q1/2017: €619 million).
Sales in Asia-Pacific increased by 8% (organic growth: 15%) to €301 million (Q1/2017: €280 million). Sales in Latin America/Africa decreased by 4% (organic growth: 10%) to €154 million (Q1/2017: €161 million).
EBIT1 decreased by 14% (-2% in constant currency) to €268 million (Q1/2017: €313 million). The EBIT margin1 was 16.7% (Q1/2017: 19.5%).
1 Before special items 2 Before expenses for the further development of the biosimilars business: 10% 3 Net income attributable to shareholders of Fresenius SE & Co. KGaA4 Before expenses for the further development of the biosimilars business: 16%
For a detailed overview of special items please see the reconciliation table on page 16 of the PDF.
EBIT1 before expenses for the further development of the biosimilars business decreased by 3% (increased by 10% in constant currency) to €303 million (Q1/2017: €313 million). The EBIT margin1 before expenses for the further development of the biosimilars business was 18.9% (Q1/2017: 19.5%).
Net income1,2 decreased by 11% (increased by 3% in constant currency) to €170 million (Q1/2017: €191 million).
Operating cash flow increased by 18% to €226 million (Q1/2017: €192 million). The cash flow margin was 14.1% (Q1/2017: 12.0%).
Fresenius Kabi confirms its outlook for 2018 and expects organic sales growth of 4% to 7% and EBIT growth in constant currency of -3% to -6%3. Excluding expenditures for the further development of the biosimilars business, EBIT is expected to grow by ~2% to 5%4 in constant currency.
1 Before special items 2 Net income attributable to shareholders of Fresenius SE & Co. KGaA 3 2017 base: €1,177 million; 2018 before special items (i.e., transaction-related expenses), including expenditures for the further development of the biosimilars business (€60 million in FY/17 and expected expenditures of ~€160 million in FY/18) 4 2017 base: €1,237 million; 2018 before special items (i.e., transaction-related expenses)
For a detailed overview of special items please see the reconciliation table on page 16 of the PDF.
Fresenius Helios
Fresenius Helios is Europe's leading private hospital operator. The company comprises Helios Germany and Helios Spain (Quirónsalud). Helios Germany operates 111 hospitals, thereof 88 acute care clinics and 23 post-acute care clinics, and treats more than 5.3 million patients annually. Quirónsalud operates 45 hospitals, 55 outpatient centers and around 300 occupational risk prevention centers, and treats approximately 11.6 million patients per year.

- 3% organic sales growth
- 9% EBIT increase
- 2018 outlook confirmed
Fresenius Helios increased sales by 16% to €2,331 million (Q1/2017: €2,018 million). Organic sales growth was 3%. The acquisition of Quirónsalud contributed 13% to sales growth. Helios Spain (Quirónsalud) has been consolidated since February 1, 2017.
Sales of Helios Germany increased by 3% (organic growth: 3%) to €1,574 million (Q1/2017: €1,528 million). Helios Spain increased sales by 54% (organic growth: 1%) to €757 million (Q1/2017: €490 million), mainly due to the additional month of consolidation compared to the prior-year quarter.
Fresenius Helios grew EBIT by 9% to €278 million (Q1/2017: €255 million). The EBIT margin was 11.9% (Q1/2017: 12.6%).
EBIT of Helios Germany decreased by 2% to €177 million (Q1/2017: €181 million) with a margin of 11.2% (Q1/2017: 11.8%). The decline is due to preparatory measures for anticipated regulatory structural requirements for minimum staffing as well as catalogue effects. The anticipated regulatory requirements will be countered by clustering.
EBIT of Helios Spain increased by 39% to €103 million (Q1/2017: €74 million), mainly due to the additional month of consolidation compared to prior-year quarter. The EBIT margin was 13.6% (Q1/2017: 15.1%).
Net income1 of Fresenius Helios increased by 6% to €191 million (Q1/2017: €181 million).
Operating cash flow was €97 million (Q1/2017: €184 million). The margin was 4.2% (Q1/2017: 9.1%).
Fresenius Helios confirms its outlook for 2018 and expects organic sales growth of 3% to 6% and EBIT growth of 7% to 10%.
1 Net income attributable to shareholders of Fresenius SE & Co. KGaA
Fresenius Vamed
Fresenius Vamed manages projects and provides services for hospitals and other health care facilities worldwide. The portfolio ranges along the entire value chain: from project development, planning, and turnkey construction, via maintenance and technical management, to total operational management.

- 9% organic sales growth
- Order backlog of €2,391 million at all-time high
- 2018 outlook confirmed
Sales increased by 12% (12% in constant currency) to €249 million (Q1/2017: €223 million). Organic sales growth was 9%. Sales in the project business increased by 19% to €92 million (Q1/2017: €77 million). Sales in the service business grew by 8% to €157 million (Q1/2017: €146 million).
EBIT of €6 million was unchanged from the prior-year level.
Net income1 of €4 million was also unchanged from prior-year level.
Order intake was €260 million (Q1/2017: €220 million). As of March 31, 2018, order backlog was €2,391 million (December 31, 2017: €2,147 million).
For 2018, Fresenius Vamed expects organic sales growth in the range of 5% to 10% and EBIT growth of 5% to 10%.
1 Net income attributable to shareholders of VAMED AG
Conference Call
As part of the publication of the results for the first quarter 2018, a conference call will be held on May 3, 2018 at 2 p.m. CET (8 a.m. EST). All investors are cordially invited to follow the conference call in a live broadcast over the Internet at www.fresenius.com/investors. Following the call, a replay will be available on our website.
For additional information on the performance indicators used please refer to www.fresenius.com/alternative-performance-measures.
This release contains forward-looking statements that are subject to various risks and uncertainties. Future results could differ materially from those described in these forward-looking statements due to certain factors, e.g. changes in business, economic and competitive conditions, regulatory reforms, results of clinical trials, foreign exchange rate fluctuations, uncertainties in litigation or investigative proceedings, and the availability of financing. Fresenius does not undertake any responsibility to update the forward-looking statements in this release.

Fresenius is making steady progress on the expansion of the global healthcare group’s headquarters in Bad Homburg, Germany. Construction started this week on a new research and development building for Fresenius Medical Care, which will offer 150 modern workplaces over six floors. Scheduled for completion in mid-2019, the new building is being erected beside the company’s existing R&D center on Daimler Street and will be connected to it by an overhead walkway.
The goal is to bring all R&D employees of Fresenius Medical Care in Bad Homburg together at one site. “Bad Homburg is an important location in Fresenius Medical Care’s worldwide research and development network,” said Stephan Sturm, CEO of Fresenius. “Our employees here develop life-saving equipment and digital solutions for the treatment of people with chronic kidney failure. For that reason we want to offer them the best possible work environment.”
Meanwhile, construction of the new office building on Else-Kröner Street in Bad Homburg, with about 600 workplaces, is on schedule. Structural work should be completed this spring, and the building’s opening is planned for next year. Fresenius currently employs about 3,600 people in Bad Homburg, and about 300 in the neighboring town of Oberursel.
For the seventh straight time, the market research institute Potentialpark has honored the global healthcare group Fresenius as the German company with the best overall Internet offering for job applicants.
In its just-released study for 2018, Potentialpark also put Fresenius first in two individual categories – Online Application Management and Mobile. The company was rated second in the Career Website category, and third for Social Media.
Potentialpark has carried out an annual study of German companies’ online offerings for job applicants since 2002. For this year’s study, Potentialpark assessed the online activities of 141 German companies according to more than 300 criteria. Some 38,000 students and graduates around the world participated.
“Digital channels are hugely important to our potential applicants – and that makes them essential for us,” said Markus Olbert, Senior Vice President for Corporate Human Resources at Fresenius. “For us, these awards from Potentialpark are both an indicator and a motivator to continually improve. For example, we recently overhauled our job search, and in combination with some additional optimizations to our digital channels we were able to increase the number of completed applications by about 25 percent.”
-
Press conference on the Full Year 2017 results on February 27, 2018 at Fresenius headquarters in Bad Homburg, Germany. Download Image (JPG 2.20 MB) -
![]()
Stephan Sturm, CEO of Fresenius presenting the Full Year 2017 results at the press conference held at Fresenius headquarters in Bad Homburg, Germany. Download Image (JPG 2.50 MB) -
![]()
Stephan Sturm, CEO of Fresenius presenting the Full Year 2017 results at the press conference held at Fresenius headquarters in Bad Homburg, Germany. Download Image (JPG 2.06 MB) -
![]()
Stephan Sturm, CEO of Fresenius presenting the Full Year 2017 results at the press conference held at Fresenius headquarters in Bad Homburg, Germany. Download Image (JPG 3.19 MB) -
![]()
Stephan Sturm, CEO of Fresenius presenting the Full Year 2017 results at the press conference held at Fresenius headquarters in Bad Homburg, Germany. Download Image (JPG 3.69 MB) -
![]()
Rice Powell, CEO of Fresenius Medical Care. Download Image (JPG 2.16 MB) -
![]()
Stephan Sturm (left), CEO of Fresenius, and Rice Powell, CEO of Fresenius Medical Care, at the joint press conference. Download Image (JPG 2.42 MB) -
![]()
From left: Fresenius CEO Stephan Sturm, Fresenius CFO Rachel Empey, Fresenius Medical Care CFO Mike Brosnan and Fresenius Medical Care CEO Rice Powell. Download Image (JPG 2.88 MB) -
![]()
Stephan Sturm, CEO of Fresenius Download Image (JPG 2.24 MB) -
![]()
Rachel Empey, CFO of Fresenius Download Image (JPG 2.09 MB) -
![]()
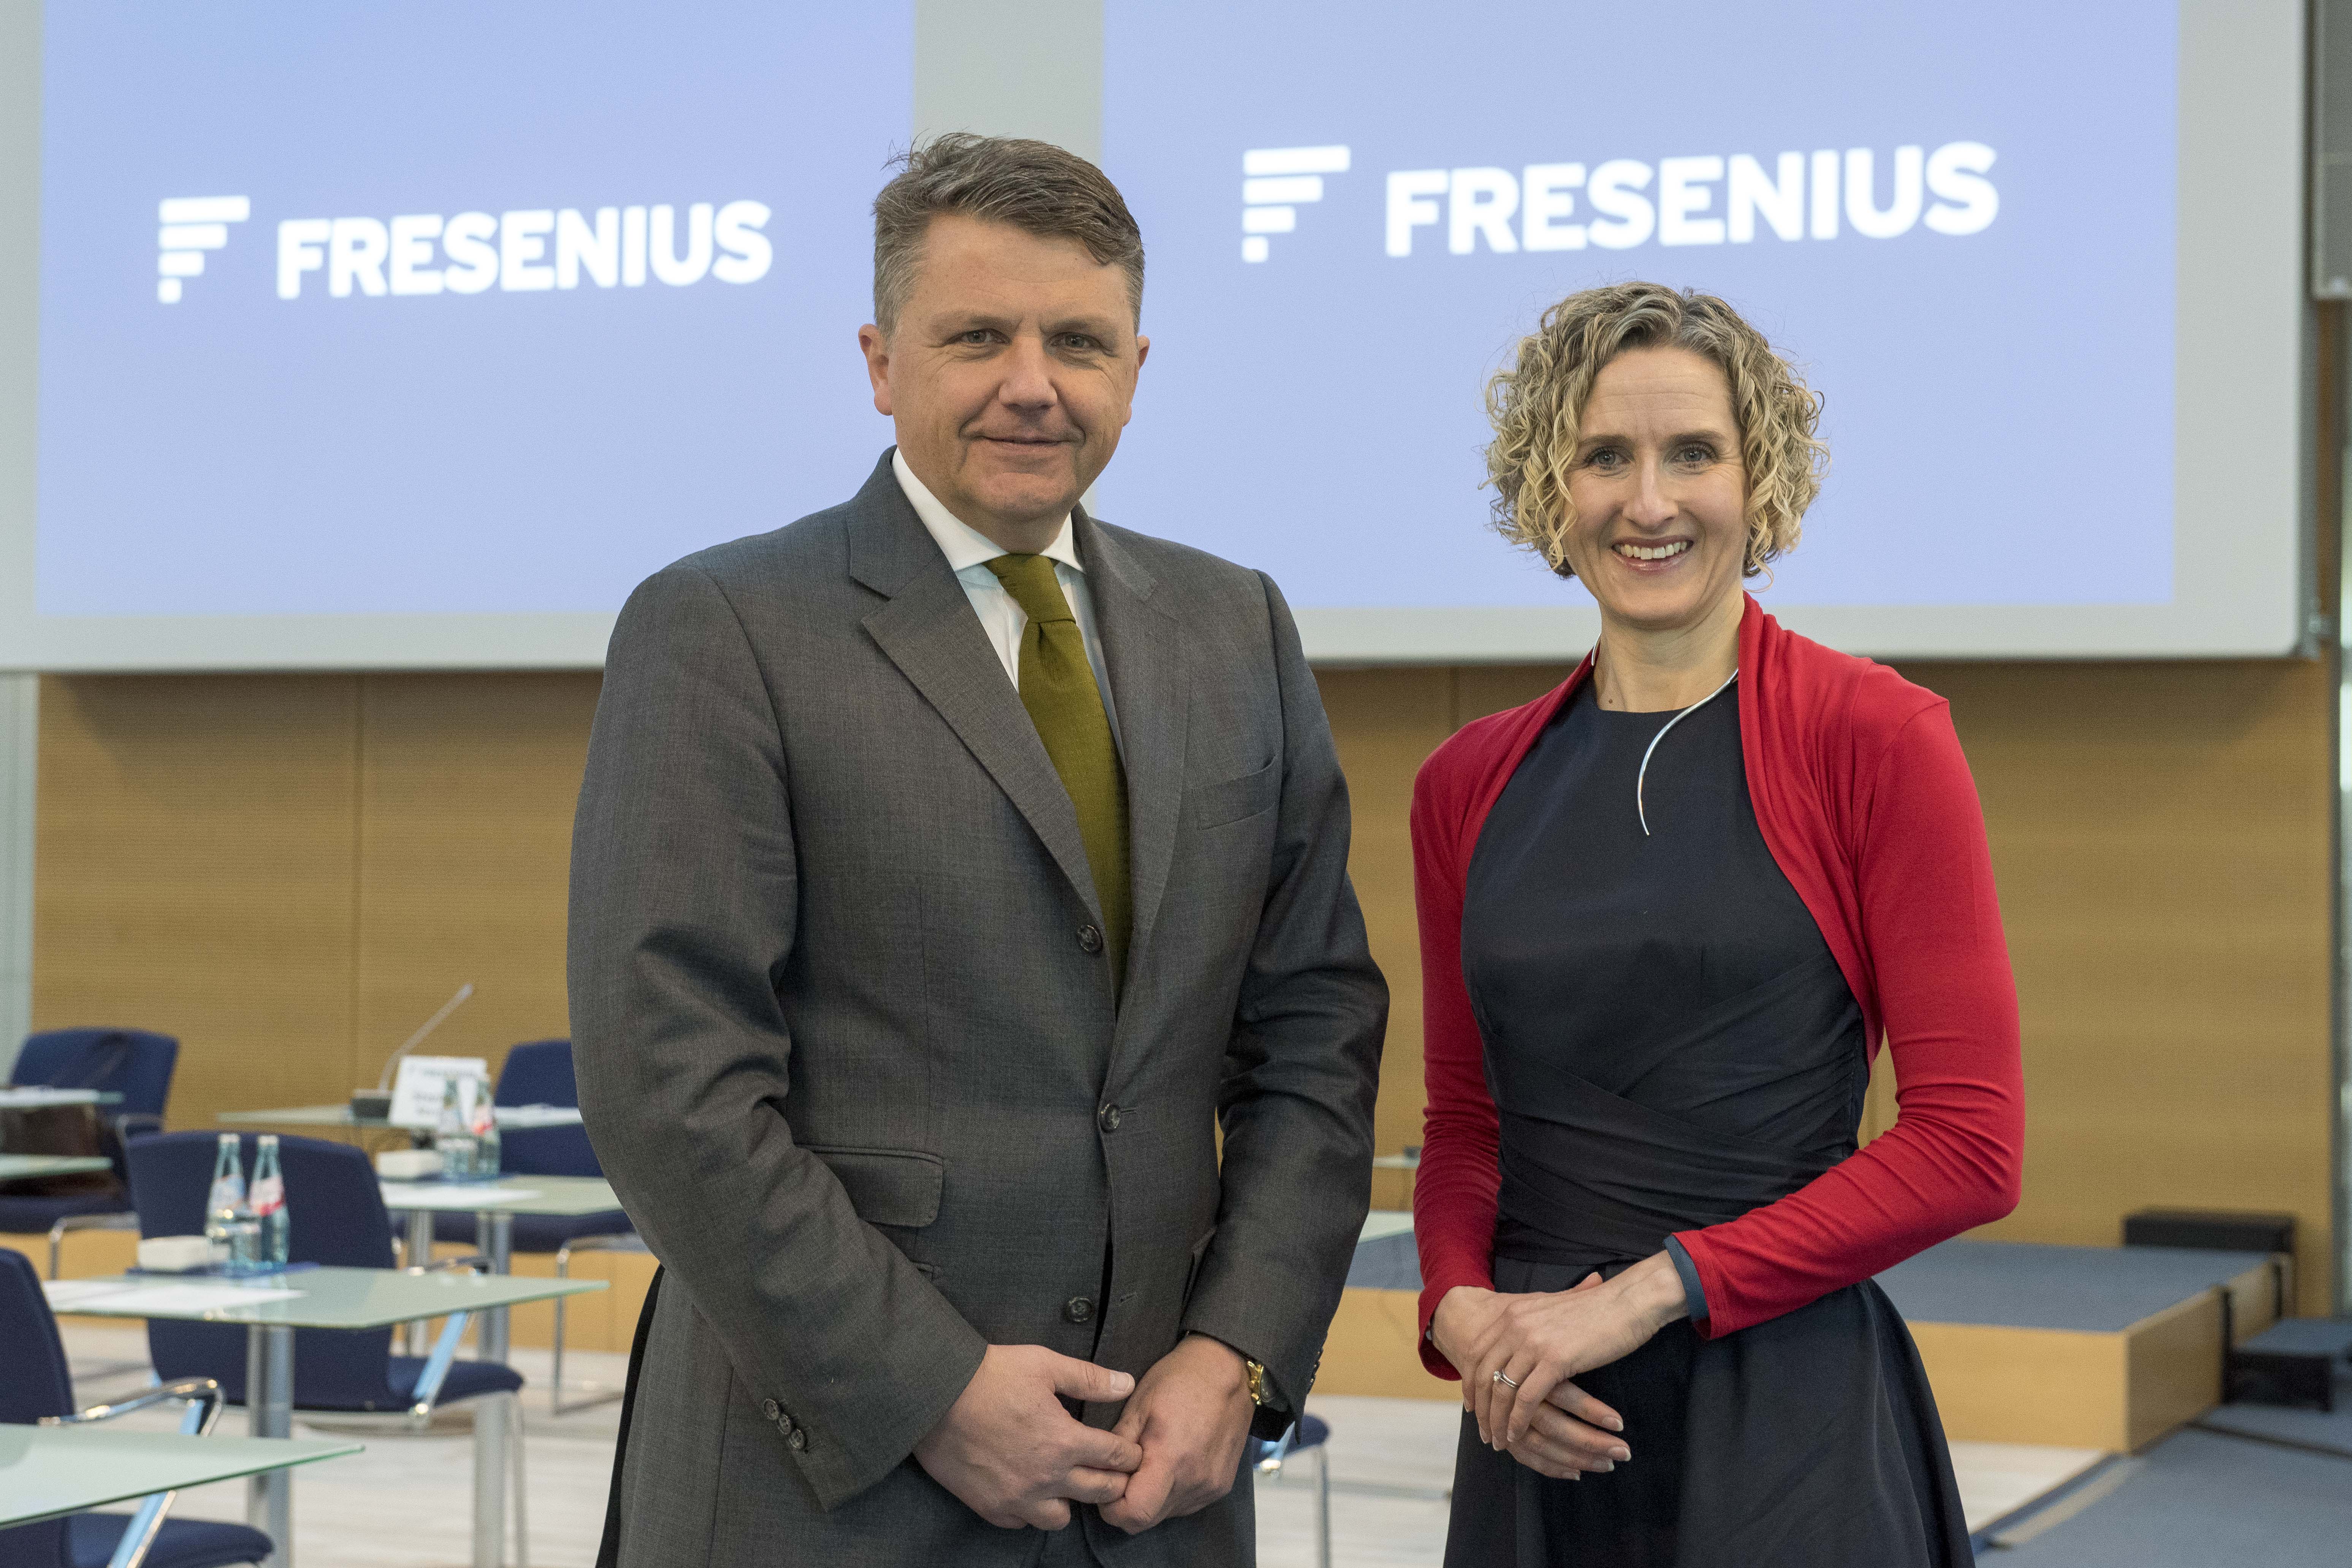
Stephan Sturm (left), CEO of Fresenius, and CFO Rachel Empey. Download Image (JPG 2.79 MB) -
![]()
Filling of glass bottles with liquid pharmaceuticals at the Fresenius Kabi plant in Melrose Park, USA. More press photos can be found in our media center. Download Image (JPG 271 KB) -
![]()
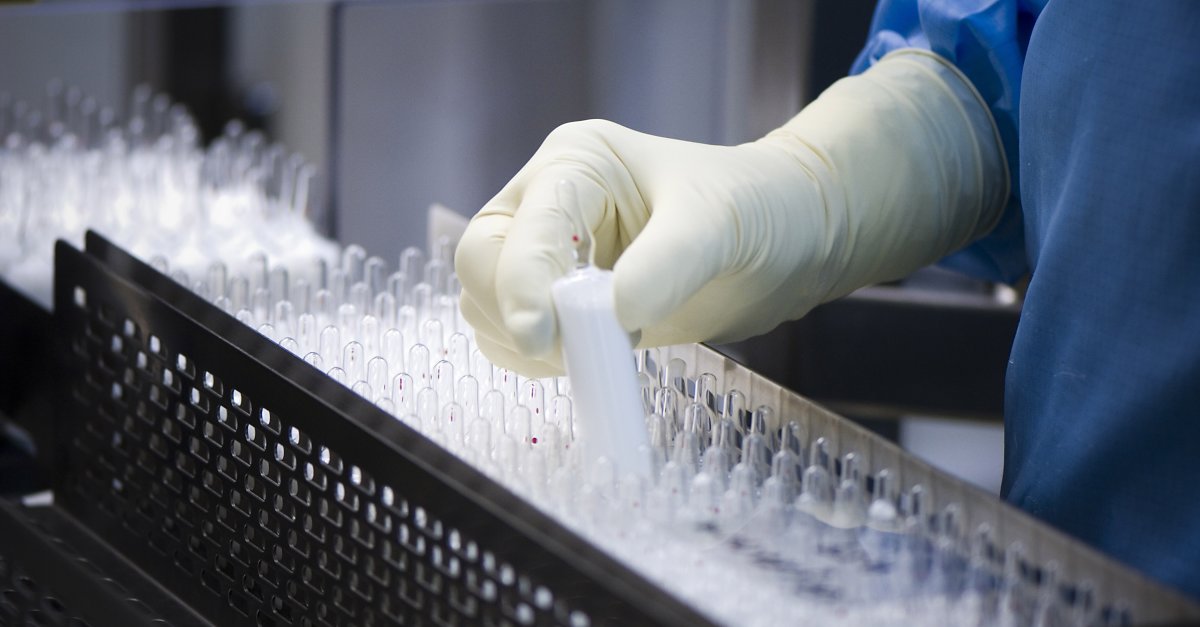
Filling of glass ampoules with liquid pharmaceuticals at the Fresenius Kabi plant in Graz, Austria. More press photos can be found in our media center. Download Image (JPG 83 KB) -
![]()
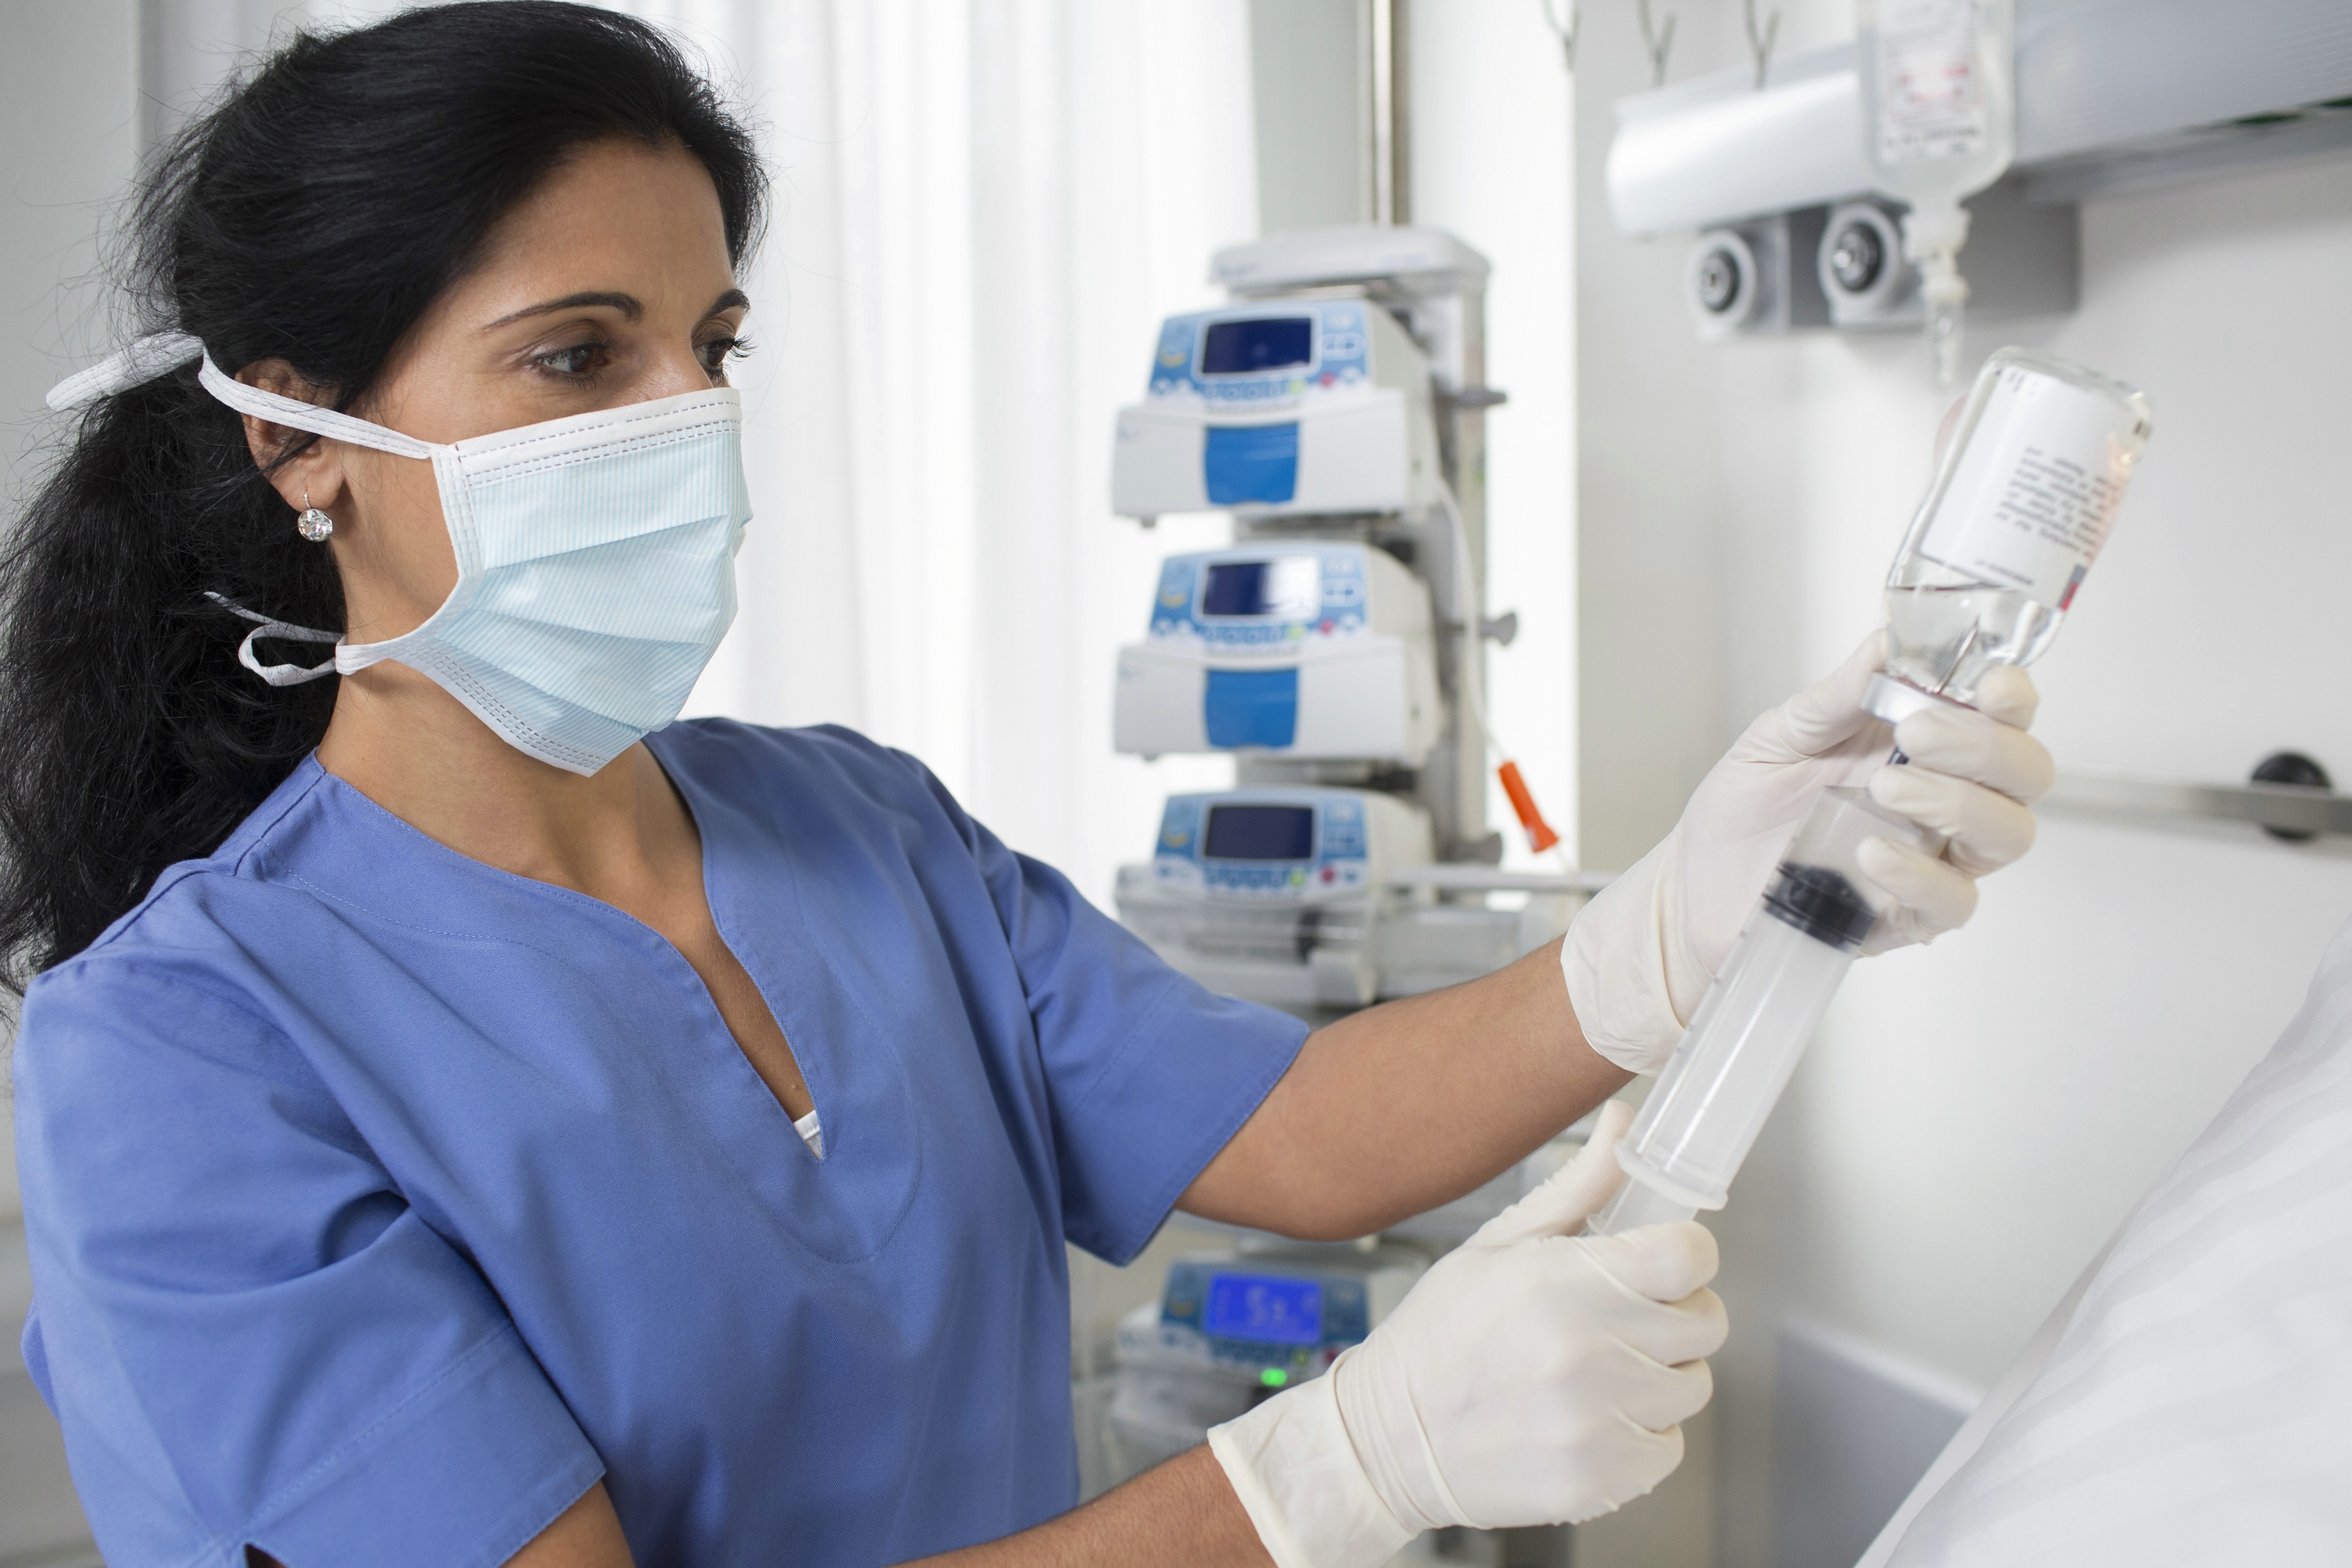
A nurse prepares an intravenously administered (I.V.) drug. Fresenius Kabi is a leading supplier of I.V. generic drugs. More press photos can be found in our media center. Download Image (V 1.95 MB) -
![]()
Operating room at a HELIOS clinic. More press photos can be found in our media center. Download Image (JPG 1.30 MB) -
![]()
Fresenius Medical Care: Production of dialyzers at St. Wendel. More press photos can be found in our media center. Download Image (_WENDEL 135 KB)


Company aims at strong growth in 2018 – Mid-term targets through 2020 confirmed – Growth initiatives for the next decade put in place
If no timeframe is specified, information refers to fiscal year 2017.
Fiscal year 2017:
- Sales €33.9 billion (+15%, +16% in constant currency)
- EBIT1 (adjusted) €4,890 million (+14%, +15% in constant currency)
- Net income2,3 (adjusted) €1,859 million (+19%, +21% in constant currency)
- Net income3 (before special items) €1,816 million (+16%, +18% in constant currency)
- Net income3 €1,814 million (+16%, +18% in constant currency)
- Dividend proposal €0.75 per share (+21%)
Q4/2017:
- Sales €8.7 billion (+11%, +17% in constant currency)
- EBIT1 (adjusted) €1,354 million (+9%, +14% in constant currency)
- Net income2,3 (adjusted) €520 million (+18%, +22% in constant currency)
- Net income3 (before special items) €487 million (+10%, +15% in constant currency)
- Net income3 €511 million (+16%, +21% in constant currency)
1 Before acquisition-related expenses, expenditures for further development of biosimilars business and FCPA provision
2 Consistent with scope of original guidance: before acquisition-related expenses, expenditures for further development of biosimilars business, book gain from U.S. tax reform and FCPA provision
3 Net income attributable to shareholders of Fresenius SE & Co. KGaA
Stephan Sturm, CEO of Fresenius, said: “At Fresenius, 2017 was a year of tremendous accomplishments. Our dedicated doctors and nurses treated 17 million patients in our hospitals – and helped bring over 70,000 babies into the world. Over 320,000 dialysis patients received more than 48 million life-saving treatments in our clinics. And healthcare systems benefited as we launched over 90 new generic – and therefore less expensive – drugs. All of this was achieved by the more than 270,000 people whom it was our privilege to employ last year. Our business results reflect our successful work for people. Record sales and earnings in 2017, along with the company’s strong guidance for this year and through 2020, show that our uncompromising focus on patients and quality also pays for our investors.”
Investigation into alleged breaches of FDA data integrity requirements at Akorn, Inc.
Fresenius is conducting an independent investigation, using external experts, into alleged breaches of FDA data integrity requirements relating to product development at Akorn, Inc. The Management and Supervisory Boards of Fresenius will assess the findings of that investigation. The consummation of the transaction may be affected if the closing conditions under the merger agreement are not met. Fresenius does not intend to provide further updates as the investigation proceeds. Fresenius continues to seek FTC clearance.
Strong Group guidance1 for 2018
For 2018, Fresenius projects sales growth2 of 5% to 8% in constant currency. Net income3,4 is expected to grow by 6% to 9% in constant currency. Excluding expenditures for the further development of the biosimilars business, net income3,5 is expected to grow by ~10% to 13% in constant currency.
Fresenius expects to further reduce its net debt/EBITDA6 ratio by year-end 2018.
Mid-term growth targets 2020 confirmed7
Based on the strong financial results 2017, Fresenius confirms the 2020 mid-term growth targets. Group sales are expected to grow with a compounded annual growth rate (CAGR) in the range of 7.1% to 10.3% (Mid-point: 8.7%). Group net income3 is projected to increase with a CAGR in the range of 8.3% to 12.6% (Mid-point: 10.5%).
25th consecutive dividend increase proposed
Based on the strong financial results, the Management Board will propose to the Supervisory Board a dividend increase of 21% to €0.75 per share (2016: €0.62). The expected dividend distribution to the shareholders of Fresenius SE & Co. KGaA is €416 million.
1 Excluding pending acquisitions of Akorn and NxStage
2 2017 adjusted for IFRS 15 (€486 million at Fresenius Medical Care)
3 Net income attributable to shareholders of Fresenius SE & Co. KGaA
4 Base 2017: €1,816 million; 2018 before special items (before acquisition-related expenses); including expenditures for further development of biosimilars business (€43 million after tax in FY/17 and ~€120 million after tax in FY/18)
5 Base 2017: €1,859 million; 2018 before special items (before acquisition-related expenses)
6 Calculated at expected annual average exchange rates, for both net debt and EBITDA; excluding pending acquisitions of Akorn and NxStage; excluding further potential acquisitions; at current IFRS rules
7 At February 2017 exchange rates and IFRS rules; including small and mid-size acquisitions
16% sales growth in constant currency
Group sales increased by 15% (16% in constant currency) to €33,886 million (2016: €29,471 million). Organic sales growth was 6%. Acquisitions contributed 10%. Negative currency translation effects (1%) were mainly driven by the devaluation of the US dollar and the Chinese yuan against the euro. In Q4/2017, Group sales increased by 11% (17% in constant currency) to €8,695 million (Q4/2016: €7,820 million). Organic sales growth was 6%. Acquisitions contributed 11%.
Group sales by region:


1 Calculated on the basis of contribution to consolidated sales
2 Including effects of agreement with the U.S. Departments of Veterans Affairs and Justice (VA agreement)
21% adjusted net income1,2 growth in constant currency
Group EBITDA3 increased by 14% (15% in constant currency) to €6,267 million (2016: €5,517 million). Adjusted Group EBIT4 increased by 14% (15% in constant currency) to €4,890 million (2016: €4,302 million). The adjusted EBIT margin4 was 14.4% (2016: 14.6%). In Q4/2017, adjusted Group EBIT4 increased by 9% (14% in constant currency) to €1,354 million (Q4/2016: €1,244 million), the adjusted EBIT margin4 was 15.6% (Q4/2016: 15.9%). Group EBIT3 before special items increased by 12% (14% in constant currency) to €4,830 million (2016: €4,302 million). The EBIT margin3 was 14.3% (2016: 14.6%). In Q4/2017, Group EBIT3 increased by 5% (11% in constant currency) to €1,308 million (Q4/2016: €1,244 million), the EBIT margin3 was 15.0% (Q4/2016: 15.9%).
Group net interest3 reached -€636 million (2016: -€582 million). The increase is mainly driven by the financing of the Quirónsalud acquisition, partly offset by positive effects from refinancing activities.
The Group tax rate before special items was 28.2% (2016: 28.1%). The U.S. tax reform, which went into effect on January 1, 2018, triggered a revaluation of deferred tax liabilities. This resulted in a one-time book gain of €103 million in 2017. Accordingly, the group tax rate after special items decreased to 23.0%.
Noncontrolling interest3 was €1,194 million (2016: €1,116 million), of which 95% was attributable to the noncontrolling interest in Fresenius Medical Care.
Adjusted Group net income1,2 increased by 19% (21% in constant currency) to €1,859 million (2016: €1,560 million). Adjusted earnings per share1,2 increased by 18% (19% in constant currency) to €3.35 (2016: €2.85). In Q4/2017, adjusted Group net income1,2 increased by 18% (22% in constant currency) to €520 million (Q4/2016: €442 million). Adjusted earnings per share1,2 increased by 16% (20% in constant currency) to €0.93 (Q4/2016: €0.81).
1 Net income attributable to shareholders of Fresenius SE & Co. KGaA
2 Consistent with scope of original guidance: before acquisition-related expenses, expenditures for further development of biosimilars business, book gain from U.S. tax reform and FCPA provision
3 Before special items
4 Consistent with scope of original guidance: before acquisition-related expenses, expenditures for further development of biosimilars business and FCPA provision
For a detailed overview of special items and adjustments please see the reconciliation tables on pages 18-19 in the pdf document.
Group net income before special items1 increased by 16% (18% in constant currency) to €1,816 million (2016: €1,560 million). Earnings per share1,2 increased by 15% (16% in constant currency) to €3.28 (2016: €2.85). In Q4/2017, Group net income1,2 increased by 10% (15% in constant currency) to €487 million (Q4/2016: €442 million). Earnings per share1,2 increased by 9% (13% in constant currency) to €0.88 (Q4/2016: €0.81).
Group net income1 increased by 16% (18% in constant currency) to €1,814 million
(2016: €1,560 million). Earnings per share1 increased by 15% (16% in constant currency) to €3.27 (2016: €2.85). In Q4/2017, Group net income1 increased by 16% (21% in constant currency) to €511 million (Q4/2016: €442 million). Earnings per share1 increased by 14% (19% in constant currency) to €0.92 (Q4/2016: €0.81).
Continued investment in growth
Spending on property, plant and equipment was €1,828 million (2016: €1,633 million), primarily for the modernization and expansion of dialysis clinics, production facilities as well as hospitals and day clinics. This corresponds to 5.4% of sales.
Total acquisition spending of €6,852 million (2016: €926 million) was mainly related to the acquisitions of Quirónsalud and Merck KGaA’s biosimilars business.
Excellent cash flow development
Operating cash flow increased by 10% to €3,937 million (2016: €3,585 million) with a margin of 11.6% (2016: 12.2%). The excellent cash flow was driven by Fresenius Medical Care and a record cash flow at Fresenius Kabi.
Free cash flow before acquisitions and dividends increased by 13% to €2,232 million (2016: €1,969 million), with a margin of 6.6% (2016: 6.7%). Free cash flow after acquisitions and dividends was €-4,557 million (2016: €746 million) reflecting the acquisitions of Quirónsalud and Merck KGaA’s biosimilars business.
1 Net income attributable to shareholders of Fresenius SE & Co. KGaA
2 Before special items
Solid balance sheet structure
The Group’s total assets increased by 14% (21% in constant currency) to €53,133 million (Dec. 31, 2016: €46,697 million), driven primarily by the acquisition of Quirónsalud. Current assets grew by 7% (15% in constant currency) to €12,604 million (Dec. 31, 2016: €11,744 million). Non-current assets increased by 16% (23% in constant currency) to €40,529 million (Dec. 31, 2016: € 34,953 million).
Total shareholders’ equity increased by 4% (14% in constant currency) to €21,720 million (Dec. 31, 2016: €20,849 million). The equity ratio decreased to 40.9% (Dec. 31, 2016: 44.6%).
Group debt increased by 29% (35% in constant currency) to €19,042 million (Dec. 31, 2016: € 14,780 million), mainly driven by the acquisition financing of Quirónsalud. Group net debt increased by 32% (37% in constant currency) to € 17,406 million (Dec. 31, 2016: € 13,201 million.
As of December 31, 2017, the net debt/EBITDA ratio was 2.841,2 (September 30, 2017: 2.971,2; December 31, 2016: 2.331; pro forma Quirónsalud 3.091).
1 At LTM average exchange rates for both net debt and EBITDA; pro forma acquisitions
2 Before special items
Increased number of employees
As of December 31, 2017, the number of employees increased by 17% to 273,249 (Dec. 31, 2016: 232,873).
Business Segments
Fresenius Medical Care
Fresenius Medical Care is the world's largest provider of products and services for individuals with renal diseases. As of December 31, 2017, Fresenius Medical Care was treating 320,960 patients in 3,752 dialysis clinics. Along with its core business, the company focuses on expanding the range of medical services in the field of Care Coordination.

- 9% sales growth in constant currency, 7% adjusted net income growth in constant currency3,4
- 13% operating cash flow growth
- 2018 outlook: ~8% sales growth5 in constant currency and 13 to 15% net income growth3,6 in constant currency expected
Sales1 increased by 7% (9% in constant currency) to €17,784 million (2016: €16,570 million). Organic sales growth was 7%. Acquisitions and divestitures increased sales by net 2%. Currency translation effects reduced sales by 2%. In Q4/2017, sales of €4,429 million (Q4/2016: €4,417 million) were on the prior-year level (increased by 8% in constant currency).
Health Care services sales (dialysis services and care coordination) increased by 8% (10% in constant currency) to €14,532 million (2016: €13,505 million). Dialysis product sales increased by 6% (7% in constant currency) to €3,252 million (2016: €3,064 million).
In North America, sales increased by 7% to €12,879 million (2016: €12,030 million). Health Care services sales grew by 7% to €12,036 million (2016: €11,214 million). Dialysis product sales increased by 3% to €843 million (2016: €816 million).
Sales outside North America increased by 8% (9% in constant currency) to €4,890 million (2016: €4,527 million). Health Care services sales increased by 9% (11% in constant currency) to €2,496 million (2016: €2,292 million). Dialysis product sales increased by 6% (7% in constant currency) to €2,315 million (2016: €2,185 million).
1Excluding agreement with the United States Depatment of Veterans Affairs and Justice (VA agreement): €17,689 million
2Before natural disaster costs, VA agreement and FCPA provision
3Net income attributable to shareholders of Fresenius Medical Care AG & Co. KGaA
4Before book gain from U.S. tax reform, natural disaster costs, VA agreement and FCPA provision
5Reported sales 2017 of €17,784 million, adjusted for IFRS 15 (€486 million)
6Base 2017: €1,280 million; 2018 including recurring benefits from U.S. tax reform of €140 million to €160 million
EBIT decreased by -2% (0% in constant currency) to €2,362 million (2016: €2,409 million). Adjusted EBIT1 increased by 4% (5% in constant currency) to €2,493 million (2016: €2,409 million), mainly due to the strong business performance in North America and in Asia-Pacific. The adjusted EBIT1 margin was 14.1% (2016: 14.5%). In Q4/2017, EBIT decreased by -29% (-22% in constant currency) to €519 million (2016: €730 million). In Q4/2017, adjusted EBIT1 of €726 million (Q4/2016: €730 million) was slighty below the prior-year level (increased by 6% in constant currency). The adjusted EBIT margin1 was 16.4% (Q4/2016: 16.5%).
Net income2 increased by 12% (14% in constant currency) to €1,280 million (2016: €1,144 million). Consistent with the original scope of guidance, i.e. excluding the effects of the VA agreement, natural disaster costs, the book gain from the US tax reform and the FCPA provision, net income2 increased by 7% in constant currency. In Q4/2017, net income2 increased by 8% (increased 16% in constant currency) to €394 million (Q4/2016: €363 million). Excluding the effects of the VA agreement, natural disaster costs, the book gain from the US tax reform and the FCPA provision, net income2 increased by 6% in constant currency.
Operating cash flow increased by 13% to €2,192 million (2016: €1,932 million). The cash flow margin was 12.3% (2016: 11.7%).
For 2018, Fresenius Medical Care expects sales to grow by ~8%3 in constant currency. The 2018 guidance is based on 2017 sales adjusted for the effect of the IFRS 15 implementation. Net income2 is expected to increase by 13% to 15%4 in constant currency in 2018, including recurring benefits from U.S tax reform of €140 million to €160 million.
1Before natural disaster costs, effects of VA agreement and FCPA provision
2Net income attributable to shareholders of Fresenius Medical Care AG & Co. KGaA
3Reported sales 2017 of €17,784 million, adjusted for effect from IFRS 15 (€486 million)
4Base 2017: €1,280 million
For further information, please see Fresenius Medical Care’s Press Release at www.freseniusmedicalcare.com.
Fresenius Kabi
Fresenius Kabi offers intravenously administered generic drugs, clinical nutrition and infusion therapies for seriously and chronically ill patients in the hospital and outpatient environments. The company is also a leading supplier of medical devices and transfusion technology products. In the biosimilars business, we are developing products with a focus on oncology and autoimmune diseases.


- 7% organic sales growth, 8% EBIT2 growth in constant currency
- Operating cash flow at all-time high
- 2018 outlook: 4% to 7% organic sales growth and -3% to -6% EBIT growth5 in constant currency expected (~2% to 5%6 excl. biosimilars expenses)
1Before special items
2Consistent with scope of original guidance: before acquisition-related expenses and expenditures for further development of biosimilars business
3Net income attributable to shareholders of Fresenius SE & Co. KGaA
4Consistent with scope of original guidance: before acquisition-related expenses, expenditures for further development of biosimilars business and book gain from U.S. tax reform
5Base 2017: €1,177 million; 2018 before special items (before acquisition-related expenses), including expenditures for further development of biosimilars business (€60 million in FY/17 and expected expenditures of ~€160 million in FY/18)
6Base: 2017: €1,237 million; 2018 before special items (before acquisition-related expenses)
Sales increased by 6% (7% in constant currency) to €6,358 million (2016: €6,007 million). Organic sales growth was 7%. Negative currency translation effects (-1%) were mainly related to the devaluation of the US dollar and the Chinese yuan against the Euro. In Q4/2017, sales increased by 3% (8% in constant currency) to €1,594 million (Q4/2016: €1,550 million). Organic sales growth was 8%.
Sales in Europe grew by 4% (organic growth: 5%) to €2,214 million (2016: €2,135 million). In Q4/2017, sales increased by 2% (3% organic) to €579 million (Q4/2016: €566 million).
Sales in North America increased by 6% (8% organic) to €2,290 million (2016: €2,170 million). In Q4/2017, sales increased by 2% (11% organic) to €554 million (Q4/2016: €542 million).
Sales in Asia-Pacific increased by 8% (11% organic) to €1,196 million (2016: €1,108 million). In Q4/2017, sales increased by 5% (11% organic) to €302 million (Q4/2016: €287 million). Sales in Latin America/Africa increased by 11% (10% organic) to €658 million (2016: €594 million). In Q4/2017, sales increased by 3% (10% organic) to €159 million (Q4/2016: €155 million).
Adjusted EBIT1 increased by 6% (8% in constant currency) to €1,237 million (2016: €1,171 million). The adjusted EBIT margin1 was 19.5% (2016: 19.5%). In Q4/2017, adjusted EBIT1 increased by 3% (9% in constant currency) to €318 million (Q4/2016: €308 million). The adjusted EBIT margin1 was 19.9% (Q4/2016: 19.9%).
EBIT before special items increased by 1% (3% in constant currency) to €1,177 million (2016: €1,171 million). The EBIT margin before special items was 18.5% (2016: 19.5%). In Q4/2017, EBIT before special items decreased by -12% ( 6% in constant currency) to €272 million (Q4/2016: €308 million). The EBIT margin before special items decreased to 17.1% (Q4/2016: 19.9%) due to expenditures for the further development of biosimilars business.
Adjusted net income2,3 increased by 10% (13% in constant currency) to €745 million (2016: €675 million). In Q4/2017, adjusted net income2,3 increased by 4% (10% in constant currency) to €191 million (Q4/2016: €184 million).
Operating cash flow reached an all-time high of €1,010 million (2016: €1,004 million). The cash flow margin was 15.9% (2016: 16.7%).
For 2018, Fresenius Kabi expects organic sales growth of 4% to 7% and EBIT growth in constant currency of -3% to -6%4. Excluding expenditures for the further development of the biosimilars business EBIT is expected to grow by ~2% to 5%5 in constant currency.
1Consistent with scope of original guidance: before acquisition-related expenses and expenditures for further development of biosimilars business
2Net income attributable to shareholders of Fresenius SE & Co. KGaA
3Consistent with scope of original guidance: before acquisition-related expenses, expenditures for further development of biosimilars business and book gain from U.S. tax reform
4Base 2017: €1,177 million; 2018 before special items (before acquisition-related expenses), including expenditures for further development of biosimilars business (€60 million in FY/17 and expected expenditures of ~€160 million in FY/18)
5Base: 2017: €1,237 million; 2018 before special items (before acquisition-related expenses)
Fresenius Helios
Fresenius Helios is Europe's leading private hospital operator. The company comprises Helios Germany and Helios Spain (Quirónsalud). Helios Germany operates 111 hospitals, thereof 88 acute care clinics and 23 post-acute care clinics, and treats more than 5.3 million patients annually. Quirónsalud operates 45 hospitals, 55 outpatient centers and around 300 occupational risk prevention centers, and treats approximately 11.6 million patients per year.


- 4% organic sales growth
- 54% EBIT increase (6% excluding Quirónsalud)
- 2018 outlook: 3% to 6% organic sales growth and EBIT growth of 7% to 10% expected
Fresenius Helios increased sales by 48% to €8,668 million (2016: €5,843 million). Organic sales growth was 4%. Acquisitions, mainly Quirónsalud, increased sales by 44%. In Q4/2017, sales increased by 54% to €2,246 million (Q4/2016: €1,461 million), organic sales growth was 3%.
Sales of Helios Germany increased by 4% (4% organic) to €6,074 million (2016: €5,843 million). In Q4/2017, sales increased by 3% (3% organic) to €1,512 million (Q4/2016: €1,461 million). Helios Spain (Quirónsalud) has been consolidated since February 1, 2017 and generated sales of €2,594 million (thereof €734 million in Q4/2017).
Fresenius Helios grew EBIT by 54% to €1,052 million (2016: €683 million). The EBIT margin increased to 12.1% (2016: 11.7%). In Q4/2017, EBIT increased by 61% to €283 million (Q4/2016: €176 million). The EBIT margin increased to 12.6% (Q4/2016: 12.0%).
EBIT of Helios Germany increased by 6% to €725 million (2016: €683 million) with a margin of 11.9% (2016: 11.7%). In Q4/2017, EBIT of Helios Germany was on the prior-year level with €176 million (Q4/2016: €176 million). The margin was 11.6% (2016: 12.0%).
EBIT of Helios Spain was €327 million (thereof €107 million in Q4/2017) with a margin of 12.6% (Q4/2017: 14.6%).
Net income1 increased by 34% to €728 million (2016: €544 million). In Q4/2017, net income1 increased by 42% to €202 million (Q4/2016: €142 million).
Operating cash flow increased by 18% to €733 million (2016: €622 million) driven by the first-time consolidation of Quirónsalud and an excellent operating result. The margin was 8.5% (2016: 10.6%).
For 2018, Fresenius Helios expects organic sales growth of 3% to 6% and EBIT growth of 7% to 10%.
1Net income attributable to shareholders of Fresenius SE & Co. KGaA
Fresenius Vamed
Fresenius Vamed manages projects and provides services for hospitals and other health care facilities worldwide. The portfolio ranges along the entire value chain: from project development, planning, and turnkey construction, via maintenance and technical management, to total operational management.


- 6% organic sales growth, 10% EBIT growth
- Order intake of €1,096 million at all-time high
- 2018 outlook: 5% to 10% organic sales growth and 5% to 10% EBIT growth expected
Sales increased by 6% (6% in constant currency) to €1,228 million (2016: €1,160 million). Organic sales growth was 6%. Sales in the project business increased by 2% to €606 million (2016: €594 million). Sales in the service business grew by 10% to €622 million (2016: €566 million). In Q4/2017, sales increased by 14% to €480 million (Q4/2016: €420 million). Organic sales growth was 14%.
EBIT grew by 10% to €76 million (2016: €69 million). The EBIT margin increased to 6.2% (2016: 5.9%). In Q4/2017, EBIT increased by 16% to €44 million (Q4/2016: €38 million). The EBIT margin increased to 9.2% (2016: 9.0%).
Net income1 grew by 11% to €50 million (2016: €45 million). In Q4/2017, net income1 increased by 21% to €29 million (Q4/2016: €24 million).
Order intake increased to €1,096 million (2016: €1,017 million), reaching an all-time high. As of December 31, 2017, order backlog was €2,147 million (Dec. 31, 2016: €1,961 million).
For 2018, Fresenius Vamed expects organic sales growth in the range of 5% to 10% and EBIT growth of 5% to 10%.
1Net income attributable to shareholders of VAMED AG
Press Conference
As part of the publication of the results for fiscal year 2017, a press conference will be held on February 27, 2018 at 10 a.m. CET. You are cordially invited to follow the press conference in a live broadcast over the Internet at www.fresenius.com/media-calendar. Following the press conference, a replay will be available on our website.
For additional information on the performance indicators used please refer to our website www.fresenius.com/alternative-performance-measures.
For a detailed overview of special items and adjustments, please see the reconciliation tables in the pdf file on page 18-19.
This release contains forward-looking statements that are subject to various risks and uncertainties. Future results could differ materially from those described in these forward-looking statements due to certain factors, e.g. changes in business, economic and competitive conditions, regulatory reforms, results of clinical trials, foreign exchange rate fluctuations, uncertainties in litigation or investigative proceedings, and the availability of financing. Fresenius does not undertake any responsibility to update the forward-looking statements in this release.
If no timeframe is specified, information refers to fiscal year 2017.
Fiscal year 2017:
- Sales €33.9 billion (+15%, +16% in constant currency)
- EBIT1 (adjusted) €4,890 million (+14%, +15% in constant currency)
- Net income2,3 (adjusted) €1,859 million (+19%, +21% in constant currency)
- Net income3 (before special items) €1,816 million (+16%, +18% in constant currency)
- Net income3 €1,814 million (+16%, +18% in constant currency)
- Dividend proposal €0.75 per share (+21%)
Q4/2017:
- Sales €8.7 billion (+11%, +17% in constant currency)
- EBIT1 (adjusted) €1,354 million (+9%, +14% in constant currency)
- Net income2,3 (adjusted) €520 million (+18%, +22% in constant currency)
- Net income3 (before special items) €487 million (+10%, +15% in constant currency)
- Net income3 €511 million (+16%, +21% in constant currency)
1 Before acquisition-related expenses, expenditures for further development of biosimilars business and FCPA provision2 Consistent with scope of original guidance: before acquisition-related expenses, expenditures for further development of biosimilars business, book gain from U.S. tax reform and FCPA provision3 Net income attributable to shareholders of Fresenius SE & Co. KGaA
Investigation into alleged breaches of FDA data integrity requirements at Akorn, Inc.
Fresenius is conducting an independent investigation, using external experts, into alleged breaches of FDA data integrity requirements relating to product development at Akorn, Inc. The Management and Supervisory Boards of Fresenius will assess the findings of that investigation. The consummation of the transaction may be affected if the closing conditions under the merger agreement are not met. Fresenius does not intend to provide further updates as the investigation proceeds. Fresenius continues to seek FTC clearance.
Strong Group guidance1 for 2018
For 2018, Fresenius projects sales growth2 of 5% to 8% in constant currency. Net income3,4 is expected to grow by 6% to 9% in constant currency. Excluding expenditures for the further development of the biosimilars business, net income3,5 is expected to grow by ~10% to 13% in constant currency.
Fresenius expects to further reduce its net debt/EBITDA6 ratio by year-end 2018.
Mid-term growth targets 2020 confirmed7
Based on the strong financial results 2017, Fresenius confirms the 2020 mid-term growth targets. Group sales are expected to grow with a compounded annual growth rate (CAGR) in the range of 7.1% to 10.3% (Mid-point: 8.7%). Group net income3 is projected to increase with a CAGR in the range of 8.3% to 12.6% (Mid-point: 10.5%).
25th consecutive dividend increase proposed
Based on the strong financial results, the Management Board will propose to the Supervisory Board a dividend increase of 21% to €0.75 per share (2016: €0.62). The expected dividend distribution to the shareholders of Fresenius SE & Co. KGaA is €416 million.
1 Excluding pending acquisitions of Akorn and NxStage2 2017 adjusted for IFRS 15 (€486 million at Fresenius Medical Care)3 Net income attributable to shareholders of Fresenius SE & Co. KGaA4 Base 2017: €1,816 million; 2018 before special items (before acquisition-related expenses); including expenditures for further development of biosimilars business (€43 million after tax in FY/17 and ~€120 million after tax in FY/18)5 Base 2017: €1,859 million; 2018 before special items (before acquisition-related expenses)6 Calculated at expected annual average exchange rates, for both net debt and EBITDA; excluding pending acquisitions of Akorn and NxStage; excluding further potential acquisitions; at current IFRS rules7 At February 2017 exchange rates and IFRS rules; including small and mid-size acquisitions
16% sales growth in constant currency
Group sales increased by 15% (16% in constant currency) to €33,886 million (2016: €29,471 million). Organic sales growth was 6%. Acquisitions contributed 10%. Negative currency translation effects (1%) were mainly driven by the devaluation of the US dollar and the Chinese yuan against the euro. In Q4/2017, Group sales increased by 11% (17% in constant currency) to €8,695 million (Q4/2016: €7,820 million). Organic sales growth was 6%. Acquisitions contributed 11%.
Group sales by region:

1 Calculated on the basis of contribution to consolidated sales2 Including effects of agreement with the U.S. Departments of Veterans Affairs and Justice (VA agreement)
21% adjusted net income1,2 growth in constant currency
Group EBITDA3 increased by 14% (15% in constant currency) to €6,267 million (2016: €5,517 million). Adjusted Group EBIT4 increased by 14% (15% in constant currency) to €4,890 million (2016: €4,302 million). The adjusted EBIT margin4 was 14.4% (2016: 14.6%). In Q4/2017, adjusted Group EBIT4 increased by 9% (14% in constant currency) to €1,354 million (Q4/2016: €1,244 million), the adjusted EBIT margin4 was 15.6% (Q4/2016: 15.9%). Group EBIT3 before special items increased by 12% (14% in constant currency) to €4,830 million (2016: €4,302 million). The EBIT margin3 was 14.3% (2016: 14.6%). In Q4/2017, Group EBIT3 increased by 5% (11% in constant currency) to €1,308 million (Q4/2016: €1,244 million), the EBIT margin3 was 15.0% (Q4/2016: 15.9%).
Group net interest3 reached -€636 million (2016: -€582 million). The increase is mainly driven by the financing of the Quirónsalud acquisition, partly offset by positive effects from refinancing activities.
The Group tax rate before special items was 28.2% (2016: 28.1%). The U.S. tax reform, which went into effect on January 1, 2018, triggered a revaluation of deferred tax liabilities. This resulted in a one-time book gain of €103 million in 2017. Accordingly, the group tax rate after special items decreased to 23.0%.
Noncontrolling interest3 was €1,194 million (2016: €1,116 million), of which 95% was attributable to the noncontrolling interest in Fresenius Medical Care.
Adjusted Group net income1,2 increased by 19% (21% in constant currency) to €1,859 million (2016: €1,560 million). Adjusted earnings per share1,2 increased by 18% (19% in constant currency) to €3.35 (2016: €2.85). In Q4/2017, adjusted Group net income1,2 increased by 18% (22% in constant currency) to €520 million (Q4/2016: €442 million). Adjusted earnings per share1,2 increased by 16% (20% in constant currency) to €0.93 (Q4/2016: €0.81).
1 Net income attributable to shareholders of Fresenius SE & Co. KGaA2 Consistent with scope of original guidance: before acquisition-related expenses, expenditures for further development of biosimilars business, book gain from U.S. tax reform and FCPA provision3 Before special items4 Consistent with scope of original guidance: before acquisition-related expenses, expenditures for further development of biosimilars business and FCPA provision
For a detailed overview of special items and adjustments please see the reconciliation tables on pages 18-19 in the pdf document.
Group net income before special items1 increased by 16% (18% in constant currency) to €1,816 million (2016: €1,560 million). Earnings per share1,2 increased by 15% (16% in constant currency) to €3.28 (2016: €2.85). In Q4/2017, Group net income1,2 increased by 10% (15% in constant currency) to €487 million (Q4/2016: €442 million). Earnings per share1,2 increased by 9% (13% in constant currency) to €0.88 (Q4/2016: €0.81).
Group net income1 increased by 16% (18% in constant currency) to €1,814 million
(2016: €1,560 million). Earnings per share1 increased by 15% (16% in constant currency) to €3.27 (2016: €2.85). In Q4/2017, Group net income1 increased by 16% (21% in constant currency) to €511 million (Q4/2016: €442 million). Earnings per share1 increased by 14% (19% in constant currency) to €0.92 (Q4/2016: €0.81).
Continued investment in growth
Spending on property, plant and equipment was €1,828 million (2016: €1,633 million), primarily for the modernization and expansion of dialysis clinics, production facilities as well as hospitals and day clinics. This corresponds to 5.4% of sales.
Total acquisition spending of €6,852 million (2016: €926 million) was mainly related to the acquisitions of Quirónsalud and Merck KGaA’s biosimilars business.
Excellent cash flow development
Operating cash flow increased by 10% to €3,937 million (2016: €3,585 million) with a margin of 11.6% (2016: 12.2%). The excellent cash flow was driven by Fresenius Medical Care and a record cash flow at Fresenius Kabi.
Free cash flow before acquisitions and dividends increased by 13% to €2,232 million (2016: €1,969 million), with a margin of 6.6% (2016: 6.7%). Free cash flow after acquisitions and dividends was €-4,557 million (2016: €746 million) reflecting the acquisitions of Quirónsalud and Merck KGaA’s biosimilars business.
1 Net income attributable to shareholders of Fresenius SE & Co. KGaA2 Before special items
Solid balance sheet structure
The Group’s total assets increased by 14% (21% in constant currency) to €53,133 million (Dec. 31, 2016: €46,697 million), driven primarily by the acquisition of Quirónsalud. Current assets grew by 7% (15% in constant currency) to €12,604 million (Dec. 31, 2016: €11,744 million). Non-current assets increased by 16% (23% in constant currency) to €40,529 million (Dec. 31, 2016: € 34,953 million).
Total shareholders’ equity increased by 4% (14% in constant currency) to €21,720 million (Dec. 31, 2016: €20,849 million). The equity ratio decreased to 40.9% (Dec. 31, 2016: 44.6%).
Group debt increased by 29% (35% in constant currency) to €19,042 million (Dec. 31, 2016: € 14,780 million), mainly driven by the acquisition financing of Quirónsalud. Group net debt increased by 32% (37% in constant currency) to € 17,406 million (Dec. 31, 2016: € 13,201 million.
As of December 31, 2017, the net debt/EBITDA ratio was 2.841,2 (September 30, 2017: 2.971,2; December 31, 2016: 2.331; pro forma Quirónsalud 3.091).
1 At LTM average exchange rates for both net debt and EBITDA; pro forma acquisitions2 Before special items
Business Segments
Fresenius Medical Care
Fresenius Medical Care is the world's largest provider of products and services for individuals with renal diseases. As of December 31, 2017, Fresenius Medical Care was treating 320,960 patients in 3,752 dialysis clinics. Along with its core business, the company focuses on expanding the range of medical services in the field of Care Coordination.

- 9% sales growth in constant currency, 7% adjusted net income growth in constant currency3,4
- 13% operating cash flow growth
- 2018 outlook: ~8% sales growth5 in constant currency and 13 to 15% net income growth3,6 in constant currency expected
Sales1 increased by 7% (9% in constant currency) to €17,784 million (2016: €16,570 million). Organic sales growth was 7%. Acquisitions and divestitures increased sales by net 2%. Currency translation effects reduced sales by 2%. In Q4/2017, sales of €4,429 million (Q4/2016: €4,417 million) were on the prior-year level (increased by 8% in constant currency).
Health Care services sales (dialysis services and care coordination) increased by 8% (10% in constant currency) to €14,532 million (2016: €13,505 million). Dialysis product sales increased by 6% (7% in constant currency) to €3,252 million (2016: €3,064 million).
In North America, sales increased by 7% to €12,879 million (2016: €12,030 million). Health Care services sales grew by 7% to €12,036 million (2016: €11,214 million). Dialysis product sales increased by 3% to €843 million (2016: €816 million).
Sales outside North America increased by 8% (9% in constant currency) to €4,890 million (2016: €4,527 million). Health Care services sales increased by 9% (11% in constant currency) to €2,496 million (2016: €2,292 million). Dialysis product sales increased by 6% (7% in constant currency) to €2,315 million (2016: €2,185 million).
1 Excluding agreement with the United States Depatment of Veterans Affairs and Justice (VA agreement): €17,689 million2 Before natural disaster costs, VA agreement and FCPA provision3 Net income attributable to shareholders of Fresenius Medical Care AG & Co. KGaA4 Before book gain from U.S. tax reform, natural disaster costs, VA agreement and FCPA provision5 Reported sales 2017 of €17,784 million, adjusted for IFRS 15 (€486 million)6 Base 2017: €1,280 million; 2018 including recurring benefits from U.S. tax reform of €140 million to €160 million
EBIT decreased by -2% (0% in constant currency) to €2,362 million (2016: €2,409 million). Adjusted EBIT1 increased by 4% (5% in constant currency) to €2,493 million (2016: €2,409 million), mainly due to the strong business performance in North America and in Asia-Pacific. The adjusted EBIT1 margin was 14.1% (2016: 14.5%). In Q4/2017, EBIT decreased by -29% (-22% in constant currency) to €519 million (2016: €730 million). In Q4/2017, adjusted EBIT1 of €726 million (Q4/2016: €730 million) was slighty below the prior-year level (increased by 6% in constant currency). The adjusted EBIT margin1 was 16.4% (Q4/2016: 16.5%).
Net income2 increased by 12% (14% in constant currency) to €1,280 million (2016: €1,144 million). Consistent with the original scope of guidance, i.e. excluding the effects of the VA agreement, natural disaster costs, the book gain from the US tax reform and the FCPA provision, net income2 increased by 7% in constant currency. In Q4/2017, net income2 increased by 8% (increased 16% in constant currency) to €394 million (Q4/2016: €363 million). Excluding the effects of the VA agreement, natural disaster costs, the book gain from the US tax reform and the FCPA provision, net income2 increased by 6% in constant currency.
Operating cash flow increased by 13% to €2,192 million (2016: €1,932 million). The cash flow margin was 12.3% (2016: 11.7%).
For 2018, Fresenius Medical Care expects sales to grow by ~8%3 in constant currency. The 2018 guidance is based on 2017 sales adjusted for the effect of the IFRS 15 implementation. Net income2 is expected to increase by 13% to 15%4 in constant currency in 2018, including recurring benefits from U.S tax reform of €140 million to €160 million.
1 Before natural disaster costs, effects of VA agreement and FCPA provision2 Net income attributable to shareholders of Fresenius Medical Care AG & Co. KGaA3 Reported sales 2017 of €17,784 million, adjusted for effect from IFRS 15 (€486 million)4 Base 2017: €1,280 million
For further information, please see Fresenius Medical Care’s Investor News at www.freseniusmedicalcare.com.
Fresenius Kabi
Fresenius Kabi offers intravenously administered generic drugs, clinical nutrition and infusion therapies for seriously and chronically ill patients in the hospital and outpatient environments. The company is also a leading supplier of medical devices and transfusion technology products. In the biosimilars business, we are developing products with a focus on oncology and autoimmune diseases.

- 7% organic sales growth, 8% EBIT2 growth in constant currency
- Operating cash flow at all-time high
- 2018 outlook: 4% to 7% organic sales growth and -3% to -6% EBIT growth5 in constant currency expected (~2% to 5%6 excl. biosimilars expenses)
1 Before special items2 Consistent with scope of original guidance: before acquisition-related expenses and expenditures for further development of biosimilars business3 Net income attributable to shareholders of Fresenius SE & Co. KGaA4 Consistent with scope of original guidance: before acquisition-related expenses, expenditures for further development of biosimilars business and book gain from U.S. tax reform5 Base 2017: €1,177 million; 2018 before special items (before acquisition-related expenses), including expenditures for further development of biosimilars business (€60 million in FY/17 and expected expenditures of ~€160 million in FY/18)6 Base: 2017: €1,237 million; 2018 before special items (before acquisition-related expenses)
Sales increased by 6% (7% in constant currency) to €6,358 million (2016: €6,007 million). Organic sales growth was 7%. Negative currency translation effects (-1%) were mainly related to the devaluation of the US dollar and the Chinese yuan against the Euro. In Q4/2017, sales increased by 3% (8% in constant currency) to €1,594 million (Q4/2016: €1,550 million). Organic sales growth was 8%.
Sales in Europe grew by 4% (organic growth: 5%) to €2,214 million (2016: €2,135 million). In Q4/2017, sales increased by 2% (3% organic) to €579 million (Q4/2016: €566 million).
Sales in North America increased by 6% (8% organic) to €2,290 million (2016: €2,170 million). In Q4/2017, sales increased by 2% (11% organic) to €554 million (Q4/2016: €542 million).
Sales in Asia-Pacific increased by 8% (11% organic) to €1,196 million (2016: €1,108 million). In Q4/2017, sales increased by 5% (11% organic) to €302 million (Q4/2016: €287 million). Sales in Latin America/Africa increased by 11% (10% organic) to €658 million (2016: €594 million). In Q4/2017, sales increased by 3% (10% organic) to €159 million (Q4/2016: €155 million).
Adjusted EBIT1 increased by 6% (8% in constant currency) to €1,237 million (2016: €1,171 million). The adjusted EBIT margin1 was 19.5% (2016: 19.5%). In Q4/2017, adjusted EBIT1 increased by 3% (9% in constant currency) to €318 million (Q4/2016: €308 million). The adjusted EBIT margin1 was 19.9% (Q4/2016: 19.9%).
EBIT before special items increased by 1% (3% in constant currency) to €1,177 million (2016: €1,171 million). The EBIT margin before special items was 18.5% (2016: 19.5%). In Q4/2017, EBIT before special items decreased by -12% ( 6% in constant currency) to €272 million (Q4/2016: €308 million). The EBIT margin before special items decreased to 17.1% (Q4/2016: 19.9%) due to expenditures for the further development of biosimilars business.
Adjusted net income2,3 increased by 10% (13% in constant currency) to €745 million (2016: €675 million). In Q4/2017, adjusted net income2,3 increased by 4% (10% in constant currency) to €191 million (Q4/2016: €184 million).
Operating cash flow reached an all-time high of €1,010 million (2016: €1,004 million). The cash flow margin was 15.9% (2016: 16.7%).
For 2018, Fresenius Kabi expects organic sales growth of 4% to 7% and EBIT growth in constant currency of -3% to -6%4. Excluding expenditures for the further development of the biosimilars business EBIT is expected to grow by ~2% to 5%5 in constant currency.
1 Consistent with scope of original guidance: before acquisition-related expenses and expenditures for further development of biosimilars business2 Net income attributable to shareholders of Fresenius SE & Co. KGaA3 Consistent with scope of original guidance: before acquisition-related expenses, expenditures for further development of biosimilars business and book gain from U.S. tax reform4 Base 2017: €1,177 million; 2018 before special items (before acquisition-related expenses), including expenditures for further development of biosimilars business (€60 million in FY/17 and expected expenditures of ~€160 million in FY/18)5 Base: 2017: €1,237 million; 2018 before special items (before acquisition-related expenses)
Fresenius Helios
Fresenius Helios is Europe's leading private hospital operator. The company comprises Helios Germany and Helios Spain (Quirónsalud). Helios Germany operates 111 hospitals, thereof 88 acute care clinics and 23 post-acute care clinics, and treats more than 5.3 million patients annually. Quirónsalud operates 45 hospitals, 55 outpatient centers and around 300 occupational risk prevention centers, and treats approximately 11.6 million patients per year.

- 4% organic sales growth
- 54% EBIT increase (6% excluding Quirónsalud)
- 2018 outlook: 3% to 6% organic sales growth and EBIT growth of 7% to 10% expected
Fresenius Helios increased sales by 48% to €8,668 million (2016: €5,843 million). Organic sales growth was 4%. Acquisitions, mainly Quirónsalud, increased sales by 44%. In Q4/2017, sales increased by 54% to €2,246 million (Q4/2016: €1,461 million), organic sales growth was 3%.
Sales of Helios Germany increased by 4% (4% organic) to €6,074 million (2016: €5,843 million). In Q4/2017, sales increased by 3% (3% organic) to €1,512 million (Q4/2016: €1,461 million). Helios Spain (Quirónsalud) has been consolidated since February 1, 2017 and generated sales of €2,594 million (thereof €734 million in Q4/2017).
Fresenius Helios grew EBIT by 54% to €1,052 million (2016: €683 million). The EBIT margin increased to 12.1% (2016: 11.7%). In Q4/2017, EBIT increased by 61% to €283 million (Q4/2016: €176 million). The EBIT margin increased to 12.6% (Q4/2016: 12.0%).
EBIT of Helios Germany increased by 6% to €725 million (2016: €683 million) with a margin of 11.9% (2016: 11.7%). In Q4/2017, EBIT of Helios Germany was on the prior-year level with €176 million (Q4/2016: €176 million). The margin was 11.6% (2016: 12.0%).
EBIT of Helios Spain was €327 million (thereof €107 million in Q4/2017) with a margin of 12.6% (Q4/2017: 14.6%).
Net income1 increased by 34% to €728 million (2016: €544 million). In Q4/2017, net income1 increased by 42% to €202 million (Q4/2016: €142 million).
Operating cash flow increased by 18% to €733 million (2016: €622 million) driven by the first-time consolidation of Quirónsalud and an excellent operating result. The margin was 8.5% (2016: 10.6%).
For 2018, Fresenius Helios expects organic sales growth of 3% to 6% and EBIT growth of 7% to 10%.
1 Net income attributable to shareholders of Fresenius SE & Co. KGaA
Fresenius Vamed
Fresenius Vamed manages projects and provides services for hospitals and other health care facilities worldwide. The portfolio ranges along the entire value chain: from project development, planning, and turnkey construction, via maintenance and technical management, to total operational management.

- 6% organic sales growth, 10% EBIT growth
- Order intake of €1,096 million at all-time high
- 2018 outlook: 5% to 10% organic sales growth and 5% to 10% EBIT growth expected
Sales increased by 6% (6% in constant currency) to €1,228 million (2016: €1,160 million). Organic sales growth was 6%. Sales in the project business increased by 2% to €606 million (2016: €594 million). Sales in the service business grew by 10% to €622 million (2016: €566 million). In Q4/2017, sales increased by 14% to €480 million (Q4/2016: €420 million). Organic sales growth was 14%.
EBIT grew by 10% to €76 million (2016: €69 million). The EBIT margin increased to 6.2% (2016: 5.9%). In Q4/2017, EBIT increased by 16% to €44 million (Q4/2016: €38 million). The EBIT margin increased to 9.2% (2016: 9.0%).
Net income1 grew by 11% to €50 million (2016: €45 million). In Q4/2017, net income1 increased by 21% to €29 million (Q4/2016: €24 million).
Order intake increased to €1,096 million (2016: €1,017 million), reaching an all-time high. As of December 31, 2017, order backlog was €2,147 million (Dec. 31, 2016: €1,961 million).
For 2018, Fresenius Vamed expects organic sales growth in the range of 5% to 10% and EBIT growth of 5% to 10%.
1 Net income attributable to shareholders of VAMED AG
Conference Call
As part of the publication of the results for fiscal year 2017, a conference call will be held on February 27, 2018 at 2 p.m. CET (8 a.m. EST). All investors are cordially invited to follow the conference call in a live broadcast over the Internet at www.fresenius.com/investors. Following the call, a replay will be available on our website.
For additional information on the performance indicators used please refer to our website www.fresenius.com/alternative-performance-measures
This release contains forward-looking statements that are subject to various risks and uncertainties. Future results could differ materially from those described in these forward-looking statements due to certain factors, e.g. changes in business, economic and competitive conditions, regulatory reforms, results of clinical trials, foreign exchange rate fluctuations, uncertainties in litigation or investigative proceedings, and the availability of financing. Fresenius does not undertake any responsibility to update the forward-looking statements in this release.
Standard & Poor’s has revised Fresenius’ corporate credit outlook to positive from stable in late December 2017. The corporate credit rating was affirmed. Hence, Fresenius is now rated BBB- with positive outlook by Standard & Poor’s. Fresenius is rated investment grade by all of the three leading rating agencies Standard & Poor’s, Moody's and Fitch.
Standard & Poor’s has revised Fresenius’ corporate credit outlook to positive from stable in late December 2017. The corporate credit rating was affirmed. Hence, Fresenius is now rated BBB- with positive outlook by Standard & Poor’s. Fresenius is rated investment grade by all of the three leading rating agencies Standard & Poor’s, Moody's and Fitch.
Fresenius expects meaningful positive effects from the tax reform legislation signed into law in the United States today. The new law goes into effect on January 1, 2018.
The new legislation triggers the revaluation of deferred tax liabilities. This results in a one-time book gain of approximately EUR 90 million, to be reflected in Fresenius’ 2017 Group net income*. Thereof, approximately EUR 30 million are attributable to Fresenius Kabi and approximately EUR 60 million** to Fresenius Medical Care.
Fresenius will report FY17 results and provide FY18 guidance including details on recurring tax effects resulting from the US tax reform on February 27, 2018.
*Net income attributable to shareholders of Fresenius SE & Co. KGaA
**Based on Fresenius’ 31% shareholding in Fresenius Medical Care AG & Co. KGaA
This release contains forward-looking statements that are subject to various risks and uncertainties. Future results could differ materially from those described in these forward-looking statements due to certain factors, e.g. changes in business, economic and competitive conditions, regulatory reforms, results of clinical trials, foreign exchange rate fluctuations, uncertainties in litigation or investigative proceedings, and the availability of financing. Fresenius does not undertake any responsibility to update the forward-looking statements in this release.
Fresenius expects meaningful positive effects from the tax reform legislation signed into law in the United States today. The new law goes into effect on January 1, 2018.
The new legislation triggers the revaluation of deferred tax liabilities. This results in a one-time book gain of approximately EUR 90 million, to be reflected in Fresenius’ 2017 Group net income1. Thereof, approximately EUR 30 million are attributable to Fresenius Kabi and approximately EUR 60 million2 to Fresenius Medical Care.
Fresenius will report FY17 results and provide FY18 guidance including details on recurring tax effects resulting from the US tax reform on February 27, 2018.
1 Net income attributable to shareholders of Fresenius SE & Co. KGaA
2 Based on Fresenius’ 31% shareholding in Fresenius Medical Care AG & Co. KGaA
This release contains forward-looking statements that are subject to various risks and uncertainties. Future results could differ materially from those described in these forward-looking statements due to certain factors, e.g. changes in business, economic and competitive conditions, regulatory reforms, results of clinical trials, foreign exchange rate fluctuations, uncertainties in litigation or investigative proceedings, and the availability of financing. Fresenius does not undertake any responsibility to update the forward-looking statements in this release.
If no timeframe is specified, information refers to Q1-3/2017
Q3/2017:
- Sales: €8.3 billion (+12%, +15% in constant currency)
- EBIT1: €1,129 million (+5%, +9% in constant currency)
- Net income2,3 (adjusted): €423 million (+11%, +14% in constant currency)
- Net income2: €396 million (+4%, +7% in constant currency)
Q1-3/2017:
- Sales: €25.2 billion (+16%, +16% in constant currency)
- EBIT1: €3,522 million (+15%, +15% in constant currency)
- Net income2,3 (adjusted): €1,339 million (+20%, +20% in constant currency)
- Net income2: €1,303 million (+17%, +17% in constant currency)
Stephan Sturm, CEO of Fresenius, said: “We can report another very good quarter, once again boosted by strong sales and earnings growth. The prospects for our businesses remain excellent. We are therefore confirming our guidance and are heading towards yet another record year. From this position of strength, we intend to swiftly close and integrate our strategically important acquisitions. Thus, we are expanding our range of high-quality, affordable healthcare products and services for the benefit of our patients and our company.“
1 Before acquisition-related expenses2 Net income attributable to shareholders of Fresenius SE & Co. KGaA3 Consistent with scope of original guidance: before acquisition-related expenses; before expenditures for further development of biosimilars business
For a detailed overview of adjustments, please see the reconciliation tables on page 15-16 in the pdf document.
2017 Group guidance confirmed
Fresenius confirms its guidance for 2017. Group sales are expected to increase by 15% to 17% in constant currency. Group net income1,2,3 is expected to grow by 19% to 21% in constant currency.
Including the acquisition of Merck KGaA’s biosimilars business and pro forma the acquisition of Akorn, the net debt/EBITDA4 ratio is expected to be approximately 3.3 at the end of 2017.
16% sales growth in constant currency
Group sales increased by 16% (16% in constant currency) to €25,191 million (Q1-3/2016: €21,651 million). Organic sales growth was 6%5 while acquisitions contributed 10%. In Q3/2017, Group sales increased by 12% (15% in constant currency) to €8,297 million (Q3/2016: €7,433 million). Negative currency translation effects (-3%) were mainly related to the devaluation of the US dollar. Organic sales growth was 6% while acquisitions contributed 9%.
1 Net income attributable to shareholders of Fresenius SE & Co. KGaA2 Before acquisition-related expenses of ~€50 m3 Before expected expenditures for further development of biosimilars business of ~€60 m4 Net debt and EBITDA at FY average exchange rates; before acquisition-related expenses of ~€50 m; excluding further potential acquisitions5 Excluding effects of Fresenius Medical Care’s agreement with the United States Departments of Veterans Affairs and Justice (VA agreement)
For a detailed overview of adjustments, please see the reconciliation tables on page 15-16 in the pdf document.

20% adjusted net income2,3 growth in constant currency
Group EBITDA4 increased by 16% (16% in constant currency) to €4,579 million (Q1-3/2016: €3,959 million). Group EBIT4 increased by 15% (15% in constant currency) to €3,522 million (Q1-3/2016: €3,058 million) with an EBIT margin4 of 14.0% (Q1-3/2016: 14.1%). In Q3/2017, Group EBIT4 increased by 5% (9% in constant currency) to €1,129 million (Q3/2016: €1,071 million) with an EBIT margin4 of 13.6% (Q3/2016: 14.4%).
Group net interest4 reached -€484 million (Q1-3/2016: -€433 million). The increase is mainly driven by the financing of the Quirónsalud acquisition.
1 Including effects of VA agreement2 Net income attributable to shareholders of Fresenius SE & Co. KGaA3 Consistent with scope of original guidance: before acquisition-related expenses; before expenditures for further development of biosimilars business4 Before acquisition-related expenses
For a detailed overview of adjustments, please see the reconciliation tables on page 15-16 in the pdf document.
The Group tax rate1 was 28.1% (Q1-3/2016: 28.2%). In Q3/2017, the Group tax rate1 decreased to 27.4% (Q3/2016: 27.9%), mainly driven by a re-evaluation of estimated future tax payments at Fresenius Medical Care.
Noncontrolling interest increased to €854 million (Q1-3/2016: €768 million), of which 95% was attributable to the noncontrolling interest in Fresenius Medical Care.
Adjusted Group net income2,3 increased by 20% (20% in constant currency) to €1,339 million (Q1-3/2016: €1,118 million). Adjusted earnings per share2,3 increased by 19% (19% in constant currency) to €2.42 (Q1-3/2016: €2.04). In Q3/2017, adjusted Group net income2,3 increased by 11% (14% in constant currency) to €423 million (Q3/2016: €382 million). Adjusted earnings per share2,3 increased by 11% (14% in constant currency) to €0.77 (Q3/2016: €0.69).
Group net income before acquisition-related expenses1,2 increased by 19% (19% in constant currency) to €1,329 million (Q1-3/2016: €1,118 million). Earnings per share1,2 increased by 18% (18% in constant currency) to €2.40 (Q1-3/2016: €2.04). In Q3/2017, Group net income1,2 increased by 8% (11% in constant currency) to €413 million (Q3/2016: €382 million). Earnings per share1,2 increased by 8% (11% in constant currency) to €0.75 (Q3/2016: €0.69).
Group net income2 increased by 17% (17% in constant currency) to €1,303 million (Q1-3/2016: €1,118 million). Earnings per share2 increased by 15% (15% in constant currency) to €2.35 (Q1-3/2016: €2.04). In Q3/2017, Group net income2 increased by 4% (7% in constant currency) to €396 million (Q3/2016: €382 million). Earnings per share2 increased by 3% (6% in constant currency) to €0.71 (Q3/2016: €0.69).
1 Before acquisition-related expenses2 Net income attributable to shareholders of Fresenius SE & Co. KGaA3 Consistent with scope of original guidance: before acquisition-related expenses; before expenditures for further development of biosimilars business
For a detailed overview of adjustments, please see the reconciliation tables on page 15-16 in the pdf document.
Continued investment in growth
Spending on property, plant and equipment was €1,137 million (Q1-3/2016: €1,059 million), primarily for the modernization and expansion of dialysis clinics, production facilities as well as hospitals and day clinics. Total acquisition spending of €6,662 million (Q1-3/2016: €592 million) was mainly related to the acquisitions of Quirónsalud and Merck KGaA’s biosimilars business.
Strong operating cash flow
Operating cash flow increased by 24% to €2,821 million (Q1-3/2016: €2,273 million). The cash flow margin increased to 11.2% (Q1-3/2016: 10.5%). In Q3/2017, operating cash flow increased by 21% to €1,138 million (Q3/2016: €940 million), with a margin of 13.7% (Q3/2016: 12.6%).
Free cash flow before acquisitions and dividends increased by 41% to €1,705 million (Q1-3/2016: €1,206 million). Free cash flow after acquisitions and dividends was -€5,233 million (Q1-3/2016: €252 million).
Solid balance sheet structure
The Group’s total assets increased by 14% (20% in constant currency) to €53,097 million (Dec. 31, 2016: €46,697 million), mainly due to the acquisition of Quirónsalud. Current assets grew by 10% (16% in constant currency) to €12,870 million (Dec. 31, 2016: €11,744 million). Non-current assets increased by 15% (22% in constant currency) to €40,227 million (Dec. 31, 2016: € 34,953 million).
Total shareholders’ equity grew by 2% (10% in constant currency) to €21,167 million (Dec. 31, 2016: €20,849 million). The equity ratio was 39.9% (Dec. 31, 2016: 44.6%).
Group debt increased by 32% (37% in constant currency) to €19,496 million (Dec. 31, 2016: € 14,780 million), mainly driven by the acquisition financing of Quirónsalud. As of September 30, 2017, the net debt/EBITDA ratio was 2.971,2 (Dec. 31, 2016: 2.331; pro forma Quirónsalud 3.091).
1 Net debt and EBITDA at LTM average exchange rates2 Before acquisition-related expenses
For a detailed overview of adjustments, please see the reconciliation tables on page 15-16 in the pdf document.
Business Segments
Fresenius Medical Care
Fresenius Medical Care is the world's largest provider of products and services for individuals with chronic kidney failure. As of September 30, 2017, Fresenius Medical Care was treating 317,792 patients in 3,714 dialysis clinics. Along with its core business, the company seeks to expand the range of medical services in the field of care coordination.

- Solid Q3 despite impact from natural disasters in North America
- 8% constant currency sales growth in Q3
- 2017 outlook confirmed2
Sales increased by 10% (10% in constant currency, 7% organic) to €13,355 million (Q1-3/2016: €12,153 million). Acquisitions and the agreement with the United States Departments of Veterans Affairs and Justice (VA agreement) contributed 3% in total. In Q3/2017, sales increased by 3% (8% in constant currency, 6% organic) to €4,336 million (Q3/2016: €4,211 million).
Health Care Services sales (dialysis services and care coordination) increased by 11% (10% in constant currency) to €10,950 million (Q1-3/2016: €9,910 million). Product sales increased by 7% (7% in constant currency) to €2,404 million (Q1-3/2016: €2,244 million).
In North America, sales increased by 10% (10% in constant currency) to €9,715 million (Q1-3/2016: €8,828 million). Health Care Services sales grew by 10% (10% in constant currency) to €9,086 million (Q1-3/2016: €8,224 million). Product sales increased by 4% (4% in constant currency) to €629 million (Q1-3/2016: €604 million).
Sales outside North America increased by 9% (10% in constant currency) to €3,628 million (Q1-3/2016: €3,315 million). Health Care Services sales increased by 11% (11% in constant currency) to €1,864 million (Q1-3/2016: €1,686 million). Product sales increased by 8% (8% in constant currency) to €1,764 million (Q1-3/2016: €1,630 million).
1 Net income attributable to shareholders of Fresenius Medical Care AG & Co. KGaA2 Excluding effects of VA agreement and natural disaster costs
EBIT increased by 10% (10% in constant currency) to €1,843 million (Q1-3/2016: €1,679 million). The EBIT margin was 13.8% (Q1-3/2016: 13.8%). In Q3/2017, EBIT was on the prior-year level (increased by 4% in constant currency) at €608 million (Q3/2016: €611 million). Foreign currency effects, lower contributions from the vascular business, higher costs in the pharmacy services business and natural disaster costs in North America negatively impacted EBIT, while organic growth and lower research and development expenses contributed positively. The EBIT margin was 14.0% (Q3/2016: 14.5%).
Net income1 increased by 13% (14% in constant currency) to €886 million (Q1-3/2016: €781 million). Consistent with the original scope of guidance, i.e. excluding the effects of the VA agreement and natural disaster costs, net income1 increased by 8% in constant currency. In Q3/2017, net income1 grew by 2% (6% in constant currency) to €309 million (Q3/2016: €304 million). Excluding the effects of the VA agreement and natural disaster costs, net income1 increased by 5% (8% in constant currency).
Operating cash flow increased by 43% to €1,664 million (Q1-3/2016: €1,160 million). The cash flow margin increased to 12.5% (Q1-3/2016: 9.5%). In Q3/2017, operating cash flow increased by 56% to €612 million (Q3/2016: €393 million) with a cash flow margin of 14.1% (Q3/2016: 9.3%). The increase is primarily attributable to last year’s cash contribution to a pension plan in the United States as well as other working capital items.
Fresenius Medical Care confirms its outlook for 2017. The company expects sales to grow by 8% to 10%2 in constant currency. Net income1,3 is expected to increase by 7% to 9% in constant currency.
For further information, please see Fresenius Medical Care’s Investor News at www.freseniusmedicalcare.com.
1 Net income attributable to shareholders of Fresenius Medical Care AG & Co. KGaA2 Excluding effects of VA agreement3 Excluding effects of VA agreement and natural disaster costs
Fresenius Kabi
Fresenius Kabi offers intravenously administered generic drugs, clinical nutrition and infusion therapies for seriously and chronically ill patients in the hospital and outpatient environments. The company is also a leading supplier of medical devices and transfusion technology products.

- 7% organic sales growth in Q3; positive contributions from all regions
- 11% adjusted EBIT growth2 in constant currency in Q3
- 2017 outlook confirmed
Sales increased by 7% (7% in constant currency, 7% organic) to €4,764 million (Q1-3/2016: €4,457 million). Acquisitions/divestitures had no meaningful impact on sales. In Q3/2017, sales increased by 3% (7% in constant currency, 7% organic) to €1,562 million (Q3/2016: €1,511 million). Negative currency translation effects (-4%) were mainly related to the devaluation of the US dollar and the Chinese yuan against the Euro.
Sales in Europe increased by 4% (5% organic) to €1,635 million (Q1-3/2016: €1,569 million). In Q3/2017, sales increased by 3% (4% organic) to €538 million (Q3/2016: €521 million).
Sales in North America increased by 7% (6% organic) to €1,736 million (Q1-3/2016: €1,628 million). In Q3/2017, sales increased by 1% (7% organic) to €549 million (Q3/2016: €542 million).
Sales in Asia-Pacific increased by 9% (11% organic) to €894 million (Q1-3/2016: €821 million). In Q3/2017, sales increased by 8% (12% organic) to €312 million (Q3/2016: €290 million).
Sales in Latin America/Africa increased by 14% (10% organic) to €499 million (Q1-3/2016: €439 million). In Q3/2017, sales increased by 3% (8% organic) to €163 million (Q3/2016: €158 million).
1 Before acquisition-related expenses2 Consistent with scope of original guidance: before acquisition-related expenses; before expenditures for further development of biosimilars business3 Net income attributable to shareholders of Fresenius SE & Co. KGaA
For a detailed overview of adjustments, please see the reconciliation tables on page 15-16 in the pdf document.
Adjusted EBIT1 increased by 6% (7% in constant currency) to €919 million (Q1-3/2016: €863 million). The adjusted EBIT margin1 was 19.3% (Q1-3/2016: 19.4%). In Q3/2017, adjusted EBIT1 increased by 6% (11% in constant currency) to €297 million (Q3/2016: €281 million), despite expenses related to hurricane Maria on Puerto Rico. The adjusted EBIT margin1 increased to 19.0% (Q3/2016: 18.6%).
EBIT2 increased by 5% (6% in constant currency) to €905 million (Q1-3/2016: €863 million). The EBIT margin2 was 19.0% (Q1-3/2016: 19.4%). In Q3/2017, EBIT2 increased by 1% (6% in constant currency) to €283 million (Q3/2016: €281 million). Given the €14 million expenditure for the further development of the biosimilars business, the EBIT margin2 decreased to 18.1% (Q3/2016: 18.6%).
Adjusted net income1,3 increased by 13% (14% in constant currency) to €554 million (Q1-3/2016: €491 million). In Q3/2017, adjusted net income1,3 increased by 13% (19% in constant currency) to €175 million (Q3/2016: €155 million).
While operating cash flow reached a very strong €640 million, it could not match the exceptional prior-year figure (Q1-3/2016: €661 million). The same applied to the strong margin of 13.4% (Q1-3/2016: 14.8%). In Q3/2017, operating cash flow reached a healthy €245 million (Q3/2016: €322 million) despite a cash prepayment for the biosimilars business and adverse currency translation effects. The cash flow margin was 15.7% (Q3/2016: 21.3%). Excluding the prepayment, operating cash flow was €290 with a margin of 18.6%.
Fresenius Kabi confirms its outlook for 2017 and expects 5% to 7% organic sales growth and EBIT growth in constant currency of 6% to 8%4,5.
1 Consistent with scope of original guidance: before acquisition-related expenses; before expenditures for further development of biosimilars business2 Before acquisition-related expenses3 Net income attributable to shareholders of Fresenius SE & Co. KGaA4 Before acquisition-related expenses of ~€50 m5 Before expected expenditures for further development of biosimilars business of ~€60 mFor a detailed overview of adjustments, please see the reconciliation tables on page 15-16 in the pdf document.
Fresenius Helios
Fresenius Helios is Europe's leading private hospital operator. The company comprises Helios Kliniken in Germany and Quirónsalud in Spain. Helios Kliniken operates 111 hospitals, thereof 88 acute care clinics and 23 post-acute care clinics, and treats more than 5.2 million patients annually. Quirónsalud operates 44 hospitals, 44 outpatient centers and around 300 occupational risk prevention centers, and treats approximately 9.7 million patients per year.

- 47% sales growth (4% excluding Quirónsalud) in Q3
- 33% EBIT increase (9% excluding Quirónsalud) in Q3
- 2017 outlook confirmed
Fresenius Helios increased sales by 47% (4% organic) to €6,422 million (Q1-3/2016: €4,382 million). Acquisitions, mainly Quirónsalud, increased sales by 43%. In Q3/2017, sales increased by 47% (4% organic) to €2,166 million (Q3/2016: €1,470 million).
Sales of Helios Kliniken2 increased by 4% (4% organic) to €4,562 million (Q1-3/2016: €4,382 million). In Q3/2017, sales increased by 4% (4% organic) to €1,524 million (Q3/2016: €1,470 million). Quirónsalud has been consolidated since February 1, 2017 and generated sales of €1,860 million (thereof €642 million in Q3/2017).
Fresenius Helios grew EBIT by 52% to €769 million (Q1-3/2016: €507 million). The EBIT margin increased to 12.0% (Q1-3/2016: 11.6%). In Q3/2017, EBIT increased by 33% to €232 million (Q3/2016: €175 million). The EBIT margin decreased to 10.7% (Q3/2016: 11.9%) due to the anticipated lower contribution of Quirónsalud during the summer months.
EBIT of Helios Kliniken2 increased by 8% to €549 million (Q1-3/2016: €507 million) with a margin of 12.0% (Q1-3/2016: 11.6%). In Q3/2017, EBIT of Helios Kliniken2 increased by 9% to €190 million (Q3/2016: €175 million) with a margin of 12.5% (Q3/2016: 11.9%). EBIT of Quirónsalud was €220 million (thereof €42 million in Q3/2017) with a margin of 11.8% (Q3/2017: 6.5%).
Fresenius Helios increased net income1 by 31% to €526 million (Q1-3/2016: €402 million). In Q3/2017, net income1 increased by 9% to €153 million (Q3/2016: €140 million).
Operating cash flow increased by 28% to €560 million (Q1-3/2016: €437 million) driven by the first-time consolidation of Quirónsalud. The margin was 8.7% (Q1-3/2016: 10.0%).
Fresenius Helios confirms its outlook for 2017 and projects organic sales growth of 3% to 5%2 and sales of ~€8.6 billion (thereof Quirónsalud ~€2.5 billion3). EBIT is expected to increase to €1,020 to €1,070 million (thereof Quirónsalud €300 to 320 million3).
1 Net income attributable to shareholders of Fresenius SE & Co. KGaA2 Helios Kliniken Germany, excluding Quirónsalud3 Quirónsalud consolidated for 11 months
Fresenius Vamed
Fresenius Vamed manages projects and provides services for hospitals and other health care facilities worldwide. The portfolio ranges along the entire value chain: from project development, planning, and turnkey construction, via maintenance and technical management, to total operational management.

- 9% sales growth in service business in Q3
- Project business with strong order intake of €285 million in Q3
- 2017 outlook confirmed
Sales increased by 1% (1% organic) to €748 million (Q1-3/2016: €740 million). Sales in the project business decreased by 7% to €301 million (Q1-3/2016: €325 million). Sales in the service business grew by 8% to €447 million (Q1-3/2016: €415 million). In Q3/2017, sales remained stable at €267 million (Q3/2016: €268 million).
EBIT increased by 3% to €32 million (Q1-3/2016: €31 million). The EBIT margin increased to 4.3% (Q1-3/2016: 4.2%). In Q3/2017, EBIT of €15 million (margin 5.6%) remained unchanged from previous year’s quarter.
Net income1 remained stable at €21 million (Q1-3/2016: €21 million). In Q3/2017, net income1 remained unchanged at €10 million (Q3/2016: €10 million).
Order intake reached a strong €697 million (Q1-3/2016: €674 million). In Q3/2017 order intake increased by 36% to €285 million. As of September 30, 2017, order backlog grew to an all-time high of €2,345 million (December 31, 2016: €1,961 million).
Fresenius Vamed confirms its outlook for 2017 and expects both organic sales growth and EBIT growth in the range of 5% to 10%.
1 Net income attributable to shareholders of VAMED AG
Conference Call
As part of the publication of the results for the first nine months of 2017, a conference call will be held on November 2, 2017 at 2 p.m. CET (9 a.m. EDT). All investors are cordially invited to follow the conference call in a live broadcast over the Internet at www.fresenius.com/investors. Following the call, a replay will be available on our website.
For additional information on the performance indicators, please refer to our website www.fresenius.com/alternative-performance-measures.
Diese Mitteilung enthält zukunftsbezogene Aussagen, die gewissen Risiken und Unsicherheiten unterliegen. Die zukünftigen Ergebnisse können erheblich von den zur Zeit erwarteten Ergebnissen abweichen, und zwar aufgrund verschiedener Risikofaktoren und Ungewissheiten wie zum Beispiel Veränderungen der Geschäfts-, Wirtschafts- und Wettbewerbssituation, Gesetzesänderungen, Ergebnisse klinischer Studien, Wechselkursschwankungen, Ungewissheiten bezüglich Rechtsstreitigkeiten oder Untersuchungsverfahren und die Verfügbarkeit finanzieller Mittel. Fresenius übernimmt keinerlei Verantwortung, die in dieser Mitteilung enthaltenen zukunftsbezogenen Aussagen zu aktualisieren.