In this year's ranking, the non-profit organization CDP has confirmed Fresenius' classification in the second-highest category B. Fresenius is thus once again one of the leading companies in the health care sector. Companies in categories A and B are characterized by transparency, coordinated climate protection measures and the implementation of corresponding best-practice approaches. CDP is one of the most renowned climate and environmental rankings in the capital market. More than 590 investors use the annual results to evaluate climate protection activities and climate-related risks and opportunities of the companies assessed.
In this year's ranking, the non-profit organization CDP has confirmed Fresenius' classification in the second-highest category B. Fresenius is thus once again one of the leading companies in the health care sector. Companies in categories A and B are characterized by transparency, coordinated climate protection measures and the implementation of corresponding best-practice approaches. CDP is one of the most renowned climate and environmental rankings in the capital market. More than 590 investors use the annual results to evaluate climate protection activities and climate-related risks and opportunities of the companies assessed.
Fresenius has been included again in the Dow Jones Sustainability Index (DJSI Europe). The DJSI Europe index represents the top 20 percent based on the international investment company S&P Global’s analysis of their economic, environmental, and social performance. Fresenius achieved improvements in many categories, the most significant ones in the areas of Cybersecurity, Data Protection and Human Rights. In the area of Partnerships towards sustainable healthcare, Fresenius was awarded the maximum score in the rating 2021.
Fresenius has been included again in the Dow Jones Sustainability Index (DJSI Europe). The DJSI Europe index represents the top 20 percent based on the international investment company S&P Global’s analysis of their economic, environmental, and social performance. Fresenius achieved improvements in many categories, the most significant ones in the areas of Cybersecurity, Data Protection and Human Rights. In the area of Partnerships towards sustainable healthcare, Fresenius was awarded the maximum score in the rating 2021.
Fresenius Medical Care with stronger than projected COVID-19 related headwind
Fresenius Kabi improves EBIT1 outlook; North America returning to growth; Emerging Markets business with continued healthy financial performance
Helios Germany with ongoing upward trend for elective treatments; activity levels at Helios Spain above pre-pandemic levels
Fresenius Vamed with good performance in the service business; order book in the project business remains at all-time high
Cost and efficiency program on track; savings targets confirmed for FY/23
Fresenius raises FY/21 Group sales outlook; earnings now expected to be around the top-end of guidance
If no timeframe is specified, information refers to Q3/21.
1In constant currency2Before special items3Net income attributable to shareholders of Fresenius SE & Co. KGaA
Stephan Sturm, CEO of Fresenius, said: “More and more people being vaccinated against COVID-19 is good news. However, the pandemic remains very relevant. It has also more strongly impacted Fresenius and for longer than could have been foreseen. Yet despite this, we continue to grow and remain on track to achieve this year’s, again raised, targets. Launching the Group cost and efficiency program has proved to be the right decision: Our initiatives will help us to better absorb the burdens caused by the pandemic. At the same time, they will strengthen our foundations to thrive, long-term, in a challenging environment. The demand for high-quality, affordable healthcare will be even greater in the future. Fresenius will continue making an important contribution, while creating value for all stakeholders.”
COVID-19 assumptions for guidance FY/21
Negative COVID-19 effects at Fresenius have increased sequentially in Q3/21, driven by significant excess patient mortality at Fresenius Medical Care. Fresenius expects also Q4/21 to be impacted by COVID-19 effects. Meaningfully rising COVID-19 case numbers, the further evolution of virus mutations as well as stalling vaccination progress could impact Fresenius’ ability to achieve its FY/21 guidance. Additionally, Fresenius expects headwinds from cost inflation including rising commodity and shipping prices, increasing energy costs, as well as supply chain constraints in Q4/21. Hence, Fresenius remains vigilant.
Whilst the risk of renewed far-reaching containment measures in one or more of Fresenius’ major markets cannot be excluded, it now appears unlikely. Any resulting significant and direct impact on the health care sector without appropriate compensation is not reflected in the Group’s FY/21 guidance. These assumptions are subject to considerable uncertainty.
FY/21 Group sales guidance raised, earnings guidance improved
Based on the Group’s good Q3/21 results and the progress to improve Group-wide efficiencies, Fresenius raises its sales guidance and improves its earnings guidance. The Company now projects constant currency sales1 to grow in a mid single-digit range in FY/21. Previously, the Company projected sales1 growth in a low-to-mid single-digit percentage range in constant currency. Earnings2,3 growth in constant currency is now expected to be around the top-end of the low single-digit percentage range.
Implicitly, net income2 for the Group excluding Fresenius Medical Care is now expected to grow in a low double-digit percentage range in constant currency. Previously, Fresenius expected high single-digit percentage growth in constant currency.
The guidance implies ongoing COVID-19 related headwinds, primarily at Fresenius Medical Care, and increasingly noticeable cost inflation across selected markets in Q4/21. It also reflects negative pricing effects related to tender activity at Fresenius Kabi in China.
Based on expected lower contributions to Group EBITDA from Fresenius Medical Care as well as assumed cash phasing effects in Q4/21, Fresenius does not expect the net debt/EBITDA4 ratio of 3.55x as of September 30, 2021 to improve in Q4/21.
1 FY/20 base: €36,277 million 2 Net income attributable to shareholders of Fresenius SE & Co. KGaA 3 FY/20 base: €1,796 million, before special items; FY/21: before special items 4 At LTM average exchange rates for both net debt and EBITDA; pro forma closed acquisitions/divestitures; excluding further potential acquisitions; before special items
For a detailed overview of special items please see the reconciliation table in the PDF document.
Progress on efficiency measures to sustainably improve profitability
During Q3/21, Fresenius finalized the concept phase of its cost and efficiency program. At the same time, first initiatives were already implemented. Fresenius Medical Care is providing an update on its FME25 transformation program in addition to its Q3/21 results presentation. Fresenius confirms its expectation that the measures to sustainably enhance profitability and operational excellence to reach cost savings of more than €100 million p.a. after tax and minority interest in 2023, with some potential to increase thereafter.
Achieving these sustainable efficiencies will require significant up-front expenses. For the years 2021 to 2023, those expenses are expected to average more than €100 million p.a. after tax and minority interest, with the largest portion currently expected to materialize in 2022. They will be classified as special items, consistent with previous practice.
Fresenius expects significant contributions from all four business segments and from the corporate center in the 2021 to 2023 period. For FY/21, low double-digit million Euro savings after tax and minority interest from the Group’s cost and efficiency measures are expected to support the Group’s profitability. These savings and efficiency gains derive from activities in all four business segments.
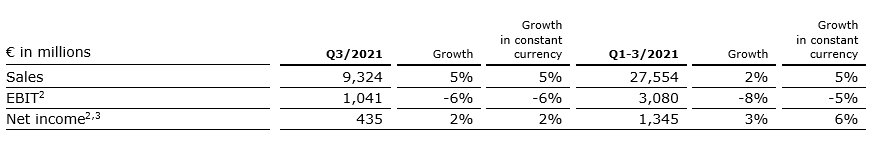
5% sales increase in constant currency Group sales increased by 5% (5% in constant currency) to €9,324 million (Q3/20: €8,918 million). Organic growth was 3%. Acquisitions/divestitures contributed net 2% to growth. Currency translation had no effect on sales growth. Excluding estimated COVID-19 effects1, Group sales growth would have been 7% to 8% in constant currency.
In Q1-3/21, Group sales increased by 2% (5% in constant currency) to €27,554 million (Q1-3/20: €26,973 million). Organic growth was 4%. Acquisitions/divestitures contributed net 1% to growth. Currency translation reduced sales growth by 3%. Excluding estimated COVID-19 effects1, Group sales growth would have been 5% to 6% in constant currency.
2% net income2,3 increase in constant currency
Group EBITDA before special items decreased by 2% (-2% in constant currency) to €1,700 million (Q3/20: €1,729 million). Reported Group EBITDA was €1,667 million (Q3/20: €1,729 million).
In Q1-3/21, Group EBITDA before special items decreased by 5% (-1% in constant currency) to €5,002 million (Q1-3/20: €5,246 million). Reported Group EBITDA was €4,957 million (Q1-3/20: €5,246 million).
Group EBIT before special items decreased by 6% (-6% in constant currency) to €1,041 million (Q3/20: €1,113 million). The decrease is primarily due to COVID-19 related headwinds at Fresenius Medical Care. The EBIT margin before special items was 11.2% (Q3/20: 12.5%). Reported Group EBIT was €1,008 million (Q3/20: €1,113 million).
In Q1-3/21, Group EBIT before special items decreased by 8% (-5% in constant currency) to €3,080 million (Q1-3/20: €3,361 million). The constant currency decrease is primarily due to COVID-19 related headwinds at Fresenius Medical Care. The EBIT margin before special items was 11.2% (Q1-3/20: 12.5%). Reported Group EBIT was €3,035 million (Q1-3/20: €3,361 million).
1 For estimated COVID-19 effects please see table in the PDF document. 2 Before special items 3 Net income attributable to shareholders of Fresenius SE & Co. KGaA
For a detailed overview of special items please see the reconciliation table in the PDF document.
Group net interest before special items and reported net interest improved to -€126 million (Q3/202: -€154 million) mainly due to lower interest rates.
In Q1-3/21, Group net interest before special items improved to -€384 million (Q1-3/202: -€495 million). Reported Group net interest improved to -€384 million (Q1-3/20: -€503 million).
Group tax rate before special items was 23.0% (Q3/202: 22.0%) while reported Group tax rate was 22.8% (Q3/20: 22.0%).
In Q1-3/21, Group tax rate before special items was 22.4% (Q1-3/202: 22.7%) while reported Group tax rate was 22.3% (Q1-3/20: 22.7%).
Noncontrolling interests before special items were -€270 million (Q3/20: -€321 million) of which 91% were attributable to the noncontrolling interests in Fresenius Medical Care. Reported noncontrolling interests were -€268 million (Q3/20: -€321 million).
In Q1-3/21, noncontrolling interests before special items were -€747 million (Q1-3/20: -€913 million) of which 91% were attributable to the noncontrolling interests in Fresenius Medical Care. Reported noncontrolling interests were -€741 million (Q3/20: -€913 million).
Group net income1 before special items increased by 2% (2% in constant currency) to €435 million (Q3/202: €427 million) driven by Fresenius Vamed and Fresenius Kabi as well as by the favorable net interest development. Excluding estimated COVID-19 effects3, Group net income1 before special items would have grown 12% to 16% in constant currency. Reported Group net income1 decreased to €413 million (Q3/20: €427 million).
In Q1-3/21, Group net income1 before special items increased by 3% (6% in constant currency) to €1,345 million (Q1-3/202: €1,302 million). Excluding estimated COVID-19 effects3, Group net income1 before special items would have grown 7% to 11% in constant currency. Reported Group net income1 increased to €1,319 million (Q1-3/20: €1,297 million).
1 Net income attributable to shareholders of Fresenius SE & Co. KGaA 2 Before special items 3 For estimated COVID-19 effects please see table in the PDF document.
For a detailed overview of special items please see the reconciliation table in the PDF document.
Earnings per share1 before special items increased by 1% (1% in constant currency) to €0.78 (Q3/202: €0.77). Reported earnings per share1 were €0.74 (Q3/20: €0.77).
In Q1-3/21, earnings per share1 before special items increased by 3% (6% in constant currency) to €2.41 (Q1-3/202: €2.34). Reported earnings per share1 were €2.36 (Q1-3/20: €2.33).
Continued investment in growth
Spending on property, plant and equipment was €449 million corresponding to 5% of sales (Q3/20: €521 million; 6% of sales). These investments served primarily for the modernization and expansion of dialysis clinics, production facilities as well as hospitals and day clinics.
In Q1-3/21, spending on property, plant and equipment was €1,342 million corresponding to 5% of sales (Q1-3/20: €1,542 million; 6% of sales).
Total acquisition spending was €167 million (Q3/20: €142 million). In Q1-3/21, total acquisition spending was €807 million (Q1-3/20: €651 million) mainly for the acquisition of Eugin Group at Fresenius Helios which has been consolidated since April 1, 2021, and the acquisition of dialysis clinics at Fresenius Medical Care.
Cash flow development
Group operating cash flow increased to €1,226 million (Q3/20: €1,199 million) with a margin of 13.1% (Q3/20: 13.4%). Free cash flow before acquisitions and dividends increased correspondingly to €793 million (Q3/20: €682 million). Free cash flow after acquisitions and dividends increased to €594 million (Q3/20: -€185 million).
In Q1-3/21, Group operating cash flow decreased to €3,329 million (Q1-3/20: €5,159 million) with a margin of 12.1% (Q1-3/20: 19.1%). The decrease was mainly due to continued recoupment of the U.S. federal government’s payments under the CARES Act in Q2/20. Free cash flow before acquisitions and dividends decreased to €1,986 million (Q1-3/20: €3,593 million). Free cash flow after acquisitions and dividends decreased to €352 million (Q1-3/20: €2,149 million).
1 Net income attributable to shareholders of Fresenius SE & Co. KGaA 2 Before Special items
Solid balance sheet structure
Group total assets increased by 7% (4% in constant currency) to €71,081 million (Dec. 31, 2020: €66,646 million) given the expansion of business activities and currency effects. Current assets increased by 10% (7% in constant currency) to €17,334 million (Dec. 31, 2020: €15,772 million) driven by the increase of cash and cash equivalents, trade accounts receivables, and inventories. Non-current assets increased by 6% (3% in constant currency) to €53,747 million (Dec. 31, 2020: €50,874 million).
Total shareholders’ equity increased by 8% (4% in constant currency) to €28,186 million (Dec. 31, 2020: €26,023 million). The equity ratio was 39.7% (Dec. 31, 2020: 39.0%).
Group debt increased by 5% (3% in constant currency) to €27,191 million (Dec. 31, 2020: € 25,913 million). Group net debt increased by 3% (1% in constant currency) to € 24,778 million (Dec. 31, 2020: € 24,076 million).
As of September 30, 2021, the net debt/EBITDA ratio increased to 3.55x1,2 (Dec. 31, 2020: 3.44x1,2) driven by COVID-19 effects weighing on EBITDA as well as increased net debt. The improvement over June 30, 2021 (3.60x1,2) is driven by the reduction of net debt in Q3/21 due to the good cash flow performance.
1 At LTM average exchange rates for both net debt and EBITDA; pro forma closed acquisitions/divestitures 2 Before special items
For a detailed overview of special items please see the reconciliation table in the PDF document.
Number of employees
As of September 30, 2021, the Fresenius Group had 314,852 employees worldwide (December 31, 2020: 311,269).
Business Segments Fresenius Medical Care (Financial data according to Fresenius Medical Care press release)
Fresenius Medical Care is the world's largest provider of products and services for individuals with renal diseases. As of September 30, 2021, Fresenius Medical Care was treating approximately 345,000 patients in 4,151 dialysis clinics. Along with its core business, the Renal Care Continuum, the company focuses on expanding in complementary areas and in the field of critical care.
Stronger than projected headwind from COVID-19 effects with significantly increased patient excess mortality due to global spread of Delta variant
Organic growth continued with 1%
Financial targets for FY 2021 confirmed, expectation to reach lower end of the guidance ranges for revenue and net income
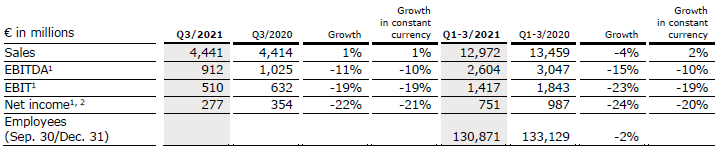
Sales of Fresenius Medical Care increased by 1% (increased by 1% in constant currency) to €4,441 million (Q3/20: €4,414 million). Organic growth was 1%. In Q1-3/21, sales of Fresenius Medical Care decreased by 4% (increased by 2% in constant currency) to €12,972 million (Q1-3/20: €13,459 million). Thus, currency translation had a negative effect of 6%. Organic growth was 1%.
EBIT decreased by 20% (-19% in constant currency) to €505 million (Q3/20: €632 million) resulting in a margin of 11.4% (Q3/20: 14.3%). EBIT before special items declined by 19% to €510 million (-19% in constant currency; Q3/20: €632 million), resulting in a margin of 11.5% (Q3/20: 14.3%). The decline was mainly due to adverse COVID-19-related effects, inflationary cost increases and higher labor costs. These effects were slightly mitigated by an improved U.S. payor mix, in particular due to an increased number of patients with Medicare Advantage coverage.
In Q1-3/21, EBIT decreased by 24% (-20% in constant currency) to €1,403 million (Q1-3/20: €1,843 million) resulting in a margin of 10.8% (Q1-3/20: 13.7%). EBIT before special items decreased by 23% (-19% in constant currency) to €1,417 million (Q1-3/20: €1,843 million) resulting in an EBIT margin before special items of 10.9% (Q1-3/20: 13.7%).
1 Before special items 2 Net income attributable to shareholders of Fresenius Medical Care AG & Co. KGaA
For a detailed overview of special items please see the reconciliation tables in the PDF document.
Net income1 decreased by 23% (-22% in constant currency) to €273 million (Q3/20: €354 million) mainly due to effects explained for operating income and a higher tax rate. Net income1 before special items decreased by 22% (-21% in constant currency) to €277 million (Q3/20: €354 million).
In Q1-3/21, net income1 decreased by 25% (-21% in constant currency) to €741 million (Q1-3/20: €987 million). Net income1 before special items decreased by 24% (-20% in constant currency) to €751 million (Q1-3/20: €987 million).
Operating cash flow was €692 million (Q3/20: €746 million) with a margin of 15.6% (Q3/20: 16.9%). The decrease was mainly due to continued recoupment of the U.S. federal government’s payments in the second quarter of 2020 under the CARES Act. In Q1-3/21, operating cash flow was €1,820 million (Q1-3/20: €3,649 million) with a margin of 14.0% (Q1-3/20: 27.1%).
For FY/21, Fresenius Medical Care confirms its outlook for revenue2 to grow at a low-to-mid single-digit percentage rate and net income1,3 to decline at a high-teens to mid-twenties percentage rate against the 2020 base and is now expecting to be at the lower end of these guidance ranges4.
1 Net income attributable to shareholders of Fresenius Medical Care AG & Co. KGaA 2 FY/20 base: €17,859 million 3 FY/20 base: €1,359 million, before special items; FY/21: before special items 4 These targets are based on the 2020 results excluding the impairment of goodwill and trade names in the Latin America Segment of €195 million. They are inclusive of anticipated COVID-19 effects, in constant currency and exclude special items. Special items include costs related to FME25 and other effects that are unusual in nature and have not been foreseeable or not foreseeable in size or impact at the time of giving guidance.
For a detailed overview of special items please see the reconciliation tables in the PDF document.
Fresenius Kabi
Fresenius Kabi offers intravenously administered generic drugs, clinical nutrition and infusion therapies for seriously and chronically ill patients in the hospital and outpatient environments. The company is also a leading supplier of medical devices and transfusion technology products. In the biosimilars business, Fresenius Kabi develops products with a focus on oncology and autoimmune diseases.
North America with healthy organic sales growth; EBIT growth only hindered by a non-cash one-time effect
Solid organic sales growth in Europe supported by ongoing recovery of elective treatments
Continued strong Emerging Markets growth driven primarily by Latin America; China slowing down due to price effects post successful participation in VBP tenders
EBIT outlook3 for FY/21 improved
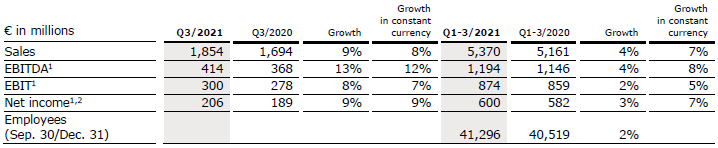
Sales increased by 9% (8% in constant currency) to €1,854 million (Q3/20: €1,694 million). Organic growth was 8%. In Q1-3/21, sales increased by 4% (7% in constant currency) to €5,370 million (Q1-3/20: €5,161 million). Organic growth was 6%. Negative currency translation effects of 3% in Q1-3 were mainly related to the weakness of the US dollar, the Argentinian peso and the Brazilian real.
Sales in North America increased by 6% (organic: 6%) to €589 million (Q3/20: €558 million) driven by extra demand for COVID-19 related products. In Q1-3/21, sales in North America decreased by 9% (organic: -4%) to €1,669 million (Q1-3/20: €1,827 million).
Sales in Europe increased by 7% (organic: 5%) to €620 million (Q3/20: €581 million) supported by the ongoing recovery of elective treatments. In Q1-3/21, sales in Europe increased by 6% (organic: 5%) to €1,880 million (Q1-3/20: €1,778 million).
1 Before special items 2 Net income attributable to shareholders of Fresenius SE & Co. KGaA 3 In constant currency
For a detailed overview of special items please see the reconciliation tables in the PDF document.
Sales in Asia-Pacific increased by 12% (organic: 8%) to €447 million (Q3/20: €399 million) mainly due to normalizing elective treatment activity in the region. In China, organic growth is slowing down due to initial negative price effects from successful participation in VBP (Volume-Based Purchasing) tenders as well as the demanding prior-year base. In Q1-3/21, sales in Asia-Pacific increased by 17% (organic: 16%) to €1,248 million (Q1-3/20: €1,069 million).
Sales in Latin America/Africa increased by 27% (organic: 27%) to €198 million (Q3/20: €156 million) due to ongoing COVID-19 related extra demand. In Q1-3/21, sales in Latin America/Africa increased by 18% (organic: 26%) to €573 million (Q1-3/20: €487 million).
EBIT1 increased by 8% (7% in constant currency) to €300 million (Q3/20: €278 million) with an EBIT margin of 16.2% (Q3/20: 16.4%). The increase in constant currency was primarily driven by the Emerging Markets and European businesses, tempered by an IP R&D write-off in North America. Adjusted for this one-time effect, North America returned to healthy growth. EBIT was supported by positive COVID-19 effects. In Q1-3/21, EBIT1 increased by 2% (5% in constant currency) to €874 million (Q1-3/20: €859 million) with an EBIT margin of 16.3% (Q1-3/20: 16.6%).
Net income1,2 increased by 9% (9% in constant currency) to €206 million (Q3/201: €189 million). In Q1-3/21, net income1,2 increased by 3% (7% in constant currency) to €600 million (Q1-3/201: €582 million).
Operating cash flow increased to €393 million (Q3/20: €225 million) with a margin of 21.2% (Q3/20: 13.3%) mainly due to a healthy operational performance. In Q1-3/21, operating cash flow increased to €868 million (Q1-3/20: €836 million) with a margin of 16.2% (Q1-3/20: 16.2%).
For FY/21, Fresenius Kabi improves its EBIT outlook. The company now projects EBIT1,3 growth in constant currency around the top end of its low single-digit percentage guidance range. The company continues to expect organic sales growth4 in a low-to-mid single-digit percentage range. Both sales and EBIT outlook include expected COVID-19 effects.
1 Before special items 2 Net income attributable to shareholders of Fresenius SE & Co. KGaA 3 FY/20 base: €1,095 million, before special items; FY/21: before special items 4 FY/20 base: €6,976 million
For a detailed overview of special items please see the reconciliation tables in the PDF document.
Fresenius Helios
Fresenius Helios is Europe's leading private hospital operator. The company comprises Helios Germany and Helios Spain. Helios Germany operates 89 hospitals, ~130 outpatient centers and 6 prevention centers. Helios Spain operates 47 hospitals, 86 outpatient centers and around 300 occupational risk prevention centers. In addition, the company is active in Latin America with 6 hospitals and as a provider of medical diagnostics and reproduction medicine worldwide.
Helios Germany with ongoing upward trend for elective treatments
Treatment activity at Helios Spain above pre-pandemic levels in most medical areas
Strong results in Latin America
FY/21 outlook confirmed
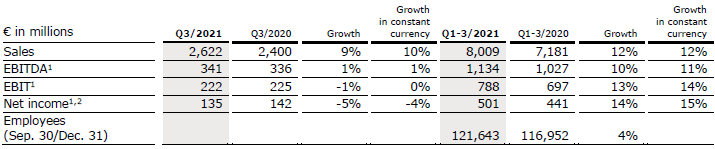
Sales increased by 9% (10% in constant currency) to €2,622 million (Q3/20: €2,400 million). Organic growth was 5%. Acquisitions, including the hospital acquisitions from the Order of Malta in Germany and the fertility business Eugin (consolidated as from April 1, 2021) contributed 5% to sales growth. In Q1-3/21, sales increased by 12% (12% in constant currency) to €8,009 million (Q1-3/20: €7,181 million). Organic growth was 7%. Acquisitions contributed 5% to sales growth.
Sales of Helios Germany increased by 7% (organic: 3%) to €1,640 million (Q3/20: €1,529 million) driven by positive price and case mix effects. The hospital acquisitions from the Order of Malta contributed 4% to sales growth. In Q1-3/21, sales of Helios Germany increased by 6% (organic: 2%) to €4,988 million (Q1-3/20: €4,703 million).
Sales of Helios Spain increased by 8% (9% in constant currency) to €941 million (Q3/20: €870 million). Organic growth of 8% was driven by a consistently high level of treatments and ongoing demand for occupational risk prevention (ORP) services. Furthermore, the hospitals in Latin America showed a good development and contributed 2% to sales growth. In Q1-3/21, sales of Helios Spain increased by 19% (20% in constant currency) to €2,937 million (Q1-3/20: €2,476 million). Organic growth was 18%.
1 Before special items 2 Net income attributable to shareholders of Fresenius SE & Co. KGaA
For a detailed overview of special items please see the reconciliation tables in the PDF document.
EBIT1 of Fresenius Helios decreased by 1% (0% in constant currency) to €222 million (Q3/20: €225 million) due to the demanding prior-year base at Helios Spain. The EBIT1 margin was 8.5% (Q3/20: 9.4%). In Q1-3/21, EBIT1 of Fresenius Helios increased by 13% (14% in constant currency) to €788 million (Q1-3/20: €697 million) with an EBIT margin1 of 9.8% (Q1-3/20: 9.7%).
EBIT1 of Helios Germany increased by 5% to €140 million (Q3/20: €133 million) with an EBIT margin1 of 8.5% (Q3/20: 8.7%). In Q1-3/21, EBIT1 of Helios Germany decreased by 1% to €442 million (Q1-3/20: €445 million) with an EBIT margin1 of 8.9% (Q1-3/20: 9.5%).
EBIT of Helios Spain decreased by 17% (-17% in constant currency) to €79 million (Q3/20: €95 million) due to an exceptional Q3/20 driven by post-lock-down catch-up effects. In addition, higher costs for personnel, personal protective equipment and selected medical products, among others, had a negative impact. The EBIT margin was 8.4% (Q3/20: 10.9%). The hospital acquisitions in Colombia contributed nicely. In Q1-3/21, EBIT of Helios Spain increased by 35% (36% in constant currency) to €352 million (Q1-3/20: €261 million) with an EBIT margin of 12.0% (Q1-3/20: 10.5%).
Net income1,2 decreased by 5% (-4% in constant currency) to €135 million (Q3/20: €142 million). In Q1-3/21, net income1,2 increased by 14% (15% in constant currency) to €501 million (Q1-3/20: €441 million).
Operating cash flow decreased to €157 million (Q3/20: €275 million) with a margin of 6.0% (Q3/20: 11.5%) as the previous year was supported by the accelerated payment scheme under the German law to ease the financial burden on hospitals. In Q1-3/21, operating cash flow decreased to €595 million (Q1-3/20: €715 million) with a margin of 7.4% (Q1-3/20: 10.0%).
For FY/21, Fresenius Helios confirms its outlook. The company expects organic sales3 growth in a mid single-digit percentage range. EBIT4 is projected to grow in a high single-digit percentage range in constant currency. Both sales and EBIT outlook include expected COVID-19 effects.
1 Before special items 2 Net income attributable to shareholders of Fresenius SE & Co. KGaA 3 FY/20 base: €9,818 million 4 FY/20 base: €1,025 million; FY/21 before special items
For a detailed overview of special items please see the reconciliation tables in the PDF document.
Fresenius Vamed
Fresenius Vamed manages projects and provides services for hospitals and other health care facilities worldwide and is a leading post-acute care provider in Central Europe. The portfolio ranges along the entire value chain: from project development, planning, and turnkey construction, via maintenance and technical management to total operational management.
Further acceleration of EBIT growth despite persistent COVID-19 impacts
Project business still marked by COVID-19; order book remains at all-time high
Good performance, particularly in the high-end service business; upward trend in elective treatments supports rehabilitation business
FY/21 outlook confirmed
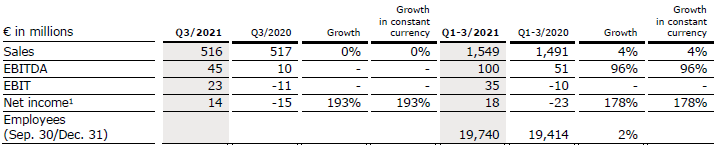
Sales remained stable (0% in constant currency and organic) at €516 million (Q3/20: €517 million). In Q1-3/21, sales increased by 4% (4% in constant currency) to €1,549 million (Q1-3/20: €1,491 million). Organic growth was 4%.
Sales in the service business increased by 9% (9% in constant currency) to €410 million (Q3/20: €377 million), driven by high-end services and growing case numbers in the rehabilitation business. Sales in the project business decreased by 24% (24% in constant currency) to €106 million (Q3/20: €140 million). In Q1-3/21, sales in the service business increased by 10% (10% in constant currency) to €1,165 million (Q1-3/20: €1,063 million). Sales in the project business decreased by 10% (-10% in constant currency) to €384 million (Q1-3/20: €428 million).
EBIT increased to €23 million (Q3/20: -€11 million) with an EBIT margin of 4.5% (Q3/20: -2.1%). In Q1-3/21, EBIT increased to €35 million (Q1-3/20: -€10 million) with an EBIT margin of 2.3% (Q1-3/20: -0.7%).
Net income1 increased to €14 million (Q3/20: -€15 million). In Q1-3/21, net income1 increased to €18 million (Q1-3/20: -€23 million).
1 Net income attributable to shareholders of VAMED AG
Order intake was €120 million in Q3/21 (Q3/20: €188 million) and €971 million in Q1-3/21 (Q1-3/20: €362 million), particularly driven by a turnkey project for a hospital in Wiener Neustadt, Austria. As of September 30, 2021, order backlog of €3,647 million (December 31, 2020: €3,055 million) remained at an all-time high.
Operating cash flow increased to €9 million (Q3/20: -€4 million) with a margin of 1.7% (Q3/20: -0.8%) mainly due to payments from the international project business. In Q1-3/21, operating cash flow increased to €23 million (Q1-3/20: €4 million) with a margin of 1.5% (Q1-3/20: 0.3%).
For FY/21, Fresenius Vamed confirms its outlook. The company expects organic sales1 growth in a mid-to-high single-digit percentage range and EBIT2 to grow to a high double-digit Euro million amount. Both sales and EBIT outlook include expected COVID-19 effects.
1 FY/20 base: €2,068 million 2 FY/20 base: €29 million; FY/21 before special items
Conference Call
As part of the publication of the results for Q3/21, a conference call will be held on November 2, 2021 at 1:30 p.m. CET (8:30 a.m. EDT). You are cordially invited to follow the conference call in a live broadcast over the Internet at www.fresenius.com/media-calendar . Following the call, a replay will be available on our website.
This release contains forward-looking statements that are subject to various risks and uncertainties. Future results could differ materially from those described in these forward-looking statements due to certain factors, e.g. changes in business, economic and competitive conditions, regulatory reforms, results of clinical trials, foreign exchange rate fluctuations, uncertainties in litigation or investigative proceedings, and the availability of financing. Fresenius does not undertake any responsibility to update the forward-looking statements in this release.
Fresenius Medical Care with stronger than projected COVID-19 related headwind
Fresenius Kabi improves EBIT1 outlook; North America returning to growth; Emerging Markets business with continued healthy financial performance
Helios Germany with ongoing upward trend for elective treatments; activity levels at Helios Spain above pre-pandemic levels
Fresenius Vamed with good performance in the service business; order book in the project business remains at all-time high
Cost and efficiency program on track; savings targets confirmed for FY/23
Fresenius raises FY/21 Group sales outlook; earnings now expected to be around the top-end of guidance
If no timeframe is specified, information refers to Q3/21.
1 In constant currency 2 Before special items 3 Net income attributable to shareholders of Fresenius SE & Co. KGaA
For a detailed overview of special items please see the reconciliation table in the PDF document.
Stephan Sturm, CEO of Fresenius, said: “More and more people being vaccinated against COVID-19 is good news. However, the pandemic remains very relevant. It has also more strongly impacted Fresenius and for longer than could have been foreseen. Yet despite this, we continue to grow and remain on track to achieve this year’s, again raised, targets. Launching the Group cost and efficiency program has proved to be the right decision: Our initiatives will help us to better absorb the burdens caused by the pandemic. At the same time, they will strengthen our foundations to thrive, long-term, in a challenging environment. The demand for high-quality, affordable healthcare will be even greater in the future. Fresenius will continue making an important contribution, while creating value for all stakeholders.”
COVID-19 assumptions for guidance FY/21
Negative COVID-19 effects at Fresenius have increased sequentially in Q3/21, driven by significant excess patient mortality at Fresenius Medical Care. Fresenius expects also Q4/21 to be impacted by COVID-19 effects. Meaningfully rising COVID-19 case numbers, the further evolution of virus mutations as well as stalling vaccination progress could impact Fresenius’ ability to achieve its FY/21 guidance. Additionally, Fresenius expects headwinds from cost inflation including rising commodity and shipping prices, increasing energy costs, as well as supply chain constraints in Q4/21. Hence, Fresenius remains vigilant.
Whilst the risk of renewed far-reaching containment measures in one or more of Fresenius’ major markets cannot be excluded, it now appears unlikely. Any resulting significant and direct impact on the health care sector without appropriate compensation is not reflected in the Group’s FY/21 guidance. These assumptions are subject to considerable uncertainty.
FY/21 Group sales guidance raised, earnings guidance improved
Based on the Group’s good Q3/21 results and the progress to improve Group-wide efficiencies, Fresenius raises its sales guidance and improves its earnings guidance. The Company now projects constant currency sales1 to grow in a mid single-digit range in FY/21. Previously, the Company projected sales1 growth in a low-to-mid single-digit percentage range in constant currency. Earnings2,3 growth in constant currency is now expected to be around the top-end of the low single-digit percentage range.
Implicitly, net income2 for the Group excluding Fresenius Medical Care is now expected to grow in a low double-digit percentage range in constant currency. Previously, Fresenius expected high single-digit percentage growth in constant currency.
The guidance implies ongoing COVID-19 related headwinds, primarily at Fresenius Medical Care, and increasingly noticeable cost inflation across selected markets in Q4/21. It also reflects negative pricing effects related to tender activity at Fresenius Kabi in China.
Based on expected lower contributions to Group EBITDA from Fresenius Medical Care as well as assumed cash phasing effects in Q4/21, Fresenius does not expect the net debt/EBITDA4 ratio of 3.55x as of September 30, 2021 to improve in Q4/21.
1 FY/20 base: €36,277 million 2 Net income attributable to shareholders of Fresenius SE & Co. KGaA 3 FY/20 base: €1,796 million, before special items; FY/21: before special items 4 At LTM average exchange rates for both net debt and EBITDA; pro forma closed acquisitions/divestitures; excluding further potential acquisitions; before special items
For a detailed overview of special items please see the reconciliation table in the PDF document.
Progress on efficiency measures to sustainably improve profitability
During Q3/21, Fresenius finalized the concept phase of its cost and efficiency program. At the same time, first initiatives were already implemented. Fresenius Medical Care is providing an update on its FME25 transformation program in addition to its Q3/21 results presentation. Fresenius confirms its expectation that the measures to sustainably enhance profitability and operational excellence to reach cost savings of more than €100 million p.a. after tax and minority interest in 2023, with some potential to increase thereafter.
Achieving these sustainable efficiencies will require significant up-front expenses. For the years 2021 to 2023, those expenses are expected to average more than €100 million p.a. after tax and minority interest, with the largest portion currently expected to materialize in 2022. They will be classified as special items, consistent with previous practice.
Fresenius expects significant contributions from all four business segments and from the corporate center in the 2021 to 2023 period. For FY/21, low double-digit million Euro savings after tax and minority interest from the Group’s cost and efficiency measures are expected to support the Group’s profitability. These savings and efficiency gains derive from activities in all four business segments.
5% sales increase in constant currency Group sales increased by 5% (5% in constant currency) to €9,324 million (Q3/20: €8,918 million). Organic growth was 3%. Acquisitions/divestitures contributed net 2% to growth. Currency translation had no effect on sales growth. Excluding estimated COVID-19 effects1, Group sales growth would have been 7% to 8% in constant currency.
In Q1-3/21, Group sales increased by 2% (5% in constant currency) to €27,554 million (Q1-3/20: €26,973 million). Organic growth was 4%. Acquisitions/divestitures contributed net 1% to growth. Currency translation reduced sales growth by 3%. Excluding estimated COVID-19 effects1, Group sales growth would have been 5% to 6% in constant currency.
2% net income2,3 increase in constant currency
Group EBITDA before special items decreased by 2% (-2% in constant currency) to €1,700 million (Q3/20: €1,729 million). Reported Group EBITDA was €1,667 million (Q3/20: €1,729 million).
In Q1-3/21, Group EBITDA before special items decreased by 5% (-1% in constant currency) to €5,002 million (Q1-3/20: €5,246 million). Reported Group EBITDA was €4,957 million (Q1-3/20: €5,246 million).
Group EBIT before special items decreased by 6% (-6% in constant currency) to €1,041 million (Q3/20: €1,113 million). The decrease is primarily due to COVID-19 related headwinds at Fresenius Medical Care. The EBIT margin before special items was 11.2% (Q3/20: 12.5%). Reported Group EBIT was €1,008 million (Q3/20: €1,113 million).
In Q1-3/21, Group EBIT before special items decreased by 8% (-5% in constant currency) to €3,080 million (Q1-3/20: €3,361 million). The constant currency decrease is primarily due to COVID-19 related headwinds at Fresenius Medical Care. The EBIT margin before special items was 11.2% (Q1-3/20: 12.5%). Reported Group EBIT was €3,035 million (Q1-3/20: €3,361 million).
1 For estimated COVID-19 effects please see table in the PDF document. 2 Before special items 3 Net income attributable to shareholders of Fresenius SE & Co. KGaA
For a detailed overview of special items please see the reconciliation table in the PDF document.
Group net interest before special items and reported net interest improved to -€126 million (Q3/202: -€154 million) mainly due to lower interest rates.
In Q1-3/21, Group net interest before special items improved to -€384 million (Q1-3/202: -€495 million). Reported Group net interest improved to -€384 million (Q1-3/20: -€503 million).
Group tax rate before special items was 23.0% (Q3/202: 22.0%) while reported Group tax rate was 22.8% (Q3/20: 22.0%).
In Q1-3/21, Group tax rate before special items was 22.4% (Q1-3/202: 22.7%) while reported Group tax rate was 22.3% (Q1-3/20: 22.7%).
Noncontrolling interests before special items were -€270 million (Q3/20: -€321 million) of which 91% were attributable to the noncontrolling interests in Fresenius Medical Care. Reported noncontrolling interests were -€268 million (Q3/20: -€321 million).
In Q1-3/21, noncontrolling interests before special items were -€747 million (Q1-3/20: -€913 million) of which 91% were attributable to the noncontrolling interests in Fresenius Medical Care. Reported noncontrolling interests were -€741 million (Q3/20: -€913 million).
Group net income1 before special items increased by 2% (2% in constant currency) to €435 million (Q3/202: €427 million) driven by Fresenius Vamed and Fresenius Kabi as well as by the favorable net interest development. Excluding estimated COVID-19 effects3, Group net income1 before special items would have grown 12% to 16% in constant currency. Reported Group net income1 decreased to €413 million (Q3/20: €427 million).
In Q1-3/21, Group net income1 before special items increased by 3% (6% in constant currency) to €1,345 million (Q1-3/202: €1,302 million). Excluding estimated COVID-19 effects3, Group net income1 before special items would have grown 7% to 11% in constant currency. Reported Group net income1 increased to €1,319 million (Q1-3/20: €1,297 million).
1 Net income attributable to shareholders of Fresenius SE & Co. KGaA 2 Before special items 3 For estimated COVID-19 effects please see table in the PDF document.
For a detailed overview of special items please see the reconciliation table in the PDF document.
Earnings per share1 before special items increased by 1% (1% in constant currency) to €0.78 (Q3/202: €0.77). Reported earnings per share1 were €0.74 (Q3/20: €0.77).
In Q1-3/21, earnings per share1 before special items increased by 3% (6% in constant currency) to €2.41 (Q1-3/202: €2.34). Reported earnings per share1 were €2.36 (Q1-3/20: €2.33).
Continued investment in growth
Spending on property, plant and equipment was €449 million corresponding to 5% of sales (Q3/20: €521 million; 6% of sales). These investments served primarily for the modernization and expansion of dialysis clinics, production facilities as well as hospitals and day clinics.
In Q1-3/21, spending on property, plant and equipment was €1,342 million corresponding to 5% of sales (Q1-3/20: €1,542 million; 6% of sales).
Total acquisition spending was €167 million (Q3/20: €142 million). In Q1-3/21, total acquisition spending was €807 million (Q1-3/20: €651 million) mainly for the acquisition of Eugin Group at Fresenius Helios which has been consolidated since April 1, 2021, and the acquisition of dialysis clinics at Fresenius Medical Care.
Cash flow development
Group operating cash flow increased to €1,226 million (Q3/20: €1,199 million) with a margin of 13.1% (Q3/20: 13.4%). Free cash flow before acquisitions and dividends increased correspondingly to €793 million (Q3/20: €682 million). Free cash flow after acquisitions and dividends increased to €594 million (Q3/20: -€185 million).
In Q1-3/21, Group operating cash flow decreased to €3,329 million (Q1-3/20: €5,159 million) with a margin of 12.1% (Q1-3/20: 19.1%). The decrease was mainly due to continued recoupment of the U.S. federal government’s payments under the CARES Act in Q2/20. Free cash flow before acquisitions and dividends decreased to €1,986 million (Q1-3/20: €3,593 million). Free cash flow after acquisitions and dividends decreased to €352 million (Q1-3/20: €2,149 million).
1 Net income attributable to shareholders of Fresenius SE & Co. KGaA 2 Before Special items
Solid balance sheet structure
Group total assets increased by 7% (4% in constant currency) to €71,081 million (Dec. 31, 2020: €66,646 million) given the expansion of business activities and currency effects. Current assets increased by 10% (7% in constant currency) to €17,334 million (Dec. 31, 2020: €15,772 million) driven by the increase of cash and cash equivalents, trade accounts receivables, and inventories. Non-current assets increased by 6% (3% in constant currency) to €53,747 million (Dec. 31, 2020: €50,874 million).
Total shareholders’ equity increased by 8% (4% in constant currency) to €28,186 million (Dec. 31, 2020: €26,023 million). The equity ratio was 39.7% (Dec. 31, 2020: 39.0%).
Group debt increased by 5% (3% in constant currency) to €27,191 million (Dec. 31, 2020: € 25,913 million). Group net debt increased by 3% (1% in constant currency) to € 24,778 million (Dec. 31, 2020: € 24,076 million).
As of September 30, 2021, the net debt/EBITDA ratio increased to 3.55x1,2 (Dec. 31, 2020: 3.44x1,2) driven by COVID-19 effects weighing on EBITDA as well as increased net debt. The improvement over June 30, 2021 (3.60x1,2) is driven by the reduction of net debt in Q3/21 due to the good cash flow performance.
1 At LTM average exchange rates for both net debt and EBITDA; pro forma closed acquisitions/divestitures 2 Before special items
For a detailed overview of special items please see the reconciliation table in the PDF document.
Business Segments
Fresenius Medical Care (Financial data according to Fresenius Medical Care press release)
Fresenius Medical Care is the world's largest provider of products and services for individuals with renal diseases. As of September 30, 2021, Fresenius Medical Care was treating approximately 345,000 patients in 4,151 dialysis clinics. Along with its core business, the Renal Care Continuum, the company focuses on expanding in complementary areas and in the field of critical care.
Stronger than projected headwind from COVID-19 effects with significantly increased patient excess mortality due to global spread of Delta variant
Organic growth continued with 1%
Financial targets for FY 2021 confirmed, expectation to reach lower end of the guidance ranges for revenue and net income
Sales of Fresenius Medical Care increased by 1% (increased by 1% in constant currency) to €4,441 million (Q3/20: €4,414 million). Organic growth was 1%. In Q1-3/21, sales of Fresenius Medical Care decreased by 4% (increased by 2% in constant currency) to €12,972 million (Q1-3/20: €13,459 million). Thus, currency translation had a negative effect of 6%. Organic growth was 1%.
EBIT decreased by 20% (-19% in constant currency) to €505 million (Q3/20: €632 million) resulting in a margin of 11.4% (Q3/20: 14.3%). EBIT before special items declined by 19% to €510 million (-19% in constant currency; Q3/20: €632 million), resulting in a margin of 11.5% (Q3/20: 14.3%). The decline was mainly due to adverse COVID-19-related effects, inflationary cost increases and higher labor costs. These effects were slightly mitigated by an improved U.S. payor mix, in particular due to an increased number of patients with Medicare Advantage coverage.
In Q1-3/21, EBIT decreased by 24% (-20% in constant currency) to €1,403 million (Q1-3/20: €1,843 million) resulting in a margin of 10.8% (Q1-3/20: 13.7%). EBIT before special items decreased by 23% (-19% in constant currency) to €1,417 million (Q1-3/20: €1,843 million) resulting in an EBIT margin before special items of 10.9% (Q1-3/20: 13.7%).
1 Before special items 2 Net income attributable to shareholders of Fresenius Medical Care AG & Co. KGaA
For a detailed overview of special items please see the reconciliation tables in the PDF document.
Net income1 decreased by 23% (-22% in constant currency) to €273 million (Q3/20: €354 million) mainly due to effects explained for operating income and a higher tax rate. Net income1 before special items decreased by 22% (-21% in constant currency) to €277 million (Q3/20: €354 million).
In Q1-3/21, net income1 decreased by 25% (-21% in constant currency) to €741 million (Q1-3/20: €987 million). Net income1 before special items decreased by 24% (-20% in constant currency) to €751 million (Q1-3/20: €987 million).
Operating cash flow was €692 million (Q3/20: €746 million) with a margin of 15.6% (Q3/20: 16.9%). The decrease was mainly due to continued recoupment of the U.S. federal government’s payments in the second quarter of 2020 under the CARES Act. In Q1-3/21, operating cash flow was €1,820 million (Q1-3/20: €3,649 million) with a margin of 14.0% (Q1-3/20: 27.1%).
For FY/21, Fresenius Medical Care confirms its outlook for revenue2 to grow at a low-to-mid single-digit percentage rate and net income1,3 to decline at a high-teens to mid-twenties percentage rate against the 2020 base and is now expecting to be at the lower end of these guidance ranges4.
1 Net income attributable to shareholders of Fresenius Medical Care AG & Co. KGaA 2 FY/20 base: €17,859 million 3 FY/20 base: €1,359 million, before special items; FY/21: before special items 4 These targets are based on the 2020 results excluding the impairment of goodwill and trade names in the Latin America Segment of €195 million. They are inclusive of anticipated COVID-19 effects, in constant currency and exclude special items. Special items include costs related to FME25 and other effects that are unusual in nature and have not been foreseeable or not foreseeable in size or impact at the time of giving guidance.
For a detailed overview of special items please see the reconciliation tables in the PDF document.
Fresenius Kabi
Fresenius Kabi offers intravenously administered generic drugs, clinical nutrition and infusion therapies for seriously and chronically ill patients in the hospital and outpatient environments. The company is also a leading supplier of medical devices and transfusion technology products. In the biosimilars business, Fresenius Kabi develops products with a focus on oncology and autoimmune diseases.
North America with healthy organic sales growth; EBIT growth only hindered by a non-cash one-time effect
Solid organic sales growth in Europe supported by ongoing recovery of elective treatments
Continued strong Emerging Markets growth driven primarily by Latin America; China slowing down due to price effects post successful participation in VBP tenders
EBIT outlook3 for FY/21 improved
Sales increased by 9% (8% in constant currency) to €1,854 million (Q3/20: €1,694 million). Organic growth was 8%. In Q1-3/21, sales increased by 4% (7% in constant currency) to €5,370 million (Q1-3/20: €5,161 million). Organic growth was 6%. Negative currency translation effects of 3% in Q1-3 were mainly related to the weakness of the US dollar, the Argentinian peso and the Brazilian real.
Sales in North America increased by 6% (organic: 6%) to €589 million (Q3/20: €558 million) driven by extra demand for COVID-19 related products. In Q1-3/21, sales in North America decreased by 9% (organic: -4%) to €1,669 million (Q1-3/20: €1,827 million).
Sales in Europe increased by 7% (organic: 5%) to €620 million (Q3/20: €581 million) supported by the ongoing recovery of elective treatments. In Q1-3/21, sales in Europe increased by 6% (organic: 5%) to €1,880 million (Q1-3/20: €1,778 million).
1 Before special items 2 Net income attributable to shareholders of Fresenius SE & Co. KGaA 3 In constant currency
For a detailed overview of special items please see the reconciliation tables in the PDF document.
Sales in Asia-Pacific increased by 12% (organic: 8%) to €447 million (Q3/20: €399 million) mainly due to normalizing elective treatment activity in the region. In China, organic growth is slowing down due to initial negative price effects from successful participation in VBP (Volume-Based Purchasing) tenders as well as the demanding prior-year base. In Q1-3/21, sales in Asia-Pacific increased by 17% (organic: 16%) to €1,248 million (Q1-3/20: €1,069 million).
Sales in Latin America/Africa increased by 27% (organic: 27%) to €198 million (Q3/20: €156 million) due to ongoing COVID-19 related extra demand. In Q1-3/21, sales in Latin America/Africa increased by 18% (organic: 26%) to €573 million (Q1-3/20: €487 million).
EBIT1 increased by 8% (7% in constant currency) to €300 million (Q3/20: €278 million) with an EBIT margin of 16.2% (Q3/20: 16.4%). The increase in constant currency was primarily driven by the Emerging Markets and European businesses, tempered by an IP R&D write-off in North America. Adjusted for this one-time effect, North America returned to healthy growth. EBIT was supported by positive COVID-19 effects. In Q1-3/21, EBIT1 increased by 2% (5% in constant currency) to €874 million (Q1-3/20: €859 million) with an EBIT margin of 16.3% (Q1-3/20: 16.6%).
Net income1,2 increased by 9% (9% in constant currency) to €206 million (Q3/201: €189 million). In Q1-3/21, net income1,2 increased by 3% (7% in constant currency) to €600 million (Q1-3/201: €582 million).
Operating cash flow increased to €393 million (Q3/20: €225 million) with a margin of 21.2% (Q3/20: 13.3%) mainly due to a healthy operational performance. In Q1-3/21, operating cash flow increased to €868 million (Q1-3/20: €836 million) with a margin of 16.2% (Q1-3/20: 16.2%).
For FY/21, Fresenius Kabi improves its EBIT outlook. The company now projects EBIT1,3 growth in constant currency around the top end of its low single-digit percentage guidance range. The company continues to expect organic sales growth4 in a low-to-mid single-digit percentage range. Both sales and EBIT outlook include expected COVID-19 effects.
1 Before special items 2 Net income attributable to shareholders of Fresenius SE & Co. KGaA 3 FY/20 base: €1,095 million, before special items; FY/21: before special items 4 FY/20 base: €6,976 million
For a detailed overview of special items please see the reconciliation tables in the PDF document.
Fresenius Helios
Fresenius Helios is Europe's leading private hospital operator. The company comprises Helios Germany and Helios Spain. Helios Germany operates 89 hospitals, ~130 outpatient centers and 6 prevention centers. Helios Spain operates 47 hospitals, 86 outpatient centers and around 300 occupational risk prevention centers. In addition, the company is active in Latin America with 6 hospitals and as a provider of medical diagnostics and reproduction medicine worldwide.
Helios Germany with ongoing upward trend for elective treatments
Treatment activity at Helios Spain above pre-pandemic levels in most medical areas
Strong results in Latin America
FY/21 outlook confirmed
Sales increased by 9% (10% in constant currency) to €2,622 million (Q3/20: €2,400 million). Organic growth was 5%. Acquisitions, including the hospital acquisitions from the Order of Malta in Germany and the fertility business Eugin (consolidated as from April 1, 2021) contributed 5% to sales growth. In Q1-3/21, sales increased by 12% (12% in constant currency) to €8,009 million (Q1-3/20: €7,181 million). Organic growth was 7%. Acquisitions contributed 5% to sales growth.
Sales of Helios Germany increased by 7% (organic: 3%) to €1,640 million (Q3/20: €1,529 million) driven by positive price and case mix effects. The hospital acquisitions from the Order of Malta contributed 4% to sales growth. In Q1-3/21, sales of Helios Germany increased by 6% (organic: 2%) to €4,988 million (Q1-3/20: €4,703 million).
Sales of Helios Spain increased by 8% (9% in constant currency) to €941 million (Q3/20: €870 million). Organic growth of 8% was driven by a consistently high level of treatments and ongoing demand for occupational risk prevention (ORP) services. Furthermore, the hospitals in Latin America showed a good development and contributed 2% to sales growth. In Q1-3/21, sales of Helios Spain increased by 19% (20% in constant currency) to €2,937 million (Q1-3/20: €2,476 million). Organic growth was 18%.
1 Before special items 2 Net income attributable to shareholders of Fresenius SE & Co. KGaA
For a detailed overview of special items please see the reconciliation tables in the PDF document.
EBIT1 of Fresenius Helios decreased by 1% (0% in constant currency) to €222 million (Q3/20: €225 million) due to the demanding prior-year base at Helios Spain. The EBIT1 margin was 8.5% (Q3/20: 9.4%). In Q1-3/21, EBIT1 of Fresenius Helios increased by 13% (14% in constant currency) to €788 million (Q1-3/20: €697 million) with an EBIT margin1 of 9.8% (Q1-3/20: 9.7%).
EBIT1 of Helios Germany increased by 5% to €140 million (Q3/20: €133 million) with an EBIT margin1 of 8.5% (Q3/20: 8.7%). In Q1-3/21, EBIT1 of Helios Germany decreased by 1% to €442 million (Q1-3/20: €445 million) with an EBIT margin1 of 8.9% (Q1-3/20: 9.5%).
EBIT of Helios Spain decreased by 17% (-17% in constant currency) to €79 million (Q3/20: €95 million) due to an exceptional Q3/20 driven by post-lock-down catch-up effects. In addition, higher costs for personnel, personal protective equipment and selected medical products, among others, had a negative impact. The EBIT margin was 8.4% (Q3/20: 10.9%). The hospital acquisitions in Colombia contributed nicely. In Q1-3/21, EBIT of Helios Spain increased by 35% (36% in constant currency) to €352 million (Q1-3/20: €261 million) with an EBIT margin of 12.0% (Q1-3/20: 10.5%).
Net income1,2 decreased by 5% (-4% in constant currency) to €135 million (Q3/20: €142 million). In Q1-3/21, net income1,2 increased by 14% (15% in constant currency) to €501 million (Q1-3/20: €441 million).
Operating cash flow decreased to €157 million (Q3/20: €275 million) with a margin of 6.0% (Q3/20: 11.5%) as the previous year was supported by the accelerated payment scheme under the German law to ease the financial burden on hospitals. In Q1-3/21, operating cash flow decreased to €595 million (Q1-3/20: €715 million) with a margin of 7.4% (Q1-3/20: 10.0%).
For FY/21, Fresenius Helios confirms its outlook. The company expects organic sales3 growth in a mid single-digit percentage range. EBIT4 is projected to grow in a high single-digit percentage range in constant currency. Both sales and EBIT outlook include expected COVID-19 effects.
1 Before special items 2 Net income attributable to shareholders of Fresenius SE & Co. KGaA 3 FY/20 base: €9,818 million 4 FY/20 base: €1,025 million; FY/21 before special items
For a detailed overview of special items please see the reconciliation tables in the PDF document.
Fresenius Vamed
Fresenius Vamed manages projects and provides services for hospitals and other health care facilities worldwide and is a leading post-acute care provider in Central Europe. The portfolio ranges along the entire value chain: from project development, planning, and turnkey construction, via maintenance and technical management to total operational management.
Further acceleration of EBIT growth despite persistent COVID-19 impacts
Project business still marked by COVID-19; order book remains at all-time high
Good performance, particularly in the high-end service business; upward trend in elective treatments supports rehabilitation business
FY/21 outlook confirmed
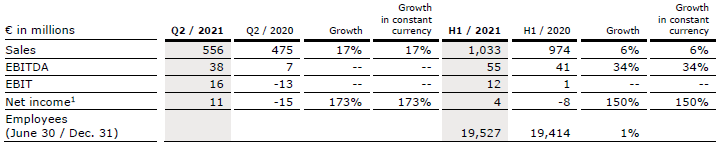
Sales remained stable (0% in constant currency and organic) at €516 million (Q3/20: €517 million). In Q1-3/21, sales increased by 4% (4% in constant currency) to €1,549 million (Q1-3/20: €1,491 million). Organic growth was 4%.
Sales in the service business increased by 9% (9% in constant currency) to €410 million (Q3/20: €377 million), driven by high-end services and growing case numbers in the rehabilitation business. Sales in the project business decreased by 24% (24% in constant currency) to €106 million (Q3/20: €140 million). In Q1-3/21, sales in the service business increased by 10% (10% in constant currency) to €1,165 million (Q1-3/20: €1,063 million). Sales in the project business decreased by 10% (-10% in constant currency) to €384 million (Q1-3/20: €428 million).
EBIT increased to €23 million (Q3/20: -€11 million) with an EBIT margin of 4.5% (Q3/20: -2.1%). In Q1-3/21, EBIT increased to €35 million (Q1-3/20: -€10 million) with an EBIT margin of 2.3% (Q1-3/20: -0.7%).
Net income1 increased to €14 million (Q3/20: -€15 million). In Q1-3/21, net income1 increased to €18 million (Q1-3/20: -€23 million).
1 Net income attributable to shareholders of VAMED AG
Order intake was €120 million in Q3/21 (Q3/20: €188 million) and €971 million in Q1-3/21 (Q1-3/20: €362 million), particularly driven by a turnkey project for a hospital in Wiener Neustadt, Austria. As of September 30, 2021, order backlog of €3,647 million (December 31, 2020: €3,055 million) remained at an all-time high.
Operating cash flow increased to €9 million (Q3/20: -€4 million) with a margin of 1.7% (Q3/20: -0.8%) mainly due to payments from the international project business. In Q1-3/21, operating cash flow increased to €23 million (Q1-3/20: €4 million) with a margin of 1.5% (Q1-3/20: 0.3%).
For FY/21, Fresenius Vamed confirms its outlook. The company expects organic sales1 growth in a mid-to-high single-digit percentage range and EBIT2 to grow to a high double-digit Euro million amount. Both sales and EBIT outlook include expected COVID-19 effects.
1 FY/20 base: €2,068 million 2 FY/20 base: €29 million; FY/21 before special items
Conference Call
As part of the publication of the results for Q3/21, a conference call will be held on November 2, 2021 at 1:30 p.m. CET (8:30 a.m. EDT). All investors are cordially invited to follow the conference call in a live broadcast over the Internet at www.fresenius.com/investors. Following the call, a replay will be available on our website.
This release contains forward-looking statements that are subject to various risks and uncertainties. Future results could differ materially from those described in these forward-looking statements due to certain factors, e.g. changes in business, economic and competitive conditions, regulatory reforms, results of clinical trials, foreign exchange rate fluctuations, uncertainties in litigation or investigative proceedings, and the availability of financing. Fresenius does not undertake any responsibility to update the forward-looking statements in this release.
Fresenius Medical Care with expected continued COVID-19 impact; patient excess mortality rates significantly reduced
Fresenius Kabi’s strong Emerging Markets business more than offsets persistent headwinds in North America
Helios Germany with gradually increasing elective treatment volumes; Helios Spain delivers outstanding sales and earnings growth based on strong activity levels and a weak prior-year quarter
Fresenius Vamed back to growth driven by good performance in the service business; growing order book in the project business
First savings from initiatives to improve efficiency already expected in 202
If no timeframe is specified, information refers to Q2/2021.
1Before special items 2Net income attributable to shareholders of Fresenius SE & Co. KGaA
Stephan Sturm, CEO of Fresenius, said: “Overall, our interim result for the 2021 business year is very strong. We have achieved very healthy sales and earnings growth, despite the ongoing impact of the pandemic. Our businesses are developing well, and we are making good progress on our initiatives for profitable growth and increased efficiency. The increased vaccination rates in many of our important markets are encouraging, but of course the pandemic is not over yet. We must remain vigilant and will continue to monitor the infection situation very closely. Nevertheless, there are reasons for us to be optimistic: Our growth drivers are intact, good health is and will remain of paramount importance to everyone. We will continue the review of our structures, and to drive efficiency measures along with our growth initiatives. The resulting benefits will allow us to sustainably develop our healthcare group even more successfully.”
COVID-19 assumptions for guidance FY/21
Whilst the pandemic exhibited a quite differentiated regional development, negative COVID-effects have - consistent with expectations - generally receded during Q2/21.
Fresenius had projected that the burdens and constraints caused by the pandemic will recede in the second half of the year. Now, however, the currently rising number of COVID-19 cases, the further evolution of COVID-19 virus mutations as well as stalling vaccination progress could all pose a threat to this assumption, and the company remains vigilant.
Whilst the risk of renewed far-reaching containment measures in one or more of Fresenius’ major markets currently appears less likely, it cannot be excluded. Any resulting significant and direct impact on the health care sector without appropriate compensation is not reflected in the Group’s FY/21 guidance. These assumptions are subject to considerable uncertainty.
FY/21 Group earnings guidance raised
Based on the Group’s strong Q2/21 and the progress in the program to improve Group-wide efficiencies, where the company expects first savings already this year, Fresenius raises its 2021 earnings guidance. The Company now projects net income1,2 to grow in a low single-digit percentage range in constant currency. Previously, Fresenius expected an at least broadly stable net income1,2 development in constant currency. The Company continues to project sales growth3 in a low-to-mid single-digit percentage range in constant currency.
Implicitly, net income1 for the Group excluding Fresenius Medical Care is now expected to grow in a high single-digit percentage range in constant currency. Previously, Fresenius expected mid-to-high single-digit percentage growth in constant currency.
The guidance implies ongoing COVID-19 related headwinds in the second half of the year. It reflects negative pricing effects related to tender activity at Fresenius Kabi in China as well as increasingly noticeable cost inflation effects across selected markets.
Fresenius projects net debt/EBITDA4 to be around the top-end of the self-imposed target corridor of 3.0x to 3.5x by the end of FY/21.
1 Net income attributable to shareholders of Fresenius SE & Co. KGaA 2 FY/20 base: €1,796 million, before special items; FY/21: before special items 3 FY/20 base: €36,277 million 4 At LTM average exchange rates for both net debt and EBITDA; pro forma closed acquisitions/divestitures; excluding further potential acquisitions; before special items
For a detailed overview of special items please see the reconciliation table in the PDF document.
Progress on efficiency measures to sustainably improve profitability
To sustainably enhance profitability and operational excellence, Fresenius has launched group-wide efficiency initiatives. These measures are expected to gradually result in cost savings of more than €100 million p.a. after tax and minority interest in 2023, with some potential to increase thereafter.
While an update on the comprehensive operating model review at Fresenius Medical Care is expected to be provided in fall 2021, the three other Fresenius business segments have already identified and launched initiatives in defined areas.
At Fresenius Kabi, these initiatives comprise the optimization of its production network, reduction of product portfolio complexity, centralization of worldwide purchasing and review of organizational and cost structures.
Fresenius Helios will put a focus on its strategic review of the hospital portfolio and ambulatory care network as well as on the reduction of G&A costs.
Fresenius Vamed will implement some dedicated structural and organizational measures, comprising the optimization of its global subsidiary structure, the review of its assets and shareholdings portfolio and the optimization of procurement and G&A costs.
These activities specific to the business segments will be complemented and supported by initiatives on the Fresenius group level, for example, the implementation of new ways of working at the corporate headquarters as well as a group-wide review of the IT operating model.
Achieving these sustainable efficiencies will require significant up-front expenses. For the years 2021 to 2023, those expenses are expected to be more than €100 million p.a. after tax and minority interest on average, with the largest portion currently expected to materialize in 2022. They will be classified as special items, consistent with previous practice.
The company expects significant contributions from all four business segments and from the corporate center in the 2021 to 2023 period. Hence, it is expected that the savings contributed by Fresenius Medical Care will not be overproportional.
For FY/21, initial low double-digit million € savings after tax and minority interest from the Group’s above outlined cost and efficiency measures are expected to support the Group’s profitability. These savings and efficiency gains derive from activities in all four business segments.
Stephan Sturm, CEO of Fresenius, said: “We examine possible cost reductions with great care; and we implement them in a very targeted way, with a sense of proportion. We are saving because we have goals and want to realize them: We want to give ever more people access to ever better medicine. We want to contribute to keeping – or making – people healthy, to helping people enjoy their lives despite an illness. That is why we have a responsibility to use our valuable resources carefully. We will prioritize resources where they can have the biggest impact, remove duplication, and stop activities where results are not satisfying. This fitness program will benefit everyone: Our patients, the healthcare system, our employees and our shareholders.”
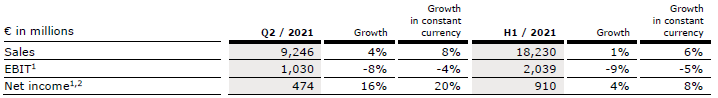
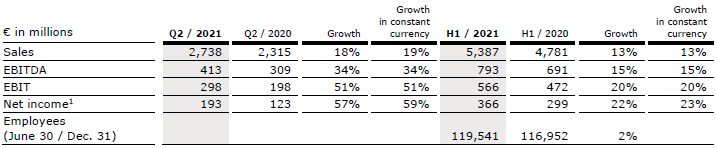
8% sales increase in constant currency Group sales increased by 4% (8% in constant currency) to €9,246 million (Q2/20: €8,920 million). Organic growth was 6%. Acquisitions/divestitures contributed net 2% to growth. Currency translation reduced sales growth by 4%. Excluding estimated COVID-19 effects1, Group sales growth would have been 6% to 7% in constant currency. In H1/21, Group sales increased by 1% (6% in constant currency) to €18,230 million (H1/20: €18,055 million). Organic growth was 4%. Acquisitions/divestitures contributed net 2% to growth. Currency translation reduced sales growth by 5%. Excluding estimated COVID-19 effects1, Group sales growth would have been 5% to 6% in constant currency.
20% net income2,3 increase in constant currency
Group EBITDA before special items decreased by 5% (0% in constant currency) to €1,671 million (Q2/20: €1,762 million). Reported Group EBITDA was €1,662 million (Q2/20: €1,762 million).
In H1/21, Group EBITDA before special items decreased by 6% (-1% in constant currency) to €3,302 million (H1/20: €3,517 million). Reported Group EBITDA was €3,290 million (H1/20: €3,517 million).
Group EBIT before special items decreased by 8% (-4% in constant currency) to €1,030 million (Q2/20: €1,123 million). The constant currency decrease is primarily due to COVID-19 related headwinds at Fresenius Medical Care. The EBIT margin before special items was 11.1% (Q2/20: 12.6%). Reported Group EBIT was €1,021 million (Q2/20: €1,123 million).
In H1/21, Group EBIT before special items decreased by 9% (-5% in constant currency) to €2,039 million (H1/20: €2,248 million). The constant currency decrease is primarily due to COVID-19 related headwinds at Fresenius Medical Care. The EBIT margin before special items was 11.2% (Q1/20: 12.5%). Reported Group EBIT was €2,027 million (H1/20: €2,248 million).
1 For estimated COVID-19 effects please see table in the PDF document 2 Before special items 3 Net income attributable to shareholders of Fresenius SE & Co. KGaA
For a detailed overview of special items please see the reconciliation table in the PDF document.
Group net interest before special items and reported net interest improved to -€121 million (Q2/202: -€167 million) mainly due to successful refinancing activities, lower interest rates as well as currency translation effects. In H1/21, Group net interest before special items improved to -€258 million (H1/202: -€341 million). Reported Group net interest improved to -€258 million (H1/20: -€349 million).
Group tax rate before special items was 21.5% (Q2/202: 23.5%) while reported Group tax rate was 21.3% (Q2/20: 23.4%). In H1/21, Group tax rate before special items was 22.1% (H1/202: 23.1%) while reported Group tax rate was 22.0% (H1/20: 23.0%).
Noncontrolling interests before special items were -€240 million (Q2/20: -€321 million) of which 89% were attributable to the noncontrolling interests in Fresenius Medical Care. Reported noncontrolling interests were -€237 million (Q2/20: -€321 million). In H1/21, noncontrolling interests before special items were -€477 million (H1/20: -€592 million) of which 92% were attributable to the noncontrolling interests in Fresenius Medical Care. Reported noncontrolling interests were -€473 million (Q2/20: -€592 million).
Group net income1 before special items increased by 16% (20% in constant currency) to €474 million (Q2/202: €410 million) driven by Helios Spain, Kabi’s Emerging Markets business as well as the favorable net interest development. Excluding estimated COVID-19 effects3, Group net income1 before special items would have grown 10% to 14% in constant currency. Reported Group net income1 increased to €471 million (Q2/20: €411 million).
In H1/21, Group net income1 before special items increased by 4% (8% in constant currency) to €910 million (H1/202: €875 million). Excluding estimated COVID-19 effects3, Group net income1 before special items would have grown 4% to 8% in constant currency. Reported Group net income1 increased to €906 million (H1/20: €870 million).
1 Net income attributable to shareholders of Fresenius SE & Co. KGaA 2 Before special items 3 For estimated COVID-19 effects please see table in the PDF document.
For a detailed overview of special items please see the reconciliation table in the PDF document.
Earnings per share1 before special items increased by 15% (19% in constant currency) to €0.85 (Q2/202: €0.74). Reported earnings per share1 were €0.84 (Q2/20: €0.74). In H1/21, earnings per share1 before special items increased by 4% (8% in constant currency) to €1.63 (H1/202: €1.57). Reported earnings per share1 were €1.62 (H1/20: €1.56).
Continued investment in growth
Spending on property, plant and equipment was €509 million corresponding to 6% of sales (Q2/20: €474 million; 5% of sales). These investments served primarily for the modernization and expansion of dialysis clinics, production facilities as well as hospitals and day clinics. In H1/21, spending on property, plant and equipment was €893 million corresponding to 5% of sales (H1/20: €1,021 million; 6% of sales).
Total acquisition spending was €491 million (Q2/20: €97 million) mainly for the acquisition of Eugin Group at Fresenius Helios which has been consolidated since April 1, 2021, and the acquisition of dialysis clinics at Fresenius Medical Care. In H1/21, total acquisition spending was €640 million (H1/20: €509 million).
Cash flow development
Group operating cash flow decreased to €1,451 million (Q2/20: €3,082 million) with a margin of 15.7% (Q2/20: 34.6%). The decline was mainly due to the U.S. federal government’s payments in Q2/20 under the CARES Act, the start of recoupment of these advanced payments in Q2/21 as well as the timing of certain other expense payments in 2021 at Fresenius Medical Care. Free cash flow before acquisitions and dividends decreased correspondingly to €952 million (Q2/20: €2,606 million). Free cash flow after acquisitions and dividends decreased to -€359 million (Q2/20: €2,374 million).
In H1/21, Group operating cash flow decreased to €2,103 million (H1/20: €3,960 million) with a margin of 11.5% (H1/20: 21.9%). Free cash flow before acquisitions and dividends decreased to €1,193 million (H1/20: €2,911 million). Free cash flow after acquisitions and dividends decreased to -€242 million (H1/20: €2,334 million).
1 Net income attributable to shareholders of Fresenius SE & Co. KGaA 2 Before Special items
Solid balance sheet structure
Group total assets increased by 5% (3% in constant currency) to €69,655 million (Dec. 31, 2020: €66,646 million) given the expansion of business activities and currency effects. Current assets increased by 7% (6% in constant currency) to €16,901 million (Dec. 31, 2020: €15,772 million) mainly driven by the increase of trade accounts receivables, cash and cash equivalents and inventories. Non-current assets increased by 4% (2% in constant currency) to €52,754 million (Dec. 31, 2020: €50,874 million).
Total shareholders’ equity increased by 4% (2% in constant currency) to €27,131 million (Dec. 31, 2020: €26,023 million). The equity ratio was 39.0% (Dec. 31, 2020: 39.0%).
Group debt increased by 5% (4% in constant currency) to €27,289 million (Dec. 31, 2020: € 25,913 million). Group net debt increased by 4% (3% in constant currency) to € 25,039 million (Dec. 31, 2020: € 24,076 million).
As of June 30, 2021, the net debt/EBITDA ratio increased to 3.60x1,2 (Dec. 31, 2020: 3.44x1,2) driven by COVID-19 effects weighing on EBITDA as well as increased net debt.
1 At LTM average exchange rates for both net debt and EBITDA; pro forma closed acquisitions/divestitures 2 Before special items
For a detailed overview of special items please see the reconciliation table in the PDF document.
Number of employees
As of June 30, 2021, the Fresenius Group had 312,734 employees worldwide (December 31, 2020: 311,269).
Business Segments
Fresenius Medical Care (Financial data according to Fresenius Medical Care press release)
Fresenius Medical Care is the world's largest provider of products and services for individuals with renal diseases. As of June 30, 2021, Fresenius Medical Care was treating approximately 346,000 patients in more than 4,100 dialysis clinics. Along with its core business, the Renal Care Continuum, the company focuses on expanding in complementary areas and in the field of critical care.
As assumed, COVID-19 pandemic continued to impact organic growth in dialysis and downstream businesses; patient excess mortality rates significantly reduced
Negative exchange rate effects continue
Earnings development impacted by phasing and strong prior-year base, as indicated
Financial targets for FY 2021 confirmed
Sales of Fresenius Medical Care decreased by 5% (increased by 2% in constant currency) to €4,320 million (Q2/20: €4,557 million). Thus, currency translation had a negative effect of 7%. Organic growth was 1%. In H1/21, sales of Fresenius Medical Care decreased by 6% (increased by 2% in constant currency) to €8,530 million (H1/20: €9,045 million). Thus, currency translation had a negative effect of 8%. Organic growth was 1%.
EBIT decreased by 35% (-30% in constant currency) to €424 million (Q2/20: €656 million) resulting in a margin of 9.8% (Q2/20: 14.4%). EBIT before special items declined by 34% to €430 million (-29% in constant currency; Q2/20: €656 million), resulting in a margin of 10.0% (Q2/20: 14.4%). The decrease was mainly due to the adverse impact of the COVID-19 pandemic, including a high prior-year base as a result of government relief funding, the expected phasing and increase in Sales, General and Administrative expense, negative exchange rate effects and higher direct costs. These effects were partially offset in particular by an improved Medicare Advantage payor mix in the U.S.
1 Before special items 2 Net income attributable to shareholders of Fresenius Medical Care AG & Co. KGaA
For a detailed overview of special items please see the reconciliation table in the PDF document.
In H1/21, EBIT decreased by 26% (-20% in constant currency) to €898 million (H1/20: €1,211 million) resulting in a margin of 10.5% (H1/20: 13.4%). EBIT before special items decreased by 25% (-19% in constant currency) to €907 million (Q2/20: €1,211 million) resulting in an EBIT margin excluding special items of 10.6% (H1/20: 13.4%).
Net income1 decreased by 38% (-33% in constant currency) to €219 million (Q2/20: €351 million). Net income1 before special items decreased by 37% (-31% in constant currency) to €223 million (Q2/20: €351 million).
In H1/21, net income1 decreased by 26% (-21% in constant currency) to €468 million (H1/20: €634 million). Net income1 before special items decreased by 25% (-20% in constant currency) to €474 million (H1/20: €634 million).
Operating cash flow was €921 million (Q2/20: €2,319 million) with a margin of 21.3% (Q2/20: 50.9%). The decline was mainly due to the U.S. federal government’s payments in Q2/20 under the CARES Act, the start of recoupment of these advanced payments in Q2/21 as well as the timing of certain other expense payments in 2021. In H1/21, operating cash flow was €1,129 million (H1/20: €2,903 million) with a margin of 13.2% (H1/20: 32.1%).
For FY/21, Fresenius Medical Care confirms its outlook as outlined in February 2021. The Company expects revenue2 to grow at a low-to-mid single-digit percentage range and net income1,3 to decline at a high-teens to mid-twenties percentage range against the 2020 base4. This outlook is based on the assumption of a return to normalized mortality rates in H2/21.
1 Net income attributable to shareholders of Fresenius Medical Care AG & Co. KGaA 2 FY/20 base: €17,859 million 3 FY/20 base: €1,359 million, before special items; FY/21: before special items 4 These targets are based on the 2020 results excluding the impairment of goodwill and trade names in the Latin America Segment of €195 million. They are inclusive of anticipated COVID-19 effects, in constant currency and exclude special items. Special items include costs related to FME25 and other effects that are unusual in nature and have not been foreseeable or not foreseeable in size or impact at the time of giving guidance.
For a detailed overview of special items please see the reconciliation table in the PDF document.
Fresenius Kabi
Fresenius Kabi offers intravenously administered generic drugs, clinical nutrition and infusion therapies for seriously and chronically ill patients in the hospital and outpatient environments. The company is also a leading supplier of medical devices and transfusion technology products. In the biosimilars business, Fresenius Kabi develops products with a focus on oncology and autoimmune diseases.
North America performance impacted by COVID-19 and competitive pressure; effects of temporary manufacturing issues receding
Normalizing demand in Europe driving strong growth over a COVID-impacted base
Very strong Emerging Markets growth; China with strong performance given more normalized elective treatment activity
Outlook improved to low single-digit constant currency EBIT percentage growth
Sales increased by 5% (8% in constant currency) to €1,755 million (Q2/20: €1,678 million). Organic growth was 7%. In H1/21, sales increased by 1% (6% in constant currency) to €3,516 million (H1/20: €3,467 million). Organic growth was 5%. Negative currency translation effects of 3% in Q2 and 5% in H1 were mainly related to the weakness of the US dollar, the Argentinian peso and the Brazilian real.
Sales in North America decreased by 13% (organic growth: -6%) to €522 million (Q2/20: €600 million). The decrease was driven by reduced volume demand given fewer elective treatments, consequential competitive pressure and, albeit receding, temporary manufacturing issues. These negative effects outweighed extra demand for COVID-19 related products. In H1/21, sales in North America decreased by 15% (organic growth: -8%) to €1,080 million (H1/20: €1,269 million).
Sales in Europe increased by 12% (organic growth: 10%) to €634 million (Q2/20: €566 million) supported by a low prior-year basis meaningfully impacted by COVID-19. In H1/21, sales in Europe increased by 5% (organic growth: 4%) to €1,260 million (H1/20: €1,197 million).
1 Before special items 2 Net income attributable to shareholders of Fresenius SE & Co. KGaA
Sales in Asia-Pacific increased by 17% (organic growth: 17%) to €409 million (Q2/20: €351 million). The growth is mainly due to more normalized elective treatment activity in China as well as a recovery in other Asian markets. In H1/21, sales in Asia-Pacific increased by 20% (organic growth: 21%) to €801 million (H1/20: €670 million).
Sales in Latin America/Africa increased by 18% (organic growth: 24%) to €190 million (Q2/20: €161 million) due to ongoing COVID-19 related extra demand. In H1/21, sales in Latin America/Africa increased by 13% (organic growth: 26%) to €375 million (H1/20: €331 million).
EBIT1 increased by 2% (7% in constant currency) to €298 million (Q2/20: €292 million) with an EBIT margin of 17.0% (Q2/20: 17.4%). The increase in constant currency was tempered by underutilized production capacities in the US and competitive pressure coupled with selective supply constraints due to temporary, however receding, manufacturing issues. EBIT was supported by positive COVID-19 effects, lower corporate costs due to travel restrictions and phasing of projects. In H1/21, EBIT1 decreased by 1% (increased by 4% in constant currency) to €574 million (H1/20: €581 million) with an EBIT margin of 16.3% (H1/20: 16.8%).
Net income1,2 increased by 4% (9% in constant currency) to €204 million (Q2/201: €196 million). In H1/21, net income1,2 remained stable (increased by 6% in constant currency) at €394 million (H1/201: €393 million).
Operating cash flow decreased to €197 million (Q2/20: €437 million) with a margin of 11.2% (Q2/20: 26.0%) mainly due to the phasing of tax payments and payments for legal proceedings. In H1/21, operating cash flow decreased to €475 million (H1/20: €611 million) with a margin of 13.5% (H1/20: 17.6%).
For FY/21, Fresenius Kabi improves its EBIT outlook. The company now projects EBIT3 to grow in a low single-digit percentage range in constant currency. Previously, Fresenius Kabi expected a stable EBIT3 development up to low single-digit percentage growth. The company continues to expect organic sales growth4 in a low-to-mid single-digit percentage range. Both sales and EBIT outlook include expected COVID-19 effects.
1 Before special items 2 Net income attributable to shareholders of Fresenius SE & Co. KGaA 3 FY/20 base: €1,095 million, before special items; FY/21: before special items 4 FY/20 base: €6,976 million
Fresenius Helios
Fresenius Helios is Europe's leading private hospital operator. The company comprises Helios Germany and Helios Spain. Helios Germany operates 89 hospitals, ~130 outpatient centers and 6 prevention centers. Helios Spain operates 47 hospitals, 74 outpatient centers and around 300 occupational risk prevention centers. In addition, the company is active in Latin America with 6 hospitals and as a provider of medical diagnostics and reproduction medicine worldwide.
Gradually recovering elective treatments at Helios Germany
Excellent treatment activity at Helios Spain results in outstanding organic sales and earnings growth over a weak prior year quarter
Growth additionally fueled by contributions from acquisitions in Germany and Latin America as well as from the acquired fertility business
Outlook improved for organic sales and constant currency EBIT growth
Sales increased by 18% (19% in constant currency) to €2,738 million (Q2/20: €2,315 million). Organic growth was 14%. Acquisitions, including the fertility business Eugin, (consolidated as from 1 April 2021), contributed 5% to sales growth. In H1/21, sales increased by 13% (13% in constant currency) to €5,387 million (H1/20: €4,781 million). Organic growth was 9%. Acquisitions contributed 4% to sales growth.
Sales of Helios Germany increased by 7% (organic growth: 3%) to €1,675 million (Q2/20: €1,571 million) driven by a gradual recovery of elective treatments and positive case mix effects. The hospital acquisitions from the Order of Malta contributed 4% to sales growth. In H1/21, sales of Helios Germany increased by 5% (organic growth: 1%) to €3,348 million (H1/20: €3,174 million). COVID-19 effects were mostly mitigated by government compensation.
Sales of Helios Spain increased by 37% (38% in constant currency) to €1,020 million (Q2/20: €743 million) over a weak COVID-19 impacted prior-year quarter. Organic growth of 38% was driven by a consistently high level of treatments and ongoing demand for occupational risk prevention (ORP) services. The Latin American hospitals contributed 5% to sales growth. In H1/21, sales of Helios Spain increased by 24% (26% in constant currency) to €1,996 million (H1/20: €1,606 million). Organic growth was 24%.
1 Net income attributable to shareholders of Fresenius SE & Co. KGaA
EBIT of Fresenius Helios increased by 51% (51% in constant currency) to €298 million (Q2/20: €198 million) with an EBIT margin of 10.9% (Q2/20: 8.6%). In H1/21, EBIT of Fresenius Helios increased by 20% (20% in constant currency) to €566 million (H1/20: €472 million) with an EBIT margin of 10.5% (H1/20: 9.9%).
EBIT of Helios Germany increased by 3% to €152 million (Q2/20: €147 million) with an EBIT margin of 9.1% (Q2/20: 9.4%). In H1/21, EBIT of Helios Germany decreased by 3% to €302 million (H1/20: €312 million) with an EBIT margin of 9.0% (H1/20: 9.8%). Government compensation broadly mitigated COVID-19 effects.
EBIT of Helios Spain increased by 172% (174% in constant currency) to €147 million (Q2/20: €54 million) over a weak COVID-19 impacted prior-year quarter. EBIT margin improved to 14.4% (Q2/20: 7.3%). Healthy organic sales growth led to an improved coverage of the fixed cost base. The hospital acquisitions in Colombia contributed nicely. In H1/21, EBIT of Helios Spain increased by 64% (66% in constant currency) to €273 million (H1/20: €166 million) with an EBIT margin of 13.7% (H1/20: 10.3%).
Net income1increased by 57% (59% in constant currency) to €193 million (Q2/20: €123 million). In H1/21, net income1 increased by 22% (23% in constant currency) to €366 million (H1/20: €299 million).
Operating cash flow decreased to €223 million (Q2/20: €295 million) with a margin of 8.1% (Q1/20: 12.7%) resulting from the strong cash collection in Q2/20 related to accelerated payments of treatment invoices under the German law to ease the financial burden on hospitals. In H1/21, operating cash flow was on prior year level at €438 million (H1/20: €440 million) with a margin of 8.1% (H1/20: 9.2%).
For FY/21, Fresenius Helios improves its outlook: The company now expects organic sales2 growth in a mid single-digit percentage range. Previously, organic sales2 were expected to grow in a low-to-mid single-digit percentage range. Moreover, Fresenius Helios now projects EBIT3 to grow in a high single-digit percentage range in constant currency. Previously, EBIT3 was expected to grow in a mid- to high single-digit percentage range in constant currency. Both sales and EBIT outlook include expected COVID-19 effects.
1 Net income attributable to shareholders of Fresenius SE & Co. KGaA 2 FY/20 base: €9,818 million 3 FY/20 base: €1,025 million; FY/21 before special items
Fresenius Vamed
Fresenius Vamed manages projects and provides services for hospitals and other health care facilities worldwide and is a leading post-acute care provider in Central Europe. The portfolio ranges along the entire value chain: from project development, planning, and turnkey construction, via maintenance and technical management to total operational management.
Back to sales and earnings growth despite negative COVID-19 effects
Project business still marked by COVID-19 but showing clear signs of recovery
Good performance in the service business; rehabilitation business improving as number of elective surgeries increased
Excellent order intake
Sales increased by 17% (17% in constant currency) to €556 million (Q2/20: €475 million). Organic growth was 17%. In H1/21, sales increased by 6% (6% in constant currency) to €1,033 million (H1/20: €974 million). Organic growth was 6%.
Sales in the service business improved by 19% (19% in constant currency) to €392 million (Q2/20: €329 million), in particular driven by growing case numbers in the rehabilitation business. Sales in the project business increased by 12% (12% in constant currency) to €164 million (Q2/20: €146 million). In H1/21, sales in the service business increased by 10% (10% in constant currency) to €755 million (H1/20: €686 million). Sales in the project business decreased by 3% (-3% in constant currency) to €278 million (H1/20: €288 million).
EBIT increased to €16 million (Q2/20: -€13 million) with an EBIT margin of 2.9% (Q2/20:
-2.7%). In H1/21, EBIT increased to €12 million (H1/20: €1 million) with an EBIT margin of 1.2% (H1/20: 0.1%).
Net income1 increased to €11 million (Q2/20: -€15 million). In H1/21, net income1 increased to €4 million (H1/20: -€8 million).
1 Net income attributable to shareholders of VAMED AG
Order intake was outstanding with €713 million (Q2/20: €50 million) and €851 million in H1/21 (H1/20: €174 million), particularly driven by a turnkey project for a hospital in Wiener Neustadt, Austria. As of June 30, 2021, order backlog was at €3,635 million (December 31, 2020: €3,055 million).
Operating cash flow increased to €58 million (Q2/20: €28 million) with a margin of 10.4% (Q1/20: 5.9%) mainly due to payments from the international project business. In H1/21, operating cash flow increased to €14 million (H1/20: €8 million) with a margin of 1.4% (H1/20: 0.8%).
For FY/21, Fresenius Vamed confirms its outlook and expects organic sales1 growth in a mid-to-high single-digit percentage range and EBIT2 to grow to a high double-digit Euro million amount. Both sales and EBIT outlook include expected COVID-19 effects.
1 FY/20 base: €2,068 million 2 FY/20 base: €29 million; FY/21 before special items
Conference Call
As part of the publication of the results for Q2/2021, a conference call will be held on July 30, 2021 at 1:30 p.m. CEDT (7:30 a.m. EDT).You are cordially invited to follow the conference call in a live broadcast over the Internet at https://www.fresenius.com/media-calendar. Following the call, a replay will be available on our website.
This release contains forward-looking statements that are subject to various risks and uncertainties. Future results could differ materially from those described in these forward-looking statements due to certain factors, e.g. changes in business, economic and competitive conditions, regulatory reforms, results of clinical trials, foreign exchange rate fluctuations, uncertainties in litigation or investigative proceedings, and the availability of financing. Fresenius does not undertake any responsibility to update the forward-looking statements in this release.
Fresenius Medical Care with expected continued COVID-19 impact; patient excess mortality rates significantly reduced
Fresenius Kabi’s strong Emerging Markets business more than offsets persistent headwinds in North America
Helios Germany with gradually increasing elective treatment volumes; Helios Spain delivers outstanding sales and earnings growth based on strong activity levels and a weak prior-year quarter
Fresenius Vamed back to growth driven by good performance in the service business; growing order book in the project business
First savings from initiatives to improve efficiency already expected in 2021
If no timeframe is specified, information refers to Q2/2021.
1 Before special items 2 Net income attributable to shareholders of Fresenius SE & Co. KGaA
For a detailed overview of special items please see the reconciliation table in the PDF document.
Stephan Sturm, CEO of Fresenius, said: “Overall, our interim result for the 2021 business year is very strong. We have achieved very healthy sales and earnings growth, despite the ongoing impact of the pandemic. Our businesses are developing well, and we are making good progress on our initiatives for profitable growth and increased efficiency. The increased vaccination rates in many of our important markets are encouraging, but of course the pandemic is not over yet. We must remain vigilant and will continue to monitor the infection situation very closely. Nevertheless, there are reasons for us to be optimistic: Our growth drivers are intact, good health is and will remain of paramount importance to everyone. We will continue the review of our structures, and to drive efficiency measures along with our growth initiatives. The resulting benefits will allow us to sustainably develop our healthcare group even more successfully.”
COVID-19 assumptions for guidance FY/21
Whilst the pandemic exhibited a quite differentiated regional development, negative COVID-effects have - consistent with expectations - generally receded during Q2/21.
Fresenius had projected that the burdens and constraints caused by the pandemic will recede in the second half of the year. Now, however, the currently rising number of COVID-19 cases, the further evolution of COVID-19 virus mutations as well as stalling vaccination progress could all pose a threat to this assumption, and the company remains vigilant.
Whilst the risk of renewed far-reaching containment measures in one or more of Fresenius’ major markets currently appears less likely, it cannot be excluded. Any resulting significant and direct impact on the health care sector without appropriate compensation is not reflected in the Group’s FY/21 guidance. These assumptions are subject to considerable uncertainty.
FY/21 Group earnings guidance raised
Based on the Group’s strong Q2/21 and the progress in the program to improve Group-wide efficiencies, where the company expects first savings already this year, Fresenius raises its 2021 earnings guidance. The Company now projects net income1,2 to grow in a low single-digit percentage range in constant currency. Previously, Fresenius expected an at least broadly stable net income1,2 development in constant currency. The Company continues to project sales growth3 in a low-to-mid single-digit percentage range in constant currency.
Implicitly, net income1 for the Group excluding Fresenius Medical Care is now expected to grow in a high single-digit percentage range in constant currency. Previously, Fresenius expected mid-to-high single-digit percentage growth in constant currency.
The guidance implies ongoing COVID-19 related headwinds in the second half of the year. It reflects negative pricing effects related to tender activity at Fresenius Kabi in China as well as increasingly noticeable cost inflation effects across selected markets.
Fresenius projects net debt/EBITDA4 to be around the top-end of the self-imposed target corridor of 3.0x to 3.5x by the end of FY/21.
1 Net income attributable to shareholders of Fresenius SE & Co. KGaA 2 FY/20 base: €1,796 million, before special items; FY/21: before special items 3 FY/20 base: €36,277 million 4 At LTM average exchange rates for both net debt and EBITDA; pro forma closed acquisitions/divestitures; excluding further potential acquisitions; before special items
For a detailed overview of special items please see the reconciliation table in the PDF document.
Progress on efficiency measures to sustainably improve profitability
To sustainably enhance profitability and operational excellence, Fresenius has launched group-wide efficiency initiatives. These measures are expected to gradually result in cost savings of more than €100 million p.a. after tax and minority interest in 2023, with some potential to increase thereafter.
While an update on the comprehensive operating model review at Fresenius Medical Care is expected to be provided in fall 2021, the three other Fresenius business segments have already identified and launched initiatives in defined areas.
At Fresenius Kabi, these initiatives comprise the optimization of its production network, reduction of product portfolio complexity, centralization of worldwide purchasing and review of organizational and cost structures.
Fresenius Helios will put a focus on its strategic review of the hospital portfolio and ambulatory care network as well as on the reduction of G&A costs.
Fresenius Vamed will implement some dedicated structural and organizational measures, comprising the optimization of its global subsidiary structure, the review of its assets and shareholdings portfolio and the optimization of procurement and G&A costs.
These activities specific to the business segments will be complemented and supported by initiatives on the Fresenius group level, for example, the implementation of new ways of working at the corporate headquarters as well as a group-wide review of the IT operating model.
Achieving these sustainable efficiencies will require significant up-front expenses. For the years 2021 to 2023, those expenses are expected to be more than €100 million p.a. after tax and minority interest on average, with the largest portion currently expected to materialize in 2022. They will be classified as special items, consistent with previous practice.
The company expects significant contributions from all four business segments and from the corporate center in the 2021 to 2023 period. Hence, it is expected that the savings contributed by Fresenius Medical Care will not be overproportional.
For FY/21, initial low double-digit million € savings after tax and minority interest from the Group’s above outlined cost and efficiency measures are expected to support the Group’s profitability. These savings and efficiency gains derive from activities in all four business segments.
Stephan Sturm, CEO of Fresenius, said: “We examine possible cost reductions with great care; and we implement them in a very targeted way, with a sense of proportion. We are saving because we have goals and want to realize them: We want to give ever more people access to ever better medicine. We want to contribute to keeping – or making – people healthy, to helping people enjoy their lives despite an illness. That is why we have a responsibility to use our valuable resources carefully. We will prioritize resources where they can have the biggest impact, remove duplication, and stop activities where results are not satisfying. This fitness program will benefit everyone: Our patients, the healthcare system, our employees and our shareholders.”
8% sales increase in constant currency Group sales increased by 4% (8% in constant currency) to €9,246 million (Q2/20: €8,920 million). Organic growth was 6%. Acquisitions/divestitures contributed net 2% to growth. Currency translation reduced sales growth by 4%. Excluding estimated COVID-19 effects1, Group sales growth would have been 6% to 7% in constant currency. In H1/21, Group sales increased by 1% (6% in constant currency) to €18,230 million (H1/20: €18,055 million). Organic growth was 4%. Acquisitions/divestitures contributed net 2% to growth. Currency translation reduced sales growth by 5%. Excluding estimated COVID-19 effects1, Group sales growth would have been 5% to 6% in constant currency.
20% net income2,3 increase in constant currency
Group EBITDA before special items decreased by 5% (0% in constant currency) to €1,671 million (Q2/20: €1,762 million). Reported Group EBITDA was €1,662 million (Q2/20: €1,762 million).
In H1/21, Group EBITDA before special items decreased by 6% (-1% in constant currency) to €3,302 million (H1/20: €3,517 million). Reported Group EBITDA was €3,290 million (H1/20: €3,517 million).
Group EBIT before special items decreased by 8% (-4% in constant currency) to €1,030 million (Q2/20: €1,123 million). The constant currency decrease is primarily due to COVID-19 related headwinds at Fresenius Medical Care. The EBIT margin before special items was 11.1% (Q2/20: 12.6%). Reported Group EBIT was €1,021 million (Q2/20: €1,123 million).
In H1/21, Group EBIT before special items decreased by 9% (-5% in constant currency) to €2,039 million (H1/20: €2,248 million). The constant currency decrease is primarily due to COVID-19 related headwinds at Fresenius Medical Care. The EBIT margin before special items was 11.2% (Q1/20: 12.5%). Reported Group EBIT was €2,027 million (H1/20: €2,248 million).
1 For estimated COVID-19 effects please see table in the PDF document 2 Before special items 3 Net income attributable to shareholders of Fresenius SE & Co. KGaA
For a detailed overview of special items please see the reconciliation table in the PDF document.
Group net interest before special items and reported net interest improved to -€121 million (Q2/202: -€167 million) mainly due to successful refinancing activities, lower interest rates as well as currency translation effects. In H1/21, Group net interest before special items improved to -€258 million (H1/202: -€341 million). Reported Group net interest improved to -€258 million (H1/20: -€349 million).
Group tax rate before special items was 21.5% (Q2/202: 23.5%) while reported Group tax rate was 21.3% (Q2/20: 23.4%). In H1/21, Group tax rate before special items was 22.1% (H1/202: 23.1%) while reported Group tax rate was 22.0% (H1/20: 23.0%).
Noncontrolling interests before special items were -€240 million (Q2/20: -€321 million) of which 89% were attributable to the noncontrolling interests in Fresenius Medical Care. Reported noncontrolling interests were -€237 million (Q2/20: -€321 million). In H1/21, noncontrolling interests before special items were -€477 million (H1/20: -€592 million) of which 92% were attributable to the noncontrolling interests in Fresenius Medical Care. Reported noncontrolling interests were -€473 million (Q2/20: -€592 million).
Group net income1 before special items increased by 16% (20% in constant currency) to €474 million (Q2/202: €410 million) driven by Helios Spain, Kabi’s Emerging Markets business as well as the favorable net interest development. Excluding estimated COVID-19 effects3, Group net income1 before special items would have grown 10% to 14% in constant currency. Reported Group net income1 increased to €471 million (Q2/20: €411 million).
In H1/21, Group net income1 before special items increased by 4% (8% in constant currency) to €910 million (H1/202: €875 million). Excluding estimated COVID-19 effects3, Group net income1 before special items would have grown 4% to 8% in constant currency. Reported Group net income1 increased to €906 million (H1/20: €870 million).
1 Net income attributable to shareholders of Fresenius SE & Co. KGaA 2 Before special items 3 For estimated COVID-19 effects please see table in the PDF document.
For a detailed overview of special items please see the reconciliation table in the PDF document.
Earnings per share1 before special items increased by 15% (19% in constant currency) to €0.85 (Q2/202: €0.74). Reported earnings per share1 were €0.84 (Q2/20: €0.74). In H1/21, earnings per share1 before special items increased by 4% (8% in constant currency) to €1.63 (H1/202: €1.57). Reported earnings per share1 were €1.62 (H1/20: €1.56).
Continued investment in growth
Spending on property, plant and equipment was €509 million corresponding to 6% of sales (Q2/20: €474 million; 5% of sales). These investments served primarily for the modernization and expansion of dialysis clinics, production facilities as well as hospitals and day clinics. In H1/21, spending on property, plant and equipment was €893 million corresponding to 5% of sales (H1/20: €1,021 million; 6% of sales).
Total acquisition spending was €491 million (Q2/20: €97 million) mainly for the acquisition of Eugin Group at Fresenius Helios which has been consolidated since April 1, 2021, and the acquisition of dialysis clinics at Fresenius Medical Care. In H1/21, total acquisition spending was €640 million (H1/20: €509 million).
Cash flow development
Group operating cash flow decreased to €1,451 million (Q2/20: €3,082 million) with a margin of 15.7% (Q2/20: 34.6%). The decline was mainly due to the U.S. federal government’s payments in Q2/20 under the CARES Act, the start of recoupment of these advanced payments in Q2/21 as well as the timing of certain other expense payments in 2021 at Fresenius Medical Care. Free cash flow before acquisitions and dividends decreased correspondingly to €952 million (Q2/20: €2,606 million). Free cash flow after acquisitions and dividends decreased to -€359 million (Q2/20: €2,374 million).
In H1/21, Group operating cash flow decreased to €2,103 million (H1/20: €3,960 million) with a margin of 11.5% (H1/20: 21.9%). Free cash flow before acquisitions and dividends decreased to €1,193 million (H1/20: €2,911 million). Free cash flow after acquisitions and dividends decreased to -€242 million (H1/20: €2,334 million).
1 Net income attributable to shareholders of Fresenius SE & Co. KGaA 2 Before Special items
Solid balance sheet structure
Group total assets increased by 5% (3% in constant currency) to €69,655 million (Dec. 31, 2020: €66,646 million) given the expansion of business activities and currency effects. Current assets increased by 7% (6% in constant currency) to €16,901 million (Dec. 31, 2020: €15,772 million) mainly driven by the increase of trade accounts receivables, cash and cash equivalents and inventories. Non-current assets increased by 4% (2% in constant currency) to €52,754 million (Dec. 31, 2020: €50,874 million).
Total shareholders’ equity increased by 4% (2% in constant currency) to €27,131 million (Dec. 31, 2020: €26,023 million). The equity ratio was 39.0% (Dec. 31, 2020: 39.0%).
Group debt increased by 5% (4% in constant currency) to €27,289 million (Dec. 31, 2020: € 25,913 million). Group net debt increased by 4% (3% in constant currency) to € 25,039 million (Dec. 31, 2020: € 24,076 million).
As of June 30, 2021, the net debt/EBITDA ratio increased to 3.60x1,2 (Dec. 31, 2020: 3.44x1,2) driven by COVID-19 effects weighing on EBITDA as well as increased net debt.
1 At LTM average exchange rates for both net debt and EBITDA; pro forma closed acquisitions/divestitures 2 Before special items
For a detailed overview of special items please see the reconciliation table in the PDF document.
Business Segments
Fresenius Medical Care (Financial data according to Fresenius Medical Care press release)
Fresenius Medical Care is the world's largest provider of products and services for individuals with renal diseases. As of June 30, 2021, Fresenius Medical Care was treating approximately 346,000 patients in more than 4,100 dialysis clinics. Along with its core business, the Renal Care Continuum, the company focuses on expanding in complementary areas and in the field of critical care.
• As assumed, COVID-19 pandemic continued to impact organic growth in dialysis and downstream businesses; patient excess mortality rates significantly reduced
• Negative exchange rate effects continue
• Earnings development impacted by phasing and strong prior-year base, as indicated
• Financial targets for FY 2021 confirmed
Sales of Fresenius Medical Care decreased by 5% (increased by 2% in constant currency) to €4,320 million (Q2/20: €4,557 million). Thus, currency translation had a negative effect of 7%. Organic growth was 1%. In H1/21, sales of Fresenius Medical Care decreased by 6% (increased by 2% in constant currency) to €8,530 million (H1/20: €9,045 million). Thus, currency translation had a negative effect of 8%. Organic growth was 1%.
EBIT decreased by 35% (-30% in constant currency) to €424 million (Q2/20: €656 million) resulting in a margin of 9.8% (Q2/20: 14.4%). EBIT before special items declined by 34% to €430 million (-29% in constant currency; Q2/20: €656 million), resulting in a margin of 10.0% (Q2/20: 14.4%). The decrease was mainly due to the adverse impact of the COVID-19 pandemic, including a high prior-year base as a result of government relief funding, the expected phasing and increase in Sales, General and Administrative expense, negative exchange rate effects and higher direct costs. These effects were partially offset in particular by an improved Medicare Advantage payor mix in the U.S.
1 Before special items 2 Net income attributable to shareholders of Fresenius Medical Care AG & Co. KGaA
For a detailed overview of special items please see the reconciliation table in the PDF document.
In H1/21, EBIT decreased by 26% (-20% in constant currency) to €898 million (H1/20: €1,211 million) resulting in a margin of 10.5% (H1/20: 13.4%). EBIT before special items decreased by 25% (-19% in constant currency) to €907 million (Q2/20: €1,211 million) resulting in an EBIT margin excluding special items of 10.6% (H1/20: 13.4%).
Net income1 decreased by 38% (-33% in constant currency) to €219 million (Q2/20: €351 million). Net income1 before special items decreased by 37% (-31% in constant currency) to €223 million (Q2/20: €351 million).
In H1/21, net income1 decreased by 26% (-21% in constant currency) to €468 million (H1/20: €634 million). Net income1 before special items decreased by 25% (-20% in constant currency) to €474 million (H1/20: €634 million).
Operating cash flow was €921 million (Q2/20: €2,319 million) with a margin of 21.3% (Q2/20: 50.9%). The decline was mainly due to the U.S. federal government’s payments in Q2/20 under the CARES Act, the start of recoupment of these advanced payments in Q2/21 as well as the timing of certain other expense payments in 2021. In H1/21, operating cash flow was €1,129 million (H1/20: €2,903 million) with a margin of 13.2% (H1/20: 32.1%).
For FY/21, Fresenius Medical Care confirms its outlook as outlined in February 2021. The Company expects revenue2 to grow at a low-to-mid single-digit percentage range and net income1,3 to decline at a high-teens to mid-twenties percentage range against the 2020 base4. This outlook is based on the assumption of a return to normalized mortality rates in H2/21.
1 Net income attributable to shareholders of Fresenius Medical Care AG & Co. KGaA 2 FY/20 base: €17,859 million 3 FY/20 base: €1,359 million, before special items; FY/21: before special items 4 These targets are based on the 2020 results excluding the impairment of goodwill and trade names in the Latin America Segment of €195 million. They are inclusive of anticipated COVID-19 effects, in constant currency and exclude special items. Special items include costs related to FME25 and other effects that are unusual in nature and have not been foreseeable or not foreseeable in size or impact at the time of giving guidance.
For a detailed overview of special items please see the reconciliation table in the PDF document.
Fresenius Kabi
Fresenius Kabi offers intravenously administered generic drugs, clinical nutrition and infusion therapies for seriously and chronically ill patients in the hospital and outpatient environments. The company is also a leading supplier of medical devices and transfusion technology products. In the biosimilars business, Fresenius Kabi develops products with a focus on oncology and autoimmune diseases.
• North America performance impacted by COVID-19 and competitive pressure; effects of temporary manufacturing issues receding
• Normalizing demand in Europe driving strong growth over a COVID-impacted base
• Very strong Emerging Markets growth; China with strong performance given more normalized elective treatment activity
• Outlook improved to low single-digit constant currency EBIT percentage growth
Sales increased by 5% (8% in constant currency) to €1,755 million (Q2/20: €1,678 million). Organic growth was 7%. In H1/21, sales increased by 1% (6% in constant currency) to €3,516 million (H1/20: €3,467 million). Organic growth was 5%. Negative currency translation effects of 3% in Q2 and 5% in H1 were mainly related to the weakness of the US dollar, the Argentinian peso and the Brazilian real.
Sales in North America decreased by 13% (organic growth: -6%) to €522 million (Q2/20: €600 million). The decrease was driven by reduced volume demand given fewer elective treatments, consequential competitive pressure and, albeit receding, temporary manufacturing issues. These negative effects outweighed extra demand for COVID-19 related products. In H1/21, sales in North America decreased by 15% (organic growth: -8%) to €1,080 million (H1/20: €1,269 million).
Sales in Europe increased by 12% (organic growth: 10%) to €634 million (Q2/20: €566 million) supported by a low prior-year basis meaningfully impacted by COVID-19. In H1/21, sales in Europe increased by 5% (organic growth: 4%) to €1,260 million (H1/20: €1,197 million).
1 Before special items 2 Net income attributable to shareholders of Fresenius SE & Co. KGaA
Sales in Asia-Pacific increased by 17% (organic growth: 17%) to €409 million (Q2/20: €351 million). The growth is mainly due to more normalized elective treatment activity in China as well as a recovery in other Asian markets. In H1/21, sales in Asia-Pacific increased by 20% (organic growth: 21%) to €801 million (H1/20: €670 million).
Sales in Latin America/Africa increased by 18% (organic growth: 24%) to €190 million (Q2/20: €161 million) due to ongoing COVID-19 related extra demand. In H1/21, sales in Latin America/Africa increased by 13% (organic growth: 26%) to €375 million (H1/20: €331 million).
EBIT1 increased by 2% (7% in constant currency) to €298 million (Q2/20: €292 million) with an EBIT margin of 17.0% (Q2/20: 17.4%). The increase in constant currency was tempered by underutilized production capacities in the US and competitive pressure coupled with selective supply constraints due to temporary, however receding, manufacturing issues. EBIT was supported by positive COVID-19 effects, lower corporate costs due to travel restrictions and phasing of projects. In H1/21, EBIT1 decreased by 1% (increased by 4% in constant currency) to €574 million (H1/20: €581 million) with an EBIT margin of 16.3% (H1/20: 16.8%).
Net income1,2 increased by 4% (9% in constant currency) to €204 million (Q2/201: €196 million). In H1/21, net income1,2 remained stable (increased by 6% in constant currency) at €394 million (H1/201: €393 million).
Operating cash flow decreased to €197 million (Q2/20: €437 million) with a margin of 11.2% (Q2/20: 26.0%) mainly due to the phasing of tax payments and payments for legal proceedings. In H1/21, operating cash flow decreased to €475 million (H1/20: €611 million) with a margin of 13.5% (H1/20: 17.6%).
For FY/21, Fresenius Kabi improves its EBIT outlook. The company now projects EBIT3 to grow in a low single-digit percentage range in constant currency. Previously, Fresenius Kabi expected a stable EBIT3 development up to low single-digit percentage growth. The company continues to expect organic sales growth4 in a low-to-mid single-digit percentage range. Both sales and EBIT outlook include expected COVID-19 effects.
1 Before special items 2 Net income attributable to shareholders of Fresenius SE & Co. KGaA 3 FY/20 base: €1,095 million, before special items; FY/21: before special items 4 FY/20 base: €6,976 million
Fresenius Helios
Fresenius Helios is Europe's leading private hospital operator. The company comprises Helios Germany and Helios Spain. Helios Germany operates 89 hospitals, ~130 outpatient centers and 6 prevention centers. Helios Spain operates 47 hospitals, 74 outpatient centers and around 300 occupational risk prevention centers. In addition, the company is active in Latin America with 6 hospitals and as a provider of medical diagnostics and reproduction medicine worldwide.
• Gradually recovering elective treatments at Helios Germany
• Excellent treatment activity at Helios Spain results in outstanding organic sales and earnings growth over a weak prior year quarter
• Growth additionally fueled by contributions from acquisitions in Germany and Latin America as well as from the acquired fertility business
• Outlook improved for organic sales and constant currency EBIT growth
Sales increased by 18% (19% in constant currency) to €2,738 million (Q2/20: €2,315 million). Organic growth was 14%. Acquisitions, including the fertility business Eugin, (consolidated as from 1 April 2021), contributed 5% to sales growth. In H1/21, sales increased by 13% (13% in constant currency) to €5,387 million (H1/20: €4,781 million). Organic growth was 9%. Acquisitions contributed 4% to sales growth.
Sales of Helios Germany increased by 7% (organic growth: 3%) to €1,675 million (Q2/20: €1,571 million) driven by a gradual recovery of elective treatments and positive case mix effects. The hospital acquisitions from the Order of Malta contributed 4% to sales growth. In H1/21, sales of Helios Germany increased by 5% (organic growth: 1%) to €3,348 million (H1/20: €3,174 million). COVID-19 effects were mostly mitigated by government compensation.
Sales of Helios Spain increased by 37% (38% in constant currency) to €1,020 million (Q2/20: €743 million) over a weak COVID-19 impacted prior-year quarter. Organic growth of 38% was driven by a consistently high level of treatments and ongoing demand for occupational risk prevention (ORP) services. The Latin American hospitals contributed 5% to sales growth. In H1/21, sales of Helios Spain increased by 24% (26% in constant currency) to €1,996 million (H1/20: €1,606 million). Organic growth was 24%.
1 Net income attributable to shareholders of Fresenius SE & Co. KGaA
EBIT of Fresenius Helios increased by 51% (51% in constant currency) to €298 million (Q2/20: €198 million) with an EBIT margin of 10.9% (Q2/20: 8.6%). In H1/21, EBIT of Fresenius Helios increased by 20% (20% in constant currency) to €566 million (H1/20: €472 million) with an EBIT margin of 10.5% (H1/20: 9.9%).
EBIT of Helios Germany increased by 3% to €152 million (Q2/20: €147 million) with an EBIT margin of 9.1% (Q2/20: 9.4%). In H1/21, EBIT of Helios Germany decreased by 3% to €302 million (H1/20: €312 million) with an EBIT margin of 9.0% (H1/20: 9.8%). Government compensation broadly mitigated COVID-19 effects.
EBIT of Helios Spain increased by 172% (174% in constant currency) to €147 million (Q2/20: €54 million) over a weak COVID-19 impacted prior-year quarter. EBIT margin improved to 14.4% (Q2/20: 7.3%). Healthy organic sales growth led to an improved coverage of the fixed cost base. The hospital acquisitions in Colombia contributed nicely. In H1/21, EBIT of Helios Spain increased by 64% (66% in constant currency) to €273 million (H1/20: €166 million) with an EBIT margin of 13.7% (H1/20: 10.3%).
Net income1increased by 57% (59% in constant currency) to €193 million (Q2/20: €123 million). In H1/21, net income1 increased by 22% (23% in constant currency) to €366 million (H1/20: €299 million).
Operating cash flow decreased to €223 million (Q2/20: €295 million) with a margin of 8.1% (Q1/20: 12.7%) resulting from the strong cash collection in Q2/20 related to accelerated payments of treatment invoices under the German law to ease the financial burden on hospitals. In H1/21, operating cash flow was on prior year level at €438 million (H1/20: €440 million) with a margin of 8.1% (H1/20: 9.2%).
For FY/21, Fresenius Helios improves its outlook: The company now expects organic sales2 growth in a mid single-digit percentage range. Previously, organic sales2 were expected to grow in a low-to-mid single-digit percentage range. Moreover, Fresenius Helios now projects EBIT3 to grow in a high single-digit percentage range in constant currency. Previously, EBIT3 was expected to grow in a mid- to high single-digit percentage range in constant currency. Both sales and EBIT outlook include expected COVID-19 effects.
1 Net income attributable to shareholders of Fresenius SE & Co. KGaA 2 FY/20 base: €9,818 million 3 FY/20 base: €1,025 million; FY/21 before special items
Fresenius Vamed
Fresenius Vamed manages projects and provides services for hospitals and other health care facilities worldwide and is a leading post-acute care provider in Central Europe. The portfolio ranges along the entire value chain: from project development, planning, and turnkey construction, via maintenance and technical management to total operational management.
• Back to sales and earnings growth despite negative COVID-19 effects
• Project business still marked by COVID-19 but showing clear signs of recovery
• Good performance in the service business; rehabilitation business improving as number of elective surgeries increased
• Excellent order intake
Sales increased by 17% (17% in constant currency) to €556 million (Q2/20: €475 million). Organic growth was 17%. In H1/21, sales increased by 6% (6% in constant currency) to €1,033 million (H1/20: €974 million). Organic growth was 6%.
Sales in the service business improved by 19% (19% in constant currency) to €392 million (Q2/20: €329 million), in particular driven by growing case numbers in the rehabilitation business. Sales in the project business increased by 12% (12% in constant currency) to €164 million (Q2/20: €146 million). In H1/21, sales in the service business increased by 10% (10% in constant currency) to €755 million (H1/20: €686 million). Sales in the project business decreased by 3% (-3% in constant currency) to €278 million (H1/20: €288 million).
EBIT increased to €16 million (Q2/20: -€13 million) with an EBIT margin of 2.9% (Q2/20:
-2.7%). In H1/21, EBIT increased to €12 million (H1/20: €1 million) with an EBIT margin of 1.2% (H1/20: 0.1%).
Net income1 increased to €11 million (Q2/20: -€15 million). In H1/21, net income1 increased to €4 million (H1/20: -€8 million).
1 Net income attributable to shareholders of VAMED AG
Order intake was outstanding with €713 million (Q2/20: €50 million) and €851 million in H1/21 (H1/20: €174 million), particularly driven by a turnkey project for a hospital in Wiener Neustadt, Austria. As of June 30, 2021, order backlog was at €3,635 million (December 31, 2020: €3,055 million).
Operating cash flow increased to €58 million (Q2/20: €28 million) with a margin of 10.4% (Q1/20: 5.9%) mainly due to payments from the international project business. In H1/21, operating cash flow increased to €14 million (H1/20: €8 million) with a margin of 1.4% (H1/20: 0.8%).
For FY/21, Fresenius Vamed confirms its outlook and expects organic sales1 growth in a mid-to-high single-digit percentage range and EBIT2 to grow to a high double-digit Euro million amount. Both sales and EBIT outlook include expected COVID-19 effects.
1 FY/20 base: €2,068 million 2 FY/20 base: €29 million; FY/21 before special items
Conference Call
As part of the publication of the results for Q2/2021, a conference call will be held on July 30, 2021 at 1:30 p.m. CEDT (7:30 a.m. EDT). All investors are cordially invited to follow the conference call in a live broadcast over the Internet at www.fresenius.com/investors. Following the call, a replay will be available on our website.
This release contains forward-looking statements that are subject to various risks and uncertainties. Future results could differ materially from those described in these forward-looking statements due to certain factors, e.g. changes in business, economic and competitive conditions, regulatory reforms, results of clinical trials, foreign exchange rate fluctuations, uncertainties in litigation or investigative proceedings, and the availability of financing. Fresenius does not undertake any responsibility to update the forward-looking statements in this release.
Fresenius has successfully signed a €2 billion syndicated revolving credit facility with an international consortium of 29 core relationship banks. It has a maturity of five years with two one-year extension options and can be drawn in various currencies.
The new credit facility replaces the existing €1.1 billion and US$500 million revolving credit facilities, originally entered into in 2012 and amended from time to time. It is intended to serve as a backup line for general corporate purposes. The increased volume will further strengthen Fresenius’ liquidity profile and increase the company’s financial flexibility.
A key component of the new credit facility is the link to sustainability: Emphasizing Fresenius’ commitment to embed sustainability in all aspects of its business, the credit facility’s margin will be adjusted up or down according to changes in Fresenius’ sustainability performance. This is Fresenius’ first sustainability-linked financial transaction, demonstrating the increasing importance of sustainable financing.
Rachel Empey, Chief Financial Officer of Fresenius, said: “Sustainability is deeply rooted in our thinking and actions, at all levels. That is why it is important to us to take sustainability into account in our financing strategy. At the same time, with this credit facility we have increased our financial flexibility and further optimized our financing structure. In this way we are supporting investments in future growth and securing the company’s long-term success.”
This release contains forward-looking statements that are subject to various risks and uncertainties. Future results could differ materially from those described in these forward-looking statements due to certain factors, e.g. changes in business, economic and competitive conditions, regulatory reforms, results of clinical trials, foreign exchange rate fluctuations, uncertainties in litigation or investigative proceedings, and the availability of financing. Fresenius does not undertake any responsibility to update the forward-looking statements in this release.