
Fresenius announced today that the Company's Q2 2026 Aide Memoire is now available on the Company's financial results section.
As a service to capital market participants, Fresenius provides a quarterly Aide Memoire ahead of the publication of the Company's quarterly results. This document includes a summary of relevant information that Fresenius has communicated previously or made publicly available to the capital market or otherwise. Fresenius' Q2 2026 financial results will be published on August 5, 2026.


The German Bundestag and Bundesrat approved the Act to Stabilize Contributions Rates in the Statutory Health Insurance System (GKV-Beitragssatzstabilisierungsgesetz) on July 10, 2026. This completes the parliamentary process.
Fresenius’ perspective in brief:
- Fresenius’ Full Year 2026 guidance is unchanged.
- The approved Act preserves annual hospital reimbursement growth, and on balance, is more favourable than the Cabinet Draft, confirming the direction the Company flagged in April 2026.
- Fresenius Helios’ revenue growth and 10-12% EBIT margin ambition as part of the Fresenius Financial Framework remains unchanged.
Please find the full Market Briefing here: Analyst & Consensus.
Bonds 2026 – 2034
Issuer | Fresenius SE & Co. KGaA |
Currency | € |
Issue amount | 500,000,000 |
Value date | July 08, 2026 |
Maturity | July 08, 2034 |
Coupon | 3.750% |
Coupon payment | July 08 |
Rating | BBB / Baa3 / BBB- |
Stock exchange | Luxembourg / Regulated Market |
Denomination | 1,000 |
Clearing agency | Clearstream Luxembourg / Euroclear |
ISIN Code | XS3435670222 |
Bonds 2026 – 2031
Issuer | Fresenius SE & Co. KGaA |
Currency | € |
Issue amount | 500,000,000 |
Value date | July 08, 2026 |
Maturity | July 08, 2031 |
Coupon | 3.375% |
Coupon payment | July 08 |
Rating | BBB / Baa3 / BBB- |
Stock exchange | Luxembourg / Regulated Market |
Denomination | 1.000 |
Clearing agency | Clearstream Luxembourg / Euroclear |
ISIN Code | XS3435668325 |

The information and documents contained on the following pages of this website are for information purposes only. These materials do neither constitute an offer nor an invitation to subscribe to or to purchase securities, nor any investment advice or service, and are not meant to serve as a basis for any kind of obligation, contractual or otherwise. Securities may not be offered or sold in the United States of America (“US”) absent registration under the US Securities Act of 1933, as amended, or an exemption from registration. The securities described on the following pages are not offered for sale in the US or to "US persons" (as defined in Regulation S under the US Securities Act of 1933, as amended).
THE FOLLOWING INFORMATION AND DOCUMENTS ARE NOT DIRECTED AT AND ARE NOT INTENDED FOR USE BY (I) PERSONS WHO ARE RESIDENTS OF OR LOCATED IN THE US, CANADA, JAPAN OR AUSTRALIA OR WHO ARE US PERSONS (AS DEFINED IN REGULATION S UNDER THE US SECURITIES ACT OF 1933, AS AMENDED), OR (II) PERSONS IN ANY OTHER JURISDICTION WHERE THE COMMUNICATION OR RECEIPT OF SUCH INFORMATION IS RESTRICTED IN SUCH A WAY THAT PROVIDES THAT SUCH PERSONS SHALL NOT RECEIVE IT. SUCH PERSONS, OR PERSONS ACTING FOR THE BENEFIT OF ANY SUCH PERSONS, ARE NOT PERMITTED TO VISIT THE FOLLOWING PAGES OF THE WEBSITE.
To visit the following parts of this website you must confirm that
(i) you are not a resident of the United States of America, Canada, Japan or Australia or a "US person" (as defined in Regulation S under the US Securities Act of 1933, as amended),
(ii) you are not a person to whom the communication of the information contained on the website is restricted,
(iii) you will not distribute any of the information and documents contained thereon to any such person, and
(iv) you are not acting for the benefit of any such person.
By clicking on the "Accept" button below, you will be deemed to have made this confirmation.
NOT FOR RELEASE, PUBLICATION OR DISTRIBUTION, DIRECTLY OR INDIRECTLY, IN OR INTO THE UNITED STATES OF AMERICA, AUSTRALIA, CANADA, SINGAPORE OR JAPAN.
---
Fresenius SE & Co. KGaA announced the successful issuance of a €1 billion dual-tranche bond offering on July 1, 2026. The bonds are expected to settle on July 8, 2026.
The transaction consists of the following two tranches:
- €500 million of fixed rate notes with a coupon rate of 3.375%, maturing July 8, 2031; and
- €500 million of fixed rate notes with a coupon rate of 3.750%, maturing July 8, 2034.
Fresenius will use the net proceeds of the offering for general corporate purposes, including the refinancing of existing financial liabilities.
The bonds were issued by Fresenius SE & Co. KGaA under the Fresenius Debt Issuance Program. The company has applied to have the bonds admitted to trading on the regulated market of the Luxembourg Stock Exchange.
The bond issuance does not impact Fresenius' full-year 2026 financial guidance, and the transaction fully covers refinancing requirements for the full year 2026 while proactively addressing certain debt maturities in 2027.
Overall, the transaction further strengthens Fresenius’ financial flexibility, limits potential future refinancing risks, and supports the balance sheet. In addition, the Company successfully extends the average maturity of its debt portfolio. Fresenius remains committed to its self-imposed target leverage corridor of 2.5 to 3.0x net debt/EBITDA. Deleveraging and a strong balance sheet are clear priorities within the Company’s stated capital allocation priorities, which are key to delivering the ambitions of #FutureFresenius.
This release contains forward-looking statements that are subject to various risks and uncertainties. Future results could differ materially from those described in these forward-looking statements due to certain factors, e.g. changes in business, economic and competitive conditions, regulatory reforms, results of clinical trials, foreign exchange rate fluctuations, uncertainties in litigation or investigative proceedings, the availability of financing and unforeseen impacts of international conflicts. Fresenius does not undertake any responsibility to update the forward-looking statements in this release.
This announcement does not contain or constitute an offer of, or the solicitation of an offer to buy or subscribe for, securities to any person in Australia, Canada, Japan, Singapore or the United States of America (the “United States”) or in any jurisdiction to whom or in which such offer or solicitation is unlawful. The securities referred to herein may not be offered or sold in the United States or to, or for the account or benefit of, U.S. persons, absent registration under the U.S. Securities Act of 1933, as amended (the “Securities Act”) except pursuant to an exemption from, or in a transaction not subject to, the registration requirements of the Securities Act. Subject to certain exceptions, the securities referred to herein may not be offered or sold in Australia, Canada, Japan or Singapore or to, or for the account or benefit of, any national, resident or citizen of Australia, Canada, Japan or Singapore. The offer and sale of the securities referred to herein has not been and will not be registered under the Securities Act or under the applicable securities laws of Australia, Canada, Japan or Singapore. There will be no public offer of the securities in the United States.
This announcement contains forward-looking statements that are subject to various risks and uncertainties. Future results could differ materially from those described in these forward-looking statements due to certain factors, e.g. changes in business, economic and competitive conditions, regulatory reforms, results of clinical trials, foreign exchange rate fluctuations, uncertainties in litigation or investigative proceedings, the availability of financing and unforeseen impacts of international conflicts. Neither Fresenius SE & Co. KGaA, Fresenius Finance Ireland Public Limited Company nor Fresenius Finance Ireland II Public Limited Company undertake any responsibility to update the forward-looking statements in this announcement.
This announcement is a general information and not a prospectus. It has been prepared on the basis that any offer of securities in any Member State of the European Economic Area ("EEA") will be made pursuant to the prospectus and any supplement thereto prepared by Fresenius SE & Co. KGaA, Fresenius Finance Ireland Public Limited Company and Fresenius Finance Ireland II Public Limited Company in combination with the relevant final terms relating to such securities or pursuant to an exemption under Regulation (EU) 2017/1129 (the “Prospectus Regulation”) from the requirement to publish a prospectus for offers of securities. Investors should not purchase or subscribe for any securities referred to in this announcement except on the basis of information in the prospectus, as supplemented, in combination with the relevant final terms relating to such securities, to be issued by the company in connection with the offering of such securities. The applicable final terms for such securities, when published, will be available on the website of the Luxembourg Stock Exchange (www.LuxSE.com) together with the prospectus and any supplement thereto. Copies of the prospectus are also available free of charge from Fresenius SE & Co. KGaA at Else-Kröner Strasse 1, 61352 Bad Homburg, Germany.
This announcement is directed at and/or for distribution in the United Kingdom only to (i) persons who have professional experience in matters relating to investments falling within article 19(5) of the Financial Services and Markets Act 2000 (Financial Promotion) Order 2005 (the “Order”) or (ii) high net worth entities falling within article 49(2)(a) to (d) of the Order (all such persons are referred to herein as “relevant persons”). This announcement is directed only at relevant persons. Any person who is not a relevant person should not act or rely on this announcement or any of its contents. Any investment or investment activity to which this announcement relates is available only to relevant persons and will be engaged in only with relevant persons.
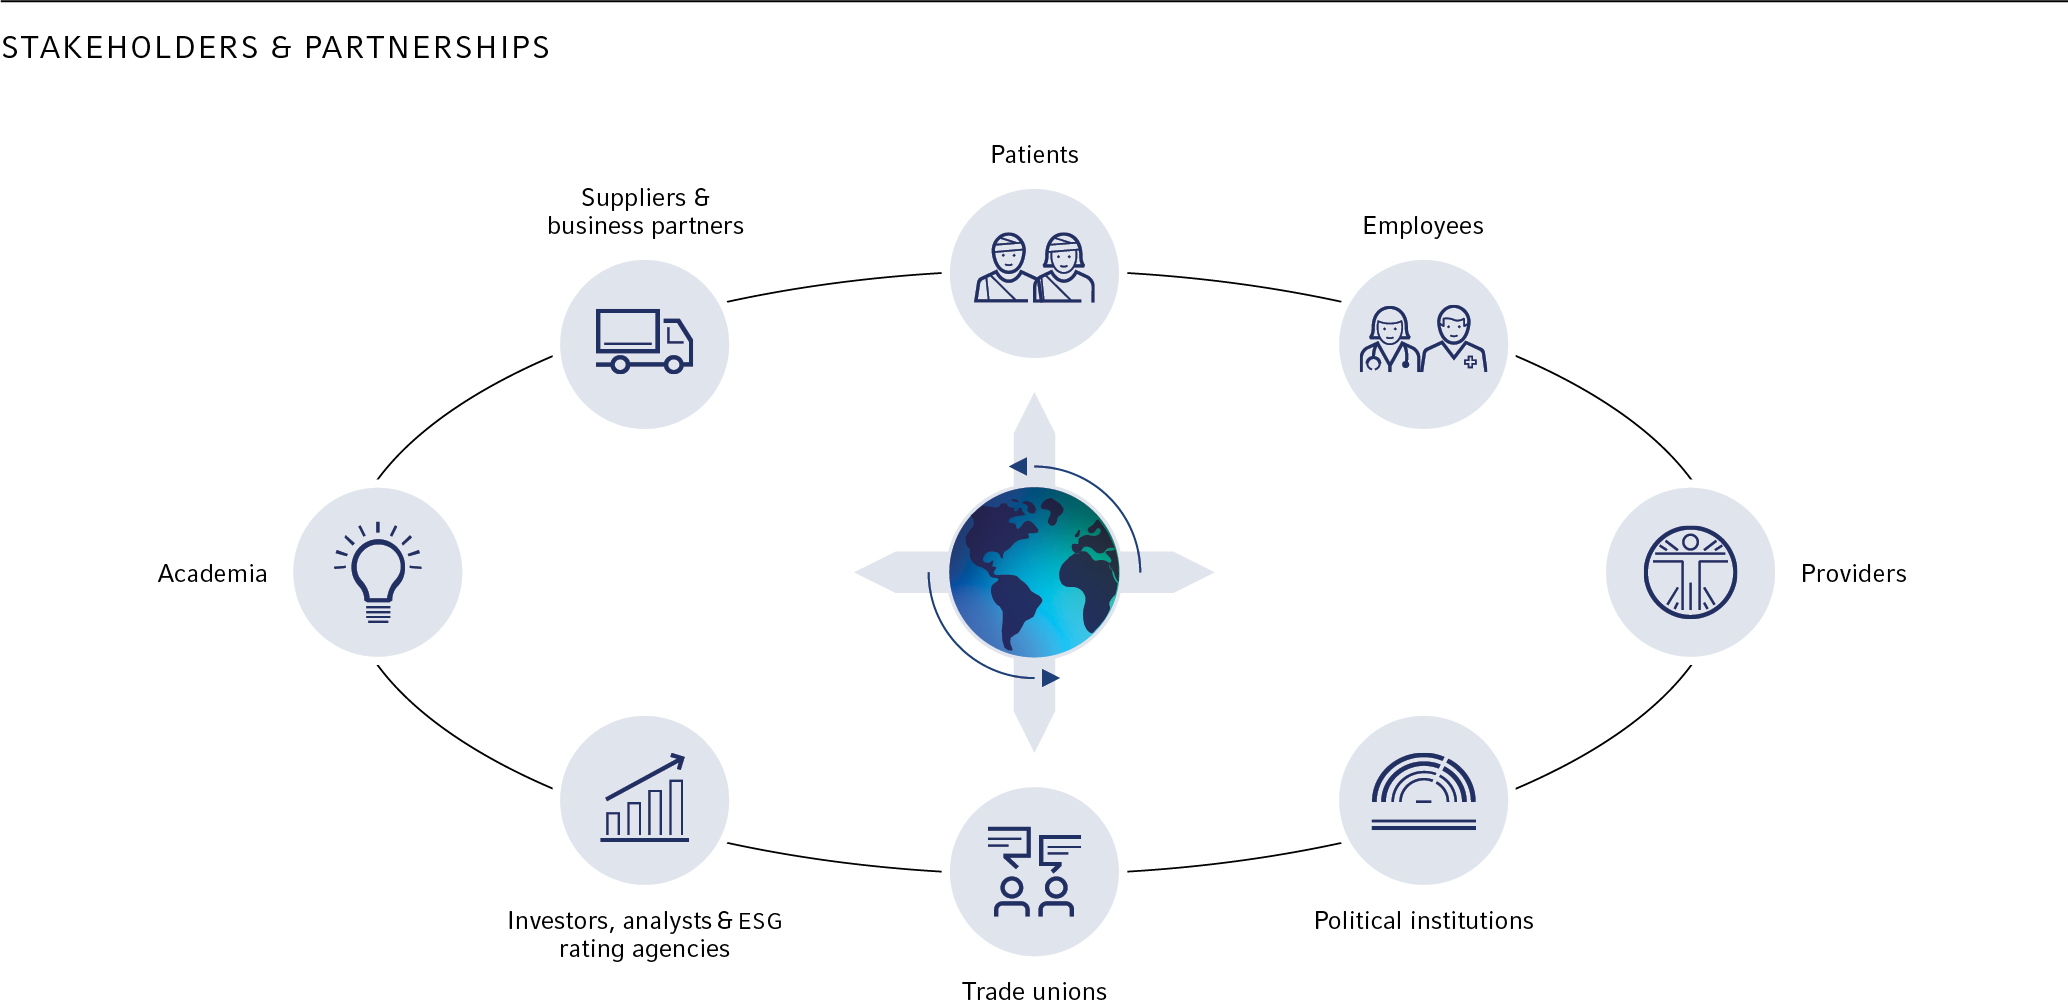
Fresenius is integrated into a diverse network of interest groups. From this exchange, we gain valuable insights that help us to continuously improve the management of material topics and reporting.
Our Approach
We engage with our stakeholders through a variety of channels. The corporate functions at Fresenius primarily focus on stakeholders who are relevant to the Group as a whole. The Operating Companies actively engage with patients, employees, customers, and regulatory authorities, among others.
For the integration of potentially affected stakeholders in our operating activities, we consider, for example, findings from existing due diligence processes and risk assessments in quality, internal employee satisfaction surveys, dialogs with employee representatives and works councils, patient and customer surveys.

➔ Read more in our Sustainability Statement.
Initiatives & Memberships
An important element of our stakeholder dialogs is our active participation in industry and interest groups, as well as our exchange with business partners. Our employees contribute their expertise to national and international bodies, committees, and associations.
We are committed to observing the codes and principles associated with our membership in various associations. In addition, we disclose all contributions made to healthcare professionals in the companies of Fresenius in accordance with the applicable disclosure requirements.