

Fresenius successfully placed €1.0 billion of Schuldschein Loans. Given the substantial investor demand, the volume of the issuance was significantly upsized. The Schuldschein Loans were issued in tranches of five, seven and ten years with fixed and variable interest rates. The proceeds will be used general corporate purposes and the acquisition of Quirónsalud. Funding of the transaction will be on January 31, 2017. More than 230 investors participated. The placement was arranged by Bayerische Landesbank, Deutsche Bank AG, DZ BANK and NORD/LB Norddeutsche Landesbank Girozentrale.

Fresenius SE & Co. KGaA (“Fresenius”) will focus its reporting on financial statements in accordance with International Financial Reporting Standards (IFRS) starting with the 2017 fiscal year on January 1, 2017. The company will then no longer provide U.S. GAAP financial information.
Fresenius, as a publicly traded company based in a European Union member country, is required to prepare and publish its consolidated financial statements in accordance with International Financial Reporting Standards (IFRS) pursuant to Section 315a of the German Commercial Code (HGB).
In addition to this compulsory IFRS accounting, Fresenius also publishes consolidated financial statements in accordance with U.S. GAAP. This has provided comparability with the Group’s largest subsidiary, Fresenius Medical Care, which was required to report in accordance with U.S. GAAP under a so-called Pooling Agreement. However, Fresenius Medical Care’s 2016 Annual General Meeting has lifted this obligation.
In the interest of harmonizing the management and accounting of the Fresenius Group and all of its business segments, the Fresenius Group and all of its business segments will report solely in accordance with IFRS starting with the 2017 fiscal year on January 1, 2017.
For the 2016 fiscal year, Fresenius will as in past years provide both U.S. GAAP and IFRS consolidated financial statements.
No significant differences between IFRS and U.S. GAAP financial statements
Past reporting showed only limited differences between the consolidated U.S. GAAP and IFRS accounts of Fresenius SE & Co. KGaA. Historic IFRS figures for the Fresenius Group and its individual business segments are provided on our Investor Relations website.
No effect on the ADR program
The discontinuation of U.S. GAAP reporting will not affect the sponsored Level 1 American Depositary Receipt (ADR) program of Fresenius SE & Co. KGaA in the United States. The ADRs will continue to trade under the FSNUY ticker on the over-the-counter OTCQX International Premier market.
This release contains forward-looking statements that are subject to various risks and uncertainties. Future results could differ materially from those described in these forward-looking statements due to certain factors, e.g. changes in business, economic and competitive conditions, regulatory reforms, results of clinical trials, foreign exchange rate fluctuations, uncertainties in litigation or investigative proceedings, and the availability of financing. Fresenius does not undertake any responsibility to update the forward-looking statements in this release.
If no timeframe is specified, information refers to Q1-3/2016
Q1-3/2016:
- Sales: €21.3 billion (+5%, +6% in constant currency)
- EBIT1: €3,092 million (+9%, +9% in constant currency)
- Net income1,2: €1,154 million (+14%, +15% in constant currency)
Q3/2016:
- Sales: €7.3 billion (+6%, +7% in constant currency)
- EBIT1: €1,082 million (+5%, +6% in constant currency)
- Net income1,2: €399 million (+9%, +10% in constant currency)
Stephan Sturm, CEO of Fresenius, said: “We achieved substantial earnings growth in the third quarter, following our very strong development in the first half. Each business segment continued to grow organically in every region. That makes us even more confident for the full year 2016. We are also full of optimism about our medium-term prospects. The acquisition of the Spanish hospital group Quirónsalud will further broaden our foundation for continued strong growth. This will be reflected in the ambitious targets for the coming years that we will announce with our forecast for 2017.”
1 2015 before special items2 Net income attributable to shareholders of Fresenius SE & Co. KGaAFor a detailed overview of special items please see the reconciliation tables on pages 15-16 of the pdf file.
Lower end of 2016 Group earnings guidance raised
Based on the Group’s excellent financial results and strong prospects for the remainder of the year, Fresenius raises the lower end of its 2016 Group earnings guidance range. The upper end of the Group’s earnings guidance remains unchanged, due to the offsetting effect of financing costs related to the Quirónsalud acquisition. Net income1,2 , is now expected to grow by 12% to 14% in constant currency. Previously, Fresenius expected net income1,2 growth of 11% to 14% in constant currency. The company confirms its Group sales guidance. Sales are expected to increase by 6% to 8% in constant currency.
The net debt/EBITDA3 ratio is expected to be approximately 2.5 at the end of 2016.
1Net income attributable to shareholders of Fresenius SE & Co. KGaA22015 before special items3Calculated at FY average exchange rates for both net debt and EBITDA; excluding potential acquisitionsFor a detailed overview of special items please see the reconciliation tables on pages 15-16 of the pdf file.
6% sales growth in constant currency
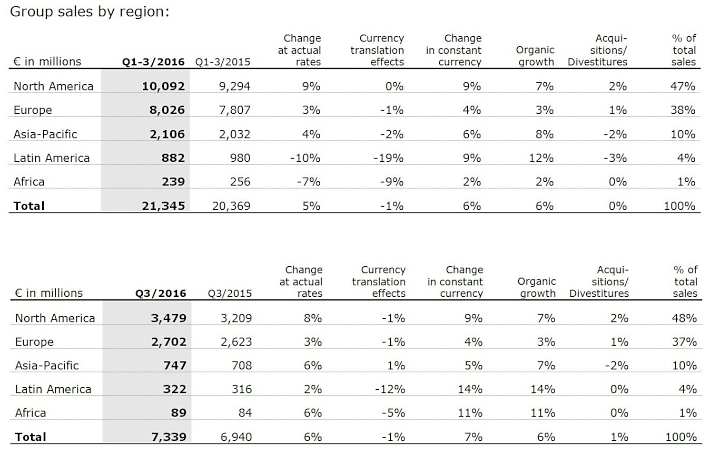
Group sales increased by 5% (6% in constant currency) to €21,345 million (Q1-3/2015: €20,369 million). Organic sales growth was 6%. The minor negative currency translation effects (-1%) were mainly related to the devaluation of Latin American currencies against the Euro. Acquisitions contributed 1% and divestitures reduced sales by 1%. In Q3/2016, Group sales increased by 6% (7% in constant currency) to €7,339 million (Q3/2015: €6,940 million). Organic sales growth was 6%. Acquisitions contributed 1%.
15% net income1,2 growth in constant currency
Group EBITDA2 increased by 7% (8% in constant currency) to €3,949 million (Q1-3/2015: €3,674 million). Group EBIT2 increased by 9% (9% in constant currency) to €3,092 million (Q1-3/2015: €2,849 million). The EBIT margin2 increased to 14.5% (Q1-3/2015: 14.0%). In Q3/2016, Group EBIT2 increased by 5% (6% in constant currency) to €1,082 million (Q3/2015: €1,027 million), the EBIT margin2 was 14.7% (Q3/2015: 14.8%).
Group net interest decreased to -€433 million (Q1-3/2015: -€476 million), mainly due to more favorable financing terms and lower net debt.
With 28.1%, the Group tax rate2 was below the previous year (Q1 3/2015: 29.6%). The decrease is mainly due to released tax accruals at Fresenius Medical Care in Q3/2016. In Q3/2016, the Group tax rate was 27.1% (Q3/2015: 29.7%).
Noncontrolling interest increased to €759 million (Q1-3/2015: €661 million), of which 96% was attributable to the noncontrolling interest in Fresenius Medical Care.
Group net income1,2 , increased by 14% (15% in constant currency) to €1,154 million (Q1-3/2015: €1,009 million). Earnings per share1,2 increased by 13% (15% in constant currency) to €2.11 (Q1-3/2015: €1.86). In Q3/2016, Group net income1,2 increased by 9% (10% in constant currency) to €399 million (Q3/2015: €367 million). Earnings per share1,2 increased by 7% (9% in constant currency) to €0.73 (Q3/2015: €0.68).
1Net income attributable to shareholders of Fresenius SE & Co. KGaA22015 before special items
For a detailed overview of special items please see the reconciliation tables on pages 15-16 of the pdf file.
Continued investment in growth
Spending on property, plant and equipment was €1,044 million (Q1-3/2015: €950 million), primarily for the modernization and expansion of dialysis clinics, production facilities and hospitals.
Total acquisition spending was €592 million (Q1-3/2015: €272 million), including the acquisition of dialysis clinics and further expansion in the field of care coordination at Fresenius Medical Care, the acquisition of a U.S. pharmaceutical plant for ready-to-administer prefilled syringes at Fresenius Kabi and the acquisition of the municipal hospital Niederberg at Fresenius Helios.
Strong operating cash flow
Operating cash flow increased by 5% to €2,259 million (Q1-3/2015: €2,151 million) with a margin of 10.6% (Q1-3/2015: 10.6%). With €929 million, operating cash flow in Q3/2016 was slightly above the level of the strong prior-year quarter (Q3/2015: €900 million), despite of a US$100 million discretionary cash contribution of Fresenius Medical Care to its pension plan assets in the United States. The cash flow margin was 12.7% (Q3/2015: 13.0%).
Free cash flow before acquisitions and dividends decreased slightly to €1,207 million (Q1-3/2015: €1,219 million). Free cash flow after acquisitions and dividends was €253 million (Q1-3/2015: €574 million).
Solid balance sheet structure
The Group’s total assets increased by 3% (4% in constant currency) to €44,075 million (Dec. 31, 2015: €42,959 million), driven by its growing scale of operations. Current assets grew by 6% (7% in constant currency) to €11,135 million (Dec. 31, 2015: €10,479 million). Non-current assets increased by 1% (3% in constant currency) to €32,940 million (Dec. 31, 2015: € 32,480 million).
Total shareholders’ equity grew by 6% (7% in constant currency) to €19,086 million (Dec. 31, 2015: €18,003 million). The equity ratio increased to 43.3% (Dec. 31, 2015: 41.9%).
Group debt decreased by 2% (1% in constant currency) to €14,530 million (Dec. 31, 2015: € 14,769 million). As of September 30, 2016, the net debt/EBITDA ratio was 2.501,2, (Dec. 31, 2015: 2.681).
Increased number of employees
As of September 30, 2016, the number of employees increased by 4% to 231,432 (Dec. 31, 2015: 222,305).
12015 before special items; at LTM average exchange rates for both net debt and EBITDA2Pro forma acquisitions
For a detailed overview of special items please see the reconciliation tables on pages 15-16 of the pdf file.
Business Segments
Fresenius Medical Care
Fresenius Medical Care is the world's largest provider of products and services for individuals with chronic kidney failure. As of September 30, 2016, Fresenius Medical Care was treating 306,366 patients in 3,579 dialysis clinics. Along with its core business, the company seeks to expand the range of medical services in the field of care coordination.


- 9% sales growth in constant currency in Q3
- 27% net income growth in Q3 (17% before one-time items1)
- 2016 outlook confirmed
1Net income attributable to shareholders of Fresenius Medical Care AG & Co. KGaA22015 before divestiture of dialysis business in Venezuela (-US$27 million after tax) and European pharmaceutical business (US$5 million after tax)
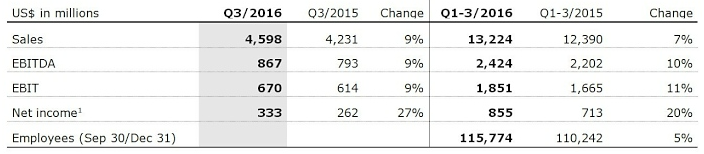
Sales increased by 7% (8% in constant currency) to US$13,224 million (Q1-3/2015: US$12,390 million). Organic sales growth was 7%. Acquisitions contributed 1%. In Q3/2016, sales increased by 9% (9% in constant currency) to US$4,598 million (Q3/2015: US$4,231 million). Organic sales growth was 7%.
Health Care services sales (dialysis services and care coordination) increased by 8% (9% in constant currency) to US$10,720 million (Q1-3/2015: US$9,929 million). Dialysis product sales increased by 2% (4% in constant currency) to US$2,504 million (Q1-3/2015: US$2,461 million).
In North America, sales increased by 9% to US$9,512 million (Q1-3/2015: US$8,730 million). Health Care services sales grew by 9% to US$8,838 million (Q1-3/2015: US$8,087 million). Dialysis product sales increased by 5% to US$674 million (Q1-3/2015: US$642 million).
Sales outside North America increased by 2% (7% in constant currency) to US$3,700 million (Q1-3/2015: US$3,639 million). Health Care services sales increased by 2% (9% in constant currency) to US$1,882 million (Q1-3/2015: US$1,842 million). Dialysis product sales remained nearly unchanged at (increased by 5% in constant currency to) US$1,819 million (Q1-3/2015: US$1,797 million).
EBIT increased by 11% (12% in constant currency) to US$1,851 million (Q1-3/2015: US$1,665 million). The EBIT margin was 14.0% (Q1-3/2015: 13.4%). EBIT before one-time items1 increased by 10%. In Q3/2016, EBIT increased by 9% (10% in constant currency) to US$670 million (Q3/2015: US$614 million). The EBIT margin was 14.6% (Q3/2015: 14.5%). EBIT before one-time items1 increased by 6%.
Net income2 increased by 20% (20% in constant currency) to US$855 million (Q1-3/2015: US$713 million). Net income before one-time items2,3, increased by 16%. In Q3/2016, net income2 grew by 27% (28% in constant currency) to US$333 million (Q3/2015: US$262 million). Net income before one-time items2,3 increased by 17%.
Operating cash flow decreased by 8% to US$1,296 million (Q1-3/2015: US$1,412 million). The cash flow margin was 9.8% (Q1-3/2015: 11.4%). The decrease is mainly attributable to a discretionary cash contribution of US$100 million to Fresenius Medical Care’s pension plan assets in the United States. As a consequence, in Q3/2016, operating cash flow decreased to US$439 million (Q3/2015: US$579 million) with a cash flow margin of 9.5% (Q3/2015: 13.7%).
Fresenius Medical Care confirms its outlook for 2016. The company expects sales to grow by 7% to 10% in constant currency. Net income1 is expected to increase by 15% to 20%4 .
For further information, please see Fresenius Medical Care’s Investor News at www.freseniusmedicalcare.com.
1 2015 before divestiture of dialysis business in Venezuela (-US$26 million before tax) and European pharmaceutical business (US$8 million before tax)
2 Net income attributable to shareholders of Fresenius Medical Care AG & Co. KGaA
3 2015 before divestiture of dialysis business in Venezuela (-US$27 million after tax) and European pharmaceutical business (US$5 million after tax)
4 2015 before GranuFlo®/NaturaLyte® settlement costs (-US$37 million after tax) and before acquisitions (US$9 million after tax); hence the basis for expected net income growth is US$1,057 million.
Fresenius Kabi
Fresenius Kabi offers intravenously administered generic drugs, clinical nutrition and infusion therapies for seriously and chronically ill patients in the hospital and outpatient environments. The company is also a leading supplier of medical devices and transfusion technology products.


- 5% organic sales growth in Q3
- 1% constant currency EBIT1 growth in Q3
- 2016 outlook raised: both, organic sales growth and EBIT1 growth in constant currency of 4% to 6% expected
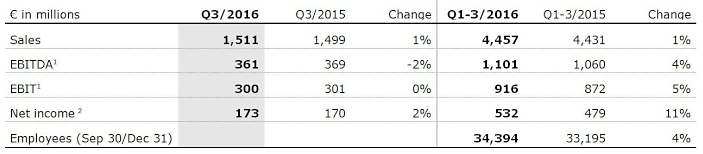
Sales increased by 4% in constant currency to €4,457 million (Q1-3/2015: €4,431 million). Organic sales growth was 6%. The divestment of the Australian and German oncology compounding business reduced sales by 2%. In Q3/2016, sales increased by 1% (by 3% in constant currency) to €1,511 million (Q3/2015: €1,499 million). Negative currency translation effects (-2%) were mainly related to the devaluation of the Chinese yuan and the Argentine peso against the Euro. Organic sales growth was 5%.Sales in Europe remained nearly unchanged at €1,569 million (Q1-3/2015: €1,566 million). Organic sales growth was 2%. Divestitures reduced sales by 2%. In Q3/2016, sales of €521 million were slightly above prior-year level (Q3/2015: €514 million). Organic sales growth was 3%.
Sales in North America increased by 5% (organic growth: 5%) to €1,628 million (Q1-3/2015: €1,555 million), mainly driven by new product launches. In Q3/2016, sales increased by 2% (organic growth: 2%) to €542 million (Q3/2015: €529 million).
Sales in Asia-Pacific decreased by 5% (organic growth: 8%) to €821 million (Q1-3/2015: €862 million). Adverse currency translation effects reduced sales by 5%, divestitures by another 8%. In Q3/2016, sales decreased by 3% (organic growth: 9%) to €290 million (Q3/2015: €298 million).
Given adverse currency translation effects, sales in Latin America/Africa decreased by 2% (organic growth: 16%, in particular due to inflation driven price increases) to €439 million (Q1-3/2015: €448 million). In Q3/2016, sales remained unchanged at €158 million (Q3/2015: €158 million). Organic sales growth was 7%.
EBIT1 increased by 5% (7% in constant currency) to €916 million (Q1-3/2015: €872 million). The EBIT margin1 improved to 20.6% (Q1-3/2015: 19.7%). In Q3/2016, EBIT1 remained virtually unchanged at €300 million (Q3/2015: €301 million). EBIT1 increased by 1% in constant currency. The EBIT margin1 was 19.9% (Q3/2015: 20.1%).
Net income2 increased by 11% (12% in constant currency) to €532 million (Q1-3/2015: €479 million). In Q3/2016, net income2 increased by 2% (3% in constant currency) to €173 million (Q3/2015: €170 million).
Operating cash flow increased by 10% to €646 million (Q1-3/2015: €589 million) with a margin of 14.5% (Q1-3/2015: 13.3%). In Q3/2016, operating cash flow increased by 32% to €311 million (Q3/2015: €235 million), due to a catch-up from Q2/2016 and temporarily reduced net working capital requirements. The cash flow margin increased to 20.6% (Q3/2015: 15.7%).
Fresenius Kabi raises its outlook for 2016 and now expects both organic sales growth and EBIT1 growth in constant currency of 4% to 6%. Previously, Fresenius Kabi had projected 3% to 5% for both metrics.
12015 before special items2Net income attributable to shareholders of Fresenius Kabi AG; 2015 before special itemsFor a detailed overview of special items please see the reconciliation tables on pages 15-16 of the .pdf file.
Fresenius Helios
Fresenius Helios is Germany’s largest hospital operator. HELIOS operates 112 hospitals, thereof 88 acute care clinics (including seven maximum care hospitals in Berlin-Buch, Duisburg, Erfurt, Krefeld, Schwerin, Wiesbaden and Wuppertal) and 24 post-acute care clinics. HELIOS treats more than 4.7 million patients per year, thereof approximately 1.3 million inpatients, and operates approximately 35,000 beds.


- 4% organic sales growth in Q3
- 20 bps sequential EBIT margin increase
- 2016 outlook confirmed
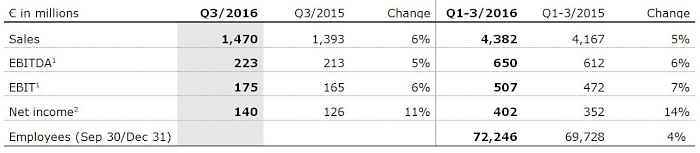
Sales increased by 5% to €4,382 million (Q1-3/2015: €4,167 million). Organic sales growth was 4%. Acquisitions increased sales by 1%. In Q3/2016, sales increased by 6% to €1,470 million (Q3/2015: €1,393 million). Organic sales growth was 4%.
EBIT1 grew by 7% to €507 million (Q1-3/2015: €472 million). The EBIT margin1 increased to 11.6% (Q1-3/2015: 11.3%). In Q3/2016, EBIT1 increased by 6% to €175 million (Q3/2015: €165 million). Sequentially, the EBIT margin increased by 20 bps to 11.9%.
Net income2 increased by 14% to €402 million (Q1-3/2015: €352 million). In Q3/2016, net income2 increased by 11% to €140 million (Q3/2015: €126 million).
Operating cash flow increased by 13% to €437 million (Q1-3/2015: €386 million) with a margin of 10.0% (Q1-3/2015: 9.3%). In Q3/2016 operating cash flow increased by 34% to €207 million (Q3/2015: €155 million), mainly driven by decreased working capital. The cash flow margin increased to 14.1% (Q3/2015: 11.1%).
Fresenius Helios confirms its outlook for 2016 and projects organic sales growth of 3% to 5%. EBIT is expected to increase to €670 to €700 million.
Fresenius Helios expects the acquisition of Quirónsalud to close in Q1/2017.
12015 before special items2Net income attributable to shareholders of HELIOS Kliniken GmbH; 2015 before special items
For a detailed overview of special items please see the reconciliation tables on pages 15-16 of the pdf file.
Fresenius Vamed
Fresenius Vamed manages projects and provides services for hospitals and other health care facilities worldwide. The portfolio ranges along the entire value chain: from project development, planning, and turnkey construction, via maintenance and technical management, to total operational management.


- Strong order intake of €209 million in Q3
- 2016 outlook confirmed
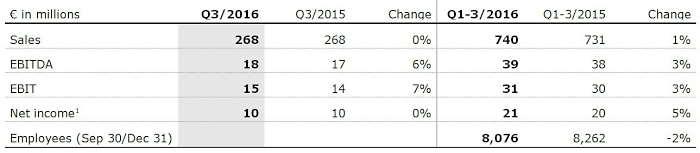
Sales increased by 1% (1% in constant currency) to €740 million (Q1-3/2015: €731 million). Organic sales growth was 2%. Sales in the project business decreased by 2% to €325 million (Q1-3/2015: €333 million). Sales in the service business grew by 4% to €415 million (Q1-3/2015: €398 million). In Q3/2016, sales remained unchanged at €268 million (Q3/2015: €268 million). Organic sales growth was 1%.
EBIT increased by 3% to €31 million (Q1-3/2015: €30 million). The EBIT margin increased to 4.2% (Q1-3/2015: 4.1%). In Q3/2016, EBIT increased by 7% to €15 million (Q3/2015: €14 million). The EBIT margin increased to 5.6% (Q3/2015: 5.2%).
Net income1 grew by 5% to €21 million (Q1-3/2015: €20 million). In Q3/2016, net income1 of €10 million was at prior-year level (Q3/2015: €10 million).
Order intake increased by 42% to €674 million (Q1-3/2015: €476 million). In Q3/2016, order intake increased by 9% to €209 million (Q3/2015: €192 million). As of September 30, 2016, order backlog grew to €1,995 million (December 31, 2015: €1,650 million).
Fresenius Vamed confirms its outlook for 2016 and expects organic sales growth in the range of 5% to 10% and EBIT growth of 5% to 10%.
1Net income attributable to shareholders of VAMED AG
Conference Call
As part of the publication of the results for the first nine months of 2016, a conference call will be held on October 27, 2016 at 2 p.m. CEDT (8 a.m. EDT). All investors are cordially invited to follow the conference call in a live broadcast over the Internet at www.fresenius.com/media. Following the call, a replay will be available on our website.
This release contains forward-looking statements that are subject to various risks and uncertainties. Future results could differ materially from those described in these forward-looking statements due to certain factors, e.g. changes in business, economic and competitive conditions, regulatory reforms, results of clinical trials, foreign exchange rate fluctuations, uncertainties in litigation or investigative proceedings, and the availability of financing. Fresenius does not undertake any responsibility to update the forward-looking statements in this release.
If no timeframe is specified, information refers to Q1-3/2016
Q1-3/2016:
- Sales: €21.3 billion (+5%, +6% in constant currency)
- EBIT1: €3,092 million (+9%, +9% in constant currency)
- Net income1,2: €1,154 million (+14%, +15% in constant currency)
Q3/2016:
- Sales: €7.3 billion (+6%, +7% in constant currency)
- EBIT1: €1,082 million (+5%, +6% in constant currency)
- Net income1,2: €399 million (+9%, +10% in constant currency)
Stephan Sturm, CEO of Fresenius, said: “We achieved substantial earnings growth in the third quarter, following our very strong development in the first half. Each business segment continued to grow organically in every region. That makes us even more confident for the full year 2016. We are also full of optimism about our medium-term prospects. The acquisition of the Spanish hospital group Quirónsalud will further broaden our foundation for continued strong growth. This will be reflected in the ambitious targets for the coming years that we will announce with our forecast for 2017.”
1 2015 before special items2 Net income attributable to shareholders of Fresenius SE & Co. KGaA
For a detailed overview of special items please see the reconciliation tables on pages 15-16 of the .pdf file.
Lower end of 2016 Group earnings guidance raised
Based on the Group’s excellent financial results and strong prospects for the remainder of the year, Fresenius raises the lower end of its 2016 Group earnings guidance range. The upper end of the Group’s earnings guidance remains unchanged, due to the offsetting effect of financing costs related to the Quirónsalud acquisition. Net income1,2 is now expected to grow by 12% to 14% in constant currency. Previously, Fresenius expected net income1,2 growth of 11% to 14% in constant currency. The company confirms its Group sales guidance. Sales are expected to increase by 6% to 8% in constant currency.
The net debt/EBITDA3 ratio is expected to be approximately 2.5 at the end of 2016.
1 Net income attributable to shareholders of Fresenius SE & Co. KGaA2 2015 before special items3 Calculated at FY average exchange rates for both net debt and EBITDA; excluding potential acquisitionsFor a detailed overview of special items please see the reconciliation tables on pages 15-16 of the .pdf file.
6% sales growth in constant currency
Group sales increased by 5% (6% in constant currency) to €21,345 million (Q1-3/2015: €20,369 million). Organic sales growth was 6%. The minor negative currency translation effects (-1%) were mainly related to the devaluation of Latin American currencies against the Euro. Acquisitions contributed 1% and divestitures reduced sales by 1%. In Q3/2016, Group sales increased by 6% (7% in constant currency) to €7,339 million (Q3/2015: €6,940 million). Organic sales growth was 6%. Acquisitions contributed 1%.
Group sales by region:


15% net income1,2 growth in constant currency
Group EBITDA2 increased by 7% (8% in constant currency) to €3,949 million (Q1-3/2015: €3,674 million). Group EBIT2 increased by 9% (9% in constant currency) to €3,092 million (Q1-3/2015: €2,849 million). The EBIT margin2 increased to 14.5% (Q1-3/2015: 14.0%). In Q3/2016, Group EBIT2 increased by 5% (6% in constant currency) to €1,082 million (Q3/2015: €1,027 million), the EBIT margin2 was 14.7% (Q3/2015: 14.8%).
Group net interest decreased to -€433 million (Q1-3/2015: -€476 million), mainly due to more favorable financing terms and lower net debt.
With 28.1%, the Group tax rate2 was below the previous year (Q1 3/2015: 29.6%). The decrease is mainly due to released tax accruals at Fresenius Medical Care in Q3/2016. In Q3/2016, the Group tax rate was 27.1% (Q3/2015: 29.7%).
Noncontrolling interest increased to €759 million (Q1-3/2015: €661 million), of which 96% was attributable to the noncontrolling interest in Fresenius Medical Care.
Group net income1,2 , increased by 14% (15% in constant currency) to €1,154 million (Q1-3/2015: €1,009 million). Earnings per share1,2 increased by 13% (15% in constant currency) to €2.11 (Q1-3/2015: €1.86). In Q3/2016, Group net income1,2 increased by 9% (10% in constant currency) to €399 million (Q3/2015: €367 million). Earnings per share1,2 increased by 7% (9% in constant currency) to €0.73 (Q3/2015: €0.68).
1 Net income attributable to shareholders of Fresenius SE & Co. KGaA2 2015 before special itemsFor a detailed overview of special items please see the reconciliation tables on pages 15-16 of the .pdf file.
Continued investment in growth
Spending on property, plant and equipment was €1,044 million (Q1-3/2015: €950 million), primarily for the modernization and expansion of dialysis clinics, production facilities and hospitals.
Total acquisition spending was €592 million (Q1-3/2015: €272 million), including the acquisition of dialysis clinics and further expansion in the field of care coordination at Fresenius Medical Care, the acquisition of a U.S. pharmaceutical plant for ready-to-administer prefilled syringes at Fresenius Kabi and the acquisition of the municipal hospital Niederberg at Fresenius Helios.
Strong operating cash flow
Operating cash flow increased by 5% to €2,259 million (Q1-3/2015: €2,151 million) with a margin of 10.6% (Q1-3/2015: 10.6%). With €929 million, operating cash flow in Q3/2016 was slightly above the level of the strong prior-year quarter (Q3/2015: €900 million), despite of a US$100 million discretionary cash contribution of Fresenius Medical Care to its pension plan assets in the United States. The cash flow margin was 12.7% (Q3/2015: 13.0%).
Free cash flow before acquisitions and dividends decreased slightly to €1,207 million (Q1-3/2015: €1,219 million). Free cash flow after acquisitions and dividends was €253 million (Q1-3/2015: €574 million).
Solid balance sheet structure
The Group’s total assets increased by 3% (4% in constant currency) to €44,075 million (Dec. 31, 2015: €42,959 million), driven by its growing scale of operations. Current assets grew by 6% (7% in constant currency) to €11,135 million (Dec. 31, 2015: €10,479 million). Non-current assets increased by 1% (3% in constant currency) to €32,940 million (Dec. 31, 2015: € 32,480 million).
Total shareholders’ equity grew by 6% (7% in constant currency) to €19,086 million (Dec. 31, 2015: €18,003 million). The equity ratio increased to 43.3% (Dec. 31, 2015: 41.9%).
Group debt decreased by 2% (1% in constant currency) to €14,530 million (Dec. 31, 2015: € 14,769 million). As of September 30, 2016, the net debt/EBITDA ratio was 2.501,2, (Dec. 31, 2015: 2.681).
1 2015 before special items; at LTM average exchange rates for both net debt and EBITDA2 Pro forma acquisitionsFor a detailed overview of special items please see the reconciliation tables on pages 15-16 of the .pdf file.
Increased number of employees
As of September 30, 2016, the number of employees increased by 4% to 231,432 (Dec. 31, 2015: 222,305).
Business Segments
Fresenius Medical Care
Fresenius Medical Care is the world's largest provider of products and services for individuals with chronic kidney failure. As of September 30, 2016, Fresenius Medical Care was treating 306,366 patients in 3,579 dialysis clinics. Along with its core business, the company seeks to expand the range of medical services in the field of care coordination.

- 9% sales growth in constant currency in Q3
- 27% net income growth in Q3 (17% before one-time items1)
- 2016 outlook confirmed
1 Net income attributable to shareholders of Fresenius Medical Care AG & Co. KGaA2 2015 before divestiture of dialysis business in Venezuela (-US$27 million after tax) and European pharmaceutical business (US$5 million after tax)
Sales increased by 7% (8% in constant currency) to US$13,224 million (Q1-3/2015: US$12,390 million). Organic sales growth was 7%. Acquisitions contributed 1%. In Q3/2016, sales increased by 9% (9% in constant currency) to US$4,598 million (Q3/2015: US$4,231 million). Organic sales growth was 7%.
Health Care services sales (dialysis services and care coordination) increased by 8% (9% in constant currency) to US$10,720 million (Q1-3/2015: US$9,929 million). Dialysis product sales increased by 2% (4% in constant currency) to US$2,504 million (Q1-3/2015: US$2,461 million).
In North America, sales increased by 9% to US$9,512 million (Q1-3/2015: US$8,730 million). Health Care services sales grew by 9% to US$8,838 million (Q1-3/2015: US$8,087 million). Dialysis product sales increased by 5% to US$674 million (Q1-3/2015: US$642 million).
Sales outside North America increased by 2% (7% in constant currency) to US$3,700 million (Q1-3/2015: US$3,639 million). Health Care services sales increased by 2% (9% in constant currency) to US$1,882 million (Q1-3/2015: US$1,842 million). Dialysis product sales remained nearly unchanged at (increased by 5% in constant currency to) US$1,819 million (Q1-3/2015: US$1,797 million).
EBIT increased by 11% (12% in constant currency) to US$1,851 million (Q1-3/2015: US$1,665 million). The EBIT margin was 14.0% (Q1-3/2015: 13.4%). EBIT before one-time items1 increased by 10%. In Q3/2016, EBIT increased by 9% (10% in constant currency) to US$670 million (Q3/2015: US$614 million). The EBIT margin was 14.6% (Q3/2015: 14.5%). EBIT before one-time items1 increased by 6%.
Net income2 increased by 20% (20% in constant currency) to US$855 million (Q1-3/2015: US$713 million). Net income before one-time items2,3, increased by 16%. In Q3/2016, net income2 grew by 27% (28% in constant currency) to US$333 million (Q3/2015: US$262 million). Net income before one-time items2,3 increased by 17%.
Operating cash flow decreased by 8% to US$1,296 million (Q1-3/2015: US$1,412 million). The cash flow margin was 9.8% (Q1-3/2015: 11.4%). The decrease is mainly attributable to a discretionary cash contribution of US$100 million to Fresenius Medical Care’s pension plan assets in the United States. As a consequence, in Q3/2016, operating cash flow decreased to US$439 million (Q3/2015: US$579 million) with a cash flow margin of 9.5% (Q3/2015: 13.7%).
Fresenius Medical Care confirms its outlook for 2016. The company expects sales to grow by 7% to 10% in constant currency. Net income1 is expected to increase by 15% to 20%4 .
For further information, please see Fresenius Medical Care’s Investor News at www.freseniusmedicalcare.com.
1 2015 before divestiture of dialysis business in Venezuela (-US$26 million before tax) and European pharmaceutical business (US$8 million before tax)
2 Net income attributable to shareholders of Fresenius Medical Care AG & Co. KGaA
3 2015 before divestiture of dialysis business in Venezuela (-US$27 million after tax) and European pharmaceutical business (US$5 million after tax)
4 2015 before GranuFlo®/NaturaLyte® settlement costs (-US$37 million after tax) and before acquisitions (US$9 million after tax); hence the basis for expected net income growth is US$1,057 million.
Fresenius Kabi
Fresenius Kabi offers intravenously administered generic drugs, clinical nutrition and infusion therapies for seriously and chronically ill patients in the hospital and outpatient environments. The company is also a leading supplier of medical devices and transfusion technology products.

- 5% organic sales growth in Q3
- 1% constant currency EBIT1 growth in Q3
- 2016 outlook raised: both, organic sales growth and EBIT1 growth in constant currency of 4% to 6% expected
Sales increased by 4% in constant currency to €4,457 million (Q1-3/2015: €4,431 million). Organic sales growth was 6%. The divestment of the Australian and German oncology compounding business reduced sales by 2%. In Q3/2016, sales increased by 1% (by 3% in constant currency) to €1,511 million (Q3/2015: €1,499 million). Negative currency translation effects (-2%) were mainly related to the devaluation of the Chinese yuan and the Argentine peso against the Euro. Organic sales growth was 5%.
Sales in Europe remained nearly unchanged at €1,569 million (Q1-3/2015: €1,566 million). Organic sales growth was 2%. Divestitures reduced sales by 2%. In Q3/2016, sales of €521 million were slightly above prior-year level (Q3/2015: €514 million). Organic sales growth was 3%.
Sales in North America increased by 5% (organic growth: 5%) to €1,628 million (Q1-3/2015: €1,555 million), mainly driven by new product launches. In Q3/2016, sales increased by 2% (organic growth: 2%) to €542 million (Q3/2015: €529 million).
Sales in Asia-Pacific decreased by 5% (organic growth: 8%) to €821 million (Q1-3/2015: €862 million). Adverse currency translation effects reduced sales by 5%, divestitures by another 8%. In Q3/2016, sales decreased by 3% (organic growth: 9%) to €290 million (Q3/2015: €298 million).
Given adverse currency translation effects, sales in Latin America/Africa decreased by 2% (organic growth: 16%, in particular due to inflation driven price increases) to €439 million (Q1-3/2015: €448 million). In Q3/2016, sales remained unchanged at €158 million (Q3/2015: €158 million). Organic sales growth was 7%.
EBIT1 increased by 5% (7% in constant currency) to €916 million (Q1-3/2015: €872 million). The EBIT margin1 improved to 20.6% (Q1-3/2015: 19.7%). In Q3/2016, EBIT1 remained virtually unchanged at €300 million (Q3/2015: €301 million). EBIT1 increased by 1% in constant currency. The EBIT margin1 was 19.9% (Q3/2015: 20.1%).
Net income2 increased by 11% (12% in constant currency) to €532 million (Q1-3/2015: €479 million). In Q3/2016, net income2 increased by 2% (3% in constant currency) to €173 million (Q3/2015: €170 million).
Operating cash flow increased by 10% to €646 million (Q1-3/2015: €589 million) with a margin of 14.5% (Q1-3/2015: 13.3%). In Q3/2016, operating cash flow increased by 32% to €311 million (Q3/2015: €235 million), due to a catch-up from Q2/2016 and temporarily reduced net working capital requirements. The cash flow margin increased to 20.6% (Q3/2015: 15.7%).
Fresenius Kabi raises its outlook for 2016 and now expects both organic sales growth and EBIT1 growth in constant currency of 4% to 6%. Previously, Fresenius Kabi had projected 3% to 5% for both metrics.
1 2015 before special items2 Net income attributable to shareholders of Fresenius Kabi AG; 2015 before special itemsFor a detailed overview of special items please see the reconciliation tables on pages 15-16 of the .pdf file.
Fresenius Helios
Fresenius Helios is Germany’s largest hospital operator. HELIOS operates 112 hospitals, thereof 88 acute care clinics (including seven maximum care hospitals in Berlin-Buch, Duisburg, Erfurt, Krefeld, Schwerin, Wiesbaden and Wuppertal) and 24 post-acute care clinics. HELIOS treats more than 4.7 million patients per year, thereof approximately 1.3 million inpatients, and operates approximately 35,000 beds.

- 4% organic sales growth in Q3
- 20 bps sequential EBIT margin increase
- 2016 outlook confirmed
Sales increased by 5% to €4,382 million (Q1-3/2015: €4,167 million). Organic sales growth was 4%. Acquisitions increased sales by 1%. In Q3/2016, sales increased by 6% to €1,470 million (Q3/2015: €1,393 million). Organic sales growth was 4%.
EBIT1 grew by 7% to €507 million (Q1-3/2015: €472 million). The EBIT margin1 increased to 11.6% (Q1-3/2015: 11.3%). In Q3/2016, EBIT1 increased by 6% to €175 million (Q3/2015: €165 million). Sequentially, the EBIT margin increased by 20 bps to 11.9%.
Net income2 increased by 14% to €402 million (Q1-3/2015: €352 million). In Q3/2016, net income2 increased by 11% to €140 million (Q3/2015: €126 million).
Operating cash flow increased by 13% to €437 million (Q1-3/2015: €386 million) with a margin of 10.0% (Q1-3/2015: 9.3%). In Q3/2016 operating cash flow increased by 34% to €207 million (Q3/2015: €155 million), mainly driven by decreased working capital. The cash flow margin increased to 14.1% (Q3/2015: 11.1%).
Fresenius Helios confirms its outlook for 2016 and projects organic sales growth of 3% to 5%. EBIT is expected to increase to €670 to €700 million.
Fresenius Helios expects the acquisition of Quirónsalud to close in Q1/2017.
1 2015 before special items2 Net income attributable to shareholders of HELIOS Kliniken GmbH; 2015 before special itemsFor a detailed overview of special items please see the reconciliation tables on pages 15-16 of the .pdf file.
Fresenius Vamed
Fresenius Vamed manages projects and provides services for hospitals and other health care facilities worldwide. The portfolio ranges along the entire value chain: from project development, planning, and turnkey construction, via maintenance and technical management, to total operational management.

- Strong order intake of €209 million in Q3
- 2016 outlook confirmed
Sales increased by 1% (1% in constant currency) to €740 million (Q1-3/2015: €731 million). Organic sales growth was 2%. Sales in the project business decreased by 2% to €325 million (Q1-3/2015: €333 million). Sales in the service business grew by 4% to €415 million (Q1-3/2015: €398 million). In Q3/2016, sales remained unchanged at €268 million (Q3/2015: €268 million). Organic sales growth was 1%.
EBIT increased by 3% to €31 million (Q1-3/2015: €30 million). The EBIT margin increased to 4.2% (Q1-3/2015: 4.1%). In Q3/2016, EBIT increased by 7% to €15 million (Q3/2015: €14 million). The EBIT margin increased to 5.6% (Q3/2015: 5.2%).
Net income1 grew by 5% to €21 million (Q1-3/2015: €20 million). In Q3/2016, net income1 of €10 million was at prior-year level (Q3/2015: €10 million).
Order intake increased by 42% to €674 million (Q1-3/2015: €476 million). In Q3/2016, order intake increased by 9% to €209 million (Q3/2015: €192 million). As of September 30, 2016, order backlog grew to €1,995 million (December 31, 2015: €1,650 million).
Fresenius Vamed confirms its outlook for 2016 and expects organic sales growth in the range of 5% to 10% and EBIT growth of 5% to 10%.
1 Net income attributable to shareholders of VAMED AG
Conference Call
As part of the publication of the results for the first nine months of 2016, a conference call will be held on October 27, 2016 at 2 p.m. CEDT (8 a.m. EDT). All investors are cordially invited to follow the conference call in a live broadcast over the Internet at www.fresenius.com/media. Following the call, a replay will be available on our website.
For additional information on the performance indicators used please refer to pages 25, 40, 56f., 100f. and 194 of the Annual Report 2015 of Fresenius SE & Co. KGaA. Constant currencies for income and expenses are calculated using prior year average rates; constant currencies for assets and liabilities are calculated using the mid-closing rate on the date of the respective statement of financial position (cf. Annual Report 2015, page 111). (www.fresenius.com/financial_reporting/Fresenius_GB_US_GAAP_2015_englisch.pdf).
This release contains forward-looking statements that are subject to various risks and uncertainties. Future results could differ materially from those described in these forward-looking statements due to certain factors, e.g. changes in business, economic and competitive conditions, regulatory reforms, results of clinical trials, foreign exchange rate fluctuations, uncertainties in litigation or investigative proceedings, and the availability of financing. Fresenius does not undertake any responsibility to update the forward-looking statements in this release.
Fresenius increased its 2013 Senior Credit Agreement by €1.2 billion incremental facilities as a further step to fund the acquisition of IDC Salud Holding S.L.U. (Quironsalud) by Fresenius Helios. A bridge facility of €3.75 billion was already signed in September 2016. The incremental facilities consist of an incremental term loan A of €900 million and an incremental revolving facility of €300 million. The transaction was well received by investors and substantially oversubscribed. More than 40 financial institutions participated.
If no timeframe is specified, information refers to H1/2016
Q2/2016:
- Sales: €7.1 billion (+2%, +5% in constant currency)
- EBIT1: €1,051 million (+8%, +11% in constant currency)
- Net income1,2: €393 million (+12%, +15% in constant currency)
H1/2016:
- Sales: €14.0 billion (+4%, +6% in constant currency)
- EBIT1: €2,010 million (+10%, +11% in constant currency)
- Net income1,2: €755 million (+18%, +18% in constant currency)
1 2015 before special items
2 Net income attributable to shareholders of Fresenius SE & Co. KGaA
For a detailed overview of special items please see the reconciliation tables on pages 13-14 of the pdf file.
Stephan Sturm, CEO of Fresenius, said: “Once again, all four business segments contributed to strong organic growth. This confirms Fresenius’ sound strategic position as a healthcare Group. We have continued to grow even in regions where economies have slowed. This confirms the stability of our markets and businesses. Even compared with an excellent prior-year quarter, Fresenius has again achieved double-digit earnings growth. This confirms that we are providing the right products and services to patients worldwide. Fresenius has now delivered the 50th consecutive quarter of earnings growth. We continue to look forward with great confidence, and are raising our 2016 earnings guidance.”
2016 Group earnings guidance raised
Based on the Group’s excellent financial results in the first half of 2016 and strong prospects for the remainder of the year, Fresenius raises its 2016 Group earnings guidance. Net income1,2 is now expected to grow by 11% to 14% in constant currency. Previously, Fresenius expected net income1,2 growth of 8% to 12% in constant currency. The company confirms its Group sales guidance. Sales are expected to increase by 6% to 8% in constant currency.
The net debt/EBITDA3 ratio is expected to be approximately 2.5 at the end of 2016.
1 Net income attributable to shareholders of Fresenius SE & Co. KGaA
2 2015 before special items
3 Calculated at FY average exchange rates for both net debt and EBITDA; excluding potential acquisitions
For a detailed overview of special items please see the reconciliation tables on page 13-14 of the pdf file.
6% sales growth in constant currency
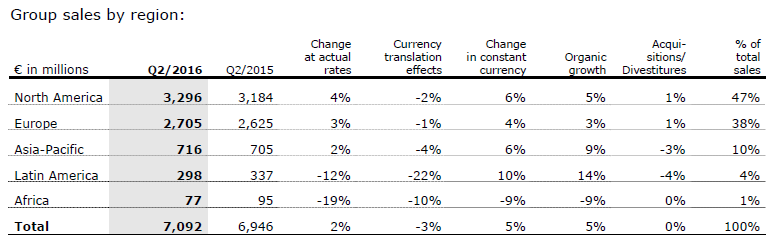
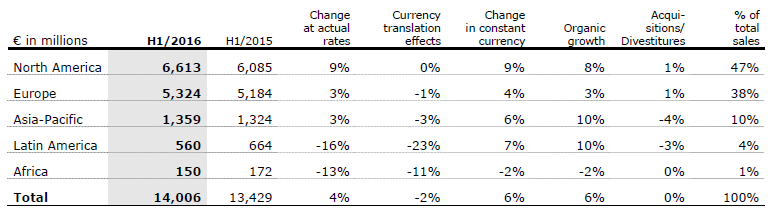
Group sales increased by 4% (6% in constant currency) to €14,006 million (H1/2015: €13,429 million). Organic sales growth was 6%. Acquisitions contributed 1% and divestitures reduced sales by 1%. Negative currency translation effects (-2%) were mainly driven by the devaluation of Latin American currencies against the Euro. In Q2/2016, Group sales increased by 2% (5% in constant currency) to €7,092 million (Q2/2015: €6,946 million). Organic sales growth was 5%. Acquisitions contributed 1%, while divestitures reduced sales by 1%.
Group sales by region:


18% net income1,2 growth in constant currency
Group EBITDA2 increased by 9% (10% in constant currency) to €2,576 million (H1/2015: €2,364 million). Group EBIT2 increased by 10% (11% in constant currency) to €2,010 million (H1/2015: €1,822 million). The EBIT margin2 increased to 14.4% (H1/2015: 13.6%). In Q2/2016, Group EBIT2 increased by 8% (11% in constant currency) to €1,051 million (Q2/2015: €971 million), the EBIT margin was 14.8% (Q2/2015: 14.0%).
Group net interest decreased to -€291 million (H1/2015: -€330 million), mainly due to more favorable financing terms and lower net debt.
With 28.6%, the Group tax rate (before special items) was on Q1/2016 level (28.4%) and hence in line with expectations. In Q2/2016, the Group tax rate was 28.7% (Q2/2015: 29.0%).
Noncontrolling interest increased to €473 million (H1/2015: €409 million), of which 96% was attributable to the noncontrolling interest in Fresenius Medical Care.
Group net income , increased by 18% (18% in constant currency) to €755 million (H1/2015: €642 million). Earnings per share1,2 increased by 17% (18% in constant currency) to €1.38 (H1/2015: €1.18). In Q2/2016, Group net income1,2 increased by 12% (15% in constant currency) to €393 million (Q2/2015: €350 million). Earnings per share1,2 increased by 12% (14% in constant currency) to €0.72 (Q2/2015: €0.64).
Continued investment in growth
Spending on property, plant and equipment was €670 million (H1/2015: €611 million), primarily for the modernization and expansion of dialysis clinics, production facilities and hospitals. Total acquisition spending was €505 million (H1/2015: €194 million).
Cash flow development
Operating cash flow increased by 6% to €1,330 million (H1/2015: €1,251 million) with a margin of 9.5% (H1/2015: 9.3%). Operating cash flow in Q2/2016 increased to €996 million (Q2/2015: €720 million). The cash flow margin increased to 14.0% (Q2/2015: 10.4%). As expected, the operating cashflow of Fresenius Medical Care improved considerably in Q2/2016.
Free cash flow before acquisitions and dividends increased slightly to €650 million (H1/2015: €646 million). Free cash flow after acquisitions and dividends was -€206 million (H1/2015: €107 million).
Solid balance sheet structure
The Group’s total assets increased by 2% (3% in constant currency) to €43,821 million (Dec. 31, 2015: €42,959 million). The increase is mainly driven by business expansion. Current assets grew by 5% (6% in constant currency) to €11,000 million (Dec. 31, 2015: €10,479 million). Non-current assets increased by 1% (2% in constant currency) to €32,821 million (Dec. 31, 2015: € 32,480 million).
Total shareholders’ equity grew by 3% (also 3% in constant currency) to €18,458 million (Dec. 31, 2015: €18,003 million). The equity ratio increased to 42.1% (Dec. 31, 2015: 41.9%).
Group debt increased by 1% (2% in constant currency) to €14,960 million (Dec. 31, 2015: € 14,769 million). As of June 30, 2016, the net debt/EBITDA ratio was 2.62 , (Dec. 31, 2015: 2.681).
12015 before special items; at LTM average exchange rates for both net debt and EBITDA
2Pro forma acquisitions
For a detailed overview of special items please see the reconciliation tables on page 13-14 of the pdf file.
Increased number of employees
As of June 30, 2016, the number of employees increased by 2% to 227,856 (Dec. 31, 2015: 222,305).
Business Segments
Fresenius Medical Care
Fresenius Medical Care is the world's largest provider of products and services for individuals with renal diseases. As of June 30, 2016, Fresenius Medical Care was treating 301,548 patients in 3,504 dialysis clinics. Along with its core business, the company seeks to expand the range of medical services in the field of care coordination.

- 7% sales growth in constant currency in Q2
- 22% net income growth in Q2
- 2016 outlook confirmed
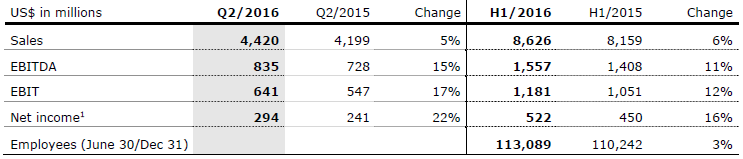
Sales increased by 6% (8% in constant currency) to US$8,626 million (H1/2015: US$8,159 million). Organic sales growth was 7%. Acquisitions contributed 1%. Currency translation effects reduced sales by 2%. In Q2/2016, sales increased by 5% (7% in constant currency) to US$4,420 million (Q2/2015: US$4,199 million). Organic sales growth was 6%.
Health Care services sales (dialysis services and care coordination) increased by 7% (9% in constant currency) to US$6,985 million (H1/2015: US$6,527 million). Dialysis product sales increased by 1% (4% in constant currency) to US$1,640 million (H1/2015: US$1,631 million).
In North America, sales increased by 9% to US$6,212 million (H1/2015: US$5,717 million). Health Care services sales grew by 9% to US$5,770 million (H1/2015: US$5,293 million). Dialysis product sales increased by 4% to US$441 million (H1/2015: US$424 million).
Sales outside North America decreased by 1% (increased by 6% in constant currency) to US$2,406 million (H1/2015: US$2,427 million). Health Care services sales decreased by 2% (increased by 7% in constant currency) to US$1,215 million (H1/2015: US$1,234 million). Dialysis product sales remained nearly unchanged at (increased by 5% in constant currency to) US$1,191 million (H1/2015: US$1,193 million).
1 Net income attributable to shareholders of Fresenius Medical Care AG & Co. KGaA
EBIT increased by 12% (13% in constant currency) to US$1,181 million (H1/2015: US$1,051 million). The EBIT margin was 13.7% (H1/2015: 12.9%). In Q2/2016, EBIT increased by 17% (17% in constant currency) to US$641 million (Q2/2015: US$547 million). The EBIT margin was 14.5% (Q2/2015: 13.0%).
Net income increased by 16% (16% in constant currency) to US$522 million (H1/2015: US$450 million). In Q2/2016, net income grew by 22% (22% in constant currency) to US$294 million (Q2/2015: US$241 million).
Operating cash flow increased by 3% to US$857 million (H1/2015: US$832 million). The cash flow margin was 9.9% (H1/2015: 10.2%). In Q2/2016, operating cash flow increased to US$678 million (Q2/2015: US$385 million) with a cash flow margin of 15.3% (Q2/2015: 9.2%). The sequential improvement is mainly driven by the anticipated catch-up effect after the adjustment in invoicing in Q1/2016.
Fresenius Medical Care confirms its outlook for 2016. The company expects sales to grow by 7% to 10% in constant currency and net income1 is expected to increase by 15% to 20% in 2016.
1 Net income attributable to shareholders of Fresenius Medical Care AG & Co. KGaA
2 2015 before GranuFlo®/NaturaLyte® settlement costs (-US$37 million after tax) and before acquisitions (US$9 million after tax); hence the basis for expected net income growth is US$1,057 million.
For further information, please see Fresenius Medical Care’s Press Release at www.freseniusmedicalcare.com.
Fresenius Kabi
Fresenius Kabi offers intravenously administered generic drugs, clinical nutrition and infusion therapies for seriously and chronically ill patients in the hospital and outpatient environments. The company is also a leading supplier of medical devices and transfusion technology products.


- 3% organic sales growth in Q2
- 1% constant currency EBIT1 growth in Q2
- 2016 outlook raised: both, organic sales growth and EBIT1 growth in constant currency of 3% to 5% expected
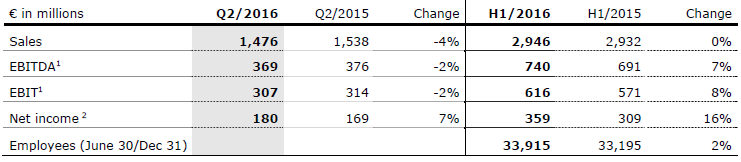
Sales increased slightly (by 4% in constant currency) to €2,946 million (H1/2015: €2,932 million). Organic sales growth was 6%. Divestitures reduced sales by 2%. In Q2/2016, sales decreased by 4% (increased by 1% in constant currency) to €1,476 million (Q2/2015: €1,538 million). Negative currency translation effects (-5%) were mainly driven by the devaluation of the Chinese yuan, the U.S. dollar and the Argentine peso against the Euro. Organic sales growth was 3%.
Sales in Europe remained nearly unchanged at €1,048 million (H1/2015: €1,052 million). Organic sales growth was 2%. Divestitures reduced sales by 1%. Also in Q2/2016, sales were almost unchanged at €536 million (Q2/2015: €534 million). Organic sales growth was 2%.
Sales in North America increased by 6% (organic growth: 6%) to €1,086 million (H1/2015: €1,026 million), driven by persisting drug shortages as well as new product launches in Q1/2016. In Q2/2016, sales decreased by 8% (organic: 6%) to €510 million (Q2/2015: €553 million), mainly due to the high prior-year basis driven by significant new product launches.
1 2015 before special items
2 Net income attributable to shareholders of Fresenius Kabi AG; 2015 before special items
For a detailed overview of special items please see the reconciliation tables on page 13-14.
Sales in Asia-Pacific decreased by 6% (organic growth: 7%) to €531 million (H1/2015: €564 million). Adverse currency translation effects reduced sales by 5%, divestitures by another 8%. In Q2/2016, sales decreased by 6% (organic growth: 8%) to €277 million (Q2/2015: €296 million).
Given adverse currency translation effects, sales in Latin America/Africa decreased by 3% (organic growth: 21%, in particular due to inflation driven price increases) to €281 million (H1/2015: €290 million). In Q2/2016, sales decreased by 1% (organic growth 22%) to €153 million (Q2/2015: €155 million).
EBIT2 increased by 8% (10% in constant currency) to €616 million (H1/2015: €571 million). The EBIT margin2 improved to 20.9% (H1/2015: 19.5%). In Q2/2016, EBIT2 decreased by 2% (increased by 1% in constant currency) to €307 million (Q2/2015: €314 million). The EBIT margin2 increased to 20.8% (Q2/2015: 20.4%).
Net income1 increased by 16% (37% in constant currency) to €359 million (H1/2015: €309 million). In Q2/2016, net income1 increased by 7% (30% in constant currency) to €180 million (Q2/2015: €169 million).
Given adverse currency translation effects, operating cash flow decreased by 5% to €335 million (H1/2015: €354 million) with a margin of 11.4% (H1/2015: 12.1%). While operating cash flow reached a very strong €211 million in Q2/2016, it could not match the exceptional prior-year quarter (Q2/2015: €271 million). The same applies to the margin of 14.3% (Q2/2015: 17.6%).
Fresenius Kabi raises its outlook for 2016 and now expects organic sales growth of 3% to 5% and EBIT2 growth in constant currency of 3% to 5%. Previously, Fresenius Kabi projected low single-digit organic sales growth and EBIT2 in constant currency to be roughly flat compared with 2015.
1 Net income attributable to shareholders of Fresenius Kabi AG; 2015 before special items
2 2015 before special items
For a detailed overview of special items please see the reconciliation tables on page 13-14 of the pdf file.
Fresenius Helios
Fresenius Helios is Germany’s largest hospital operator. HELIOS operates 112 hospitals, thereof 88 acute care clinics (including seven maximum care hospitals in Berlin-Buch, Duisburg, Erfurt, Krefeld, Schwerin, Wiesbaden and Wuppertal) and 24 post-acute care clinics. HELIOS treats more than 4.7 million patients per year, thereof approximately 1.3 million inpatients, and operates more than 34,000 beds.

- 6% organic sales growth in Q2
- 60 bps sequential EBIT margin increase
- 2016 outlook confirmed
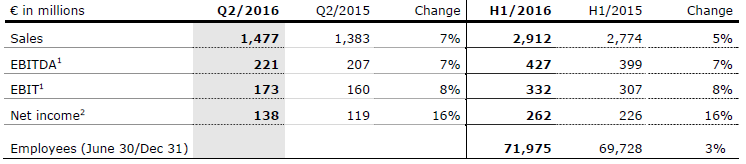
Sales increased by 5% to €2,912 million (H1/2015: €2,774 million). Organic sales growth was 4% (H1/2015: 3%). Acquisitions and divestitures had no material effect. In Q2/2016, sales increased by 7% to €1,477 million (Q2/2015: €1,383 million). Organic sales growth was 6% (Q2/2015: 2%).
EBIT1 grew by 8% to €332 million (H1/2015: €307 million). The EBIT margin1 increased to 11.4% (H1/2015: 11.1%). In Q2/2016, EBIT1 increased by 8% to €173 million (Q2/2015: €160 million). Sequentially, the EBIT margin increased by 60 bps to 11.7%.
Net income2 increased by 16% to €262 million (H1/2015: €226 million). In Q2/2016, net income2 increased by 16% to €138 million (Q2/2015: €119 million).
Fresenius Helios confirms its outlook for 2016 and projects organic sales growth of 3% to 5%. EBIT is expected to increase to €670 to €700 million.
1 2015 before special items
2 Net income attributable to shareholders of HELIOS Kliniken GmbH; 2015 before special items
For a detailed overview of special items please see the reconciliation tables on page 13-14 of the pdf file.
Fresenius Vamed
Fresenius Vamed manages projects and provides services for hospitals and other health care facilities worldwide. The portfolio ranges along the entire value chain: from project development, planning, and turnkey construction, via maintenance and technical management, to total operational management.

- Sales development reflects typical quarterly fluctuations in the project business
- Strong order intake of €228 million in Q2
- 2016 outlook confirmed
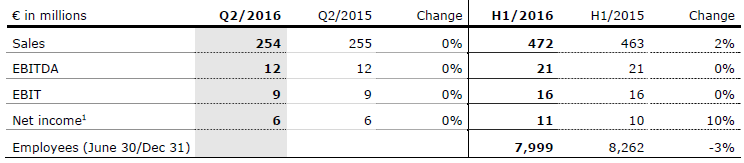
Sales increased by 2% (2% in constant currency) to €472 million (H1/2015: €463 million). Organic sales growth was 3%. Sales in the project business decreased by 3% to €195 million (H1/2015: €202 million). Sales in the service business grew by 6% to €277 million (H1/2015: €261 million). In Q2/2016, sales remained nearly unchanged at €254 million (Q2/2015: €255 million). Organic sales growth was 1%.
EBIT remained unchanged at €16 million (H1/2015: €16 million). The EBIT margin was 3.4% (H1/2015: 3.5%). In Q2/2016, EBIT remained unchanged at €9 million (Q2/2015: €9 million). The EBIT margin of 3.5% was at prior-year level.
Net income1 grew by 10% to €11 million (H1/2015: €10 million). In Q2/2016, net income1 of €6 million was at prior-year level.
Order intake increased by 64% to €465 million (H1/2015: €284 million). As of June 30, 2016, order backlog grew to €1,917 million (December 31, 2015: €1,650 million).
Fresenius Vamed confirms its outlook for 2016 and expects organic sales growth in the range of 5% to 10% and EBIT growth of 5% to 10%.
1 Net income attributable to shareholders of VAMED AG
Conference Call
As part of the publication of the results for the first half of 2016, a conference call for analysts and investors will be held on August 2, 2016 at 2 p.m. CEDT (8 a.m. EDT). You are cordially invited to follow the conference call in a live broadcast over the Internet at www.fresenius.com/media. Following the call, a replay will be available on our website.
This release contains forward-looking statements that are subject to various risks and uncertainties. Future results could differ materially from those described in these forward-looking statements due to certain factors, e.g. changes in business, economic and competitive conditions, regulatory reforms, results of clinical trials, foreign exchange rate fluctuations, uncertainties in litigation or investigative proceedings, and the availability of financing. Fresenius does not undertake any responsibility to update the forward-looking statements in this release.
If no timeframe is specified, information refers to H1/2016
Q2/2016:
- Sales: €7.1 billion (+2%, +5% in constant currency)
- EBIT1: €1,051 million (+8%, +11% in constant currency)
- Net income1,2: €393 million (+12%, +15% in constant currency)
H1/2016:
- Sales: €14.0 billion (+4%, +6% in constant currency)
- EBIT1: €2,010 million (+10%, +11% in constant currency)
- Net income1,2: €755 million (+18%, +18% in constant currency)
12015 before special items2Net income attributable to shareholders of Fresenius SE & Co. KGaA
For a detailed overview of special items please see the reconciliation tables on pages 13-14 of the pdf file.
Stephan Sturm, CEO of Fresenius, said: “Once again, all four business segments contributed to strong organic growth. This confirms Fresenius’ sound strategic position as a healthcare Group. We have continued to grow even in regions where economies have slowed. This confirms the stability of our markets and businesses. Even compared with an excellent prior-year quarter, Fresenius has again achieved double-digit earnings growth. This confirms that we are providing the right products and services to patients worldwide. Fresenius has now delivered the 50th consecutive quarter of earnings growth. We continue to look forward with great confidence, and are raising our 2016 earnings guidance.”
2016 Group earnings guidance raised
Based on the Group’s excellent financial results in the first half of 2016 and strong prospects for the remainder of the year, Fresenius raises its 2016 Group earnings guidance. Net income1,2 is now expected to grow by 11% to 14% in constant currency. Previously, Fresenius expected net income1,2 growth of 8% to 12% in constant currency. The company confirms its Group sales guidance. Sales are expected to increase by 6% to 8% in constant currency.
The net debt/EBITDA3 ratio is expected to be approximately 2.5 at the end of 2016.
1Net income attributable to shareholders of Fresenius SE & Co. KGaA22015 before special items3Calculated at FY average exchange rates for both net debt and EBITDA; excluding potential acquisitions
For a detailed overview of special items please see the reconciliation tables on page 13-14 of the pdf file.
6% sales growth in constant currency
Group sales increased by 4% (6% in constant currency) to €14,006 million (H1/2015: €13,429 million). Organic sales growth was 6%. Acquisitions contributed 1% and divestitures reduced sales by 1%. Negative currency translation effects (-2%) were mainly driven by the devaluation of Latin American currencies against the Euro. In Q2/2016, Group sales increased by 2% (5% in constant currency) to €7,092 million (Q2/2015: €6,946 million). Organic sales growth was 5%. Acquisitions contributed 1%, while divestitures reduced sales by 1%.


18% net income1,2 growth in constant currency
Group EBITDA2 increased by 9% (10% in constant currency) to €2,576 million (H1/2015: €2,364 million). Group EBIT2 increased by 10% (11% in constant currency) to €2,010 million (H1/2015: €1,822 million). The EBIT margin2 increased to 14.4% (H1/2015: 13.6%). In Q2/2016, Group EBIT2 increased by 8% (11% in constant currency) to €1,051 million (Q2/2015: €971 million), the EBIT margin was 14.8% (Q2/2015: 14.0%).
Group net interest decreased to -€291 million (H1/2015: -€330 million), mainly due to more favorable financing terms and lower net debt.
With 28.6%, the Group tax rate (before special items) was on Q1/2016 level (28.4%) and hence in line with expectations. In Q2/2016, the Group tax rate was 28.7% (Q2/2015: 29.0%).
Noncontrolling interest increased to €473 million (H1/2015: €409 million), of which 96% was attributable to the noncontrolling interest in Fresenius Medical Care.
Group net income , increased by 18% (18% in constant currency) to €755 million (H1/2015: €642 million). Earnings per share1,2 increased by 17% (18% in constant currency) to €1.38 (H1/2015: €1.18). In Q2/2016, Group net income1,2 increased by 12% (15% in constant currency) to €393 million (Q2/2015: €350 million). Earnings per share1,2 increased by 12% (14% in constant currency) to €0.72 (Q2/2015: €0.64).
Continued investment in growth
Spending on property, plant and equipment was €670 million (H1/2015: €611 million), primarily for the modernization and expansion of dialysis clinics, production facilities and hospitals. Total acquisition spending was €505 million (H1/2015: €194 million).
Cash flow development
Operating cash flow increased by 6% to €1,330 million (H1/2015: €1,251 million) with a margin of 9.5% (H1/2015: 9.3%). Operating cash flow in Q2/2016 increased to €996 million (Q2/2015: €720 million). The cash flow margin increased to 14.0% (Q2/2015: 10.4%). As expected, the operating cashflow of Fresenius Medical Care improved considerably in Q2/2016.
Free cash flow before acquisitions and dividends increased slightly to €650 million (H1/2015: €646 million). Free cash flow after acquisitions and dividends was -€206 million (H1/2015: €107 million).
Solid balance sheet structure
The Group’s total assets increased by 2% (3% in constant currency) to €43,821 million (Dec. 31, 2015: €42,959 million). The increase is mainly driven by business expansion. Current assets grew by 5% (6% in constant currency) to €11,000 million (Dec. 31, 2015: €10,479 million). Non-current assets increased by 1% (2% in constant currency) to €32,821 million (Dec. 31, 2015: € 32,480 million).
Total shareholders’ equity grew by 3% (also 3% in constant currency) to €18,458 million (Dec. 31, 2015: €18,003 million). The equity ratio increased to 42.1% (Dec. 31, 2015: 41.9%).
Group debt increased by 1% (2% in constant currency) to €14,960 million (Dec. 31, 2015: € 14,769 million). As of June 30, 2016, the net debt/EBITDA ratio was 2.62 , (Dec. 31, 2015: 2.681).
12015 before special items; at LTM average exchange rates for both net debt and EBITDA2Pro forma acquisitionsFor a detailed overview of special items please see the reconciliation tables on page 13-14 of the pdf file.
Business Segments
Fresenius Medical Care
Fresenius Medical Care is the world's largest provider of products and services for individuals with renal diseases. As of June 30, 2016, Fresenius Medical Care was treating 301,548 patients in 3,504 dialysis clinics. Along with its core business, the company seeks to expand the range of medical services in the field of care coordination.


- 7% sales growth in constant currency in Q2
- 22% net income growth in Q2
- 2016 outlook confirmed
Sales increased by 6% (8% in constant currency) to US$8,626 million (H1/2015: US$8,159 million). Organic sales growth was 7%. Acquisitions contributed 1%. Currency translation effects reduced sales by 2%. In Q2/2016, sales increased by 5% (7% in constant currency) to US$4,420 million (Q2/2015: US$4,199 million). Organic sales growth was 6%.
Health Care services sales (dialysis services and care coordination) increased by 7% (9% in constant currency) to US$6,985 million (H1/2015: US$6,527 million). Dialysis product sales increased by 1% (4% in constant currency) to US$1,640 million (H1/2015: US$1,631 million).
In North America, sales increased by 9% to US$6,212 million (H1/2015: US$5,717 million). Health Care services sales grew by 9% to US$5,770 million (H1/2015: US$5,293 million). Dialysis product sales increased by 4% to US$441 million (H1/2015: US$424 million).
Sales outside North America decreased by 1% (increased by 6% in constant currency) to US$2,406 million (H1/2015: US$2,427 million). Health Care services sales decreased by 2% (increased by 7% in constant currency) to US$1,215 million (H1/2015: US$1,234 million). Dialysis product sales remained nearly unchanged at (increased by 5% in constant currency to) US$1,191 million (H1/2015: US$1,193 million).
1Net income attributable to shareholders of Fresenius Medical Care AG & Co. KGaA
EBIT increased by 12% (13% in constant currency) to US$1,181 million (H1/2015: US$1,051 million). The EBIT margin was 13.7% (H1/2015: 12.9%). In Q2/2016, EBIT increased by 17% (17% in constant currency) to US$641 million (Q2/2015: US$547 million). The EBIT margin was 14.5% (Q2/2015: 13.0%).
Net income increased by 16% (16% in constant currency) to US$522 million (H1/2015: US$450 million). In Q2/2016, net income grew by 22% (22% in constant currency) to US$294 million (Q2/2015: US$241 million).
Operating cash flow increased by 3% to US$857 million (H1/2015: US$832 million). The cash flow margin was 9.9% (H1/2015: 10.2%). In Q2/2016, operating cash flow increased to US$678 million (Q2/2015: US$385 million) with a cash flow margin of 15.3% (Q2/2015: 9.2%). The sequential improvement is mainly driven by the anticipated catch-up effect after the adjustment in invoicing in Q1/2016.
Fresenius Medical Care confirms its outlook for 2016. The company expects sales to grow by 7% to 10% in constant currency and net income1 is expected to increase by 15% to 20% in 2016.
1Net income attributable to shareholders of Fresenius Medical Care AG & Co. KGaA
22015 before GranuFlo®/NaturaLyte® settlement costs (-US$37 million after tax) and before acquisitions (US$9 million after tax); hence the basis for expected net income growth is US$1,057 million.
For further information, please see Fresenius Medical Care’s Press Release at www.freseniusmedicalcare.com.
Fresenius Kabi
Fresenius Kabi offers intravenously administered generic drugs, clinical nutrition and infusion therapies for seriously and chronically ill patients in the hospital and outpatient environments. The company is also a leading supplier of medical devices and transfusion technology products.

- 3% organic sales growth in Q2
- 1% constant currency EBIT1 growth in Q2
- 2016 outlook raised: both, organic sales growth and EBIT1 growth in constant currency of 3% to 5% expected
Sales increased slightly (by 4% in constant currency) to €2,946 million (H1/2015: €2,932 million). Organic sales growth was 6%. Divestitures reduced sales by 2%. In Q2/2016, sales decreased by 4% (increased by 1% in constant currency) to €1,476 million (Q2/2015: €1,538 million). Negative currency translation effects (-5%) were mainly driven by the devaluation of the Chinese yuan, the U.S. dollar and the Argentine peso against the Euro. Organic sales growth was 3%.
Sales in Europe remained nearly unchanged at €1,048 million (H1/2015: €1,052 million). Organic sales growth was 2%. Divestitures reduced sales by 1%. Also in Q2/2016, sales were almost unchanged at €536 million (Q2/2015: €534 million). Organic sales growth was 2%.
Sales in North America increased by 6% (organic growth: 6%) to €1,086 million (H1/2015: €1,026 million), driven by persisting drug shortages as well as new product launches in Q1/2016. In Q2/2016, sales decreased by 8% (organic: 6%) to €510 million (Q2/2015: €553 million), mainly due to the high prior-year basis driven by significant new product launches.
12015 before special items2Net income attributable to shareholders of Fresenius Kabi AG; 2015 before special items
For a detailed overview of special items please see the reconciliation tables on page 13-14.
Sales in Asia-Pacific decreased by 6% (organic growth: 7%) to €531 million (H1/2015: €564 million). Adverse currency translation effects reduced sales by 5%, divestitures by another 8%. In Q2/2016, sales decreased by 6% (organic growth: 8%) to €277 million (Q2/2015: €296 million).
Given adverse currency translation effects, sales in Latin America/Africa decreased by 3% (organic growth: 21%, in particular due to inflation driven price increases) to €281 million (H1/2015: €290 million). In Q2/2016, sales decreased by 1% (organic growth 22%) to €153 million (Q2/2015: €155 million).
EBIT2 increased by 8% (10% in constant currency) to €616 million (H1/2015: €571 million). The EBIT margin2 improved to 20.9% (H1/2015: 19.5%). In Q2/2016, EBIT2 decreased by 2% (increased by 1% in constant currency) to €307 million (Q2/2015: €314 million). The EBIT margin2 increased to 20.8% (Q2/2015: 20.4%).
Net income1 increased by 16% (37% in constant currency) to €359 million (H1/2015: €309 million). In Q2/2016, net income1 increased by 7% (30% in constant currency) to €180 million (Q2/2015: €169 million).
Given adverse currency translation effects, operating cash flow decreased by 5% to €335 million (H1/2015: €354 million) with a margin of 11.4% (H1/2015: 12.1%). While operating cash flow reached a very strong €211 million in Q2/2016, it could not match the exceptional prior-year quarter (Q2/2015: €271 million). The same applies to the margin of 14.3% (Q2/2015: 17.6%).
Fresenius Kabi raises its outlook for 2016 and now expects organic sales growth of 3% to 5% and EBIT2 growth in constant currency of 3% to 5%. Previously, Fresenius Kabi projected low single-digit organic sales growth and EBIT2 in constant currency to be roughly flat compared with 2015.
1Net income attributable to shareholders of Fresenius Kabi AG; 2015 before special items22015 before special items
For a detailed overview of special items please see the reconciliation tables on page 13-14 of the pdf file.
Fresenius Helios
Fresenius Helios is Germany’s largest hospital operator. HELIOS operates 112 hospitals, thereof 88 acute care clinics (including seven maximum care hospitals in Berlin-Buch, Duisburg, Erfurt, Krefeld, Schwerin, Wiesbaden and Wuppertal) and 24 post-acute care clinics. HELIOS treats more than 4.7 million patients per year, thereof approximately 1.3 million inpatients, and operates more than 34,000 beds.


- 6% organic sales growth in Q2
- 60 bps sequential EBIT margin increase
- 2016 outlook confirmed
Sales increased by 5% to €2,912 million (H1/2015: €2,774 million). Organic sales growth was 4% (H1/2015: 3%). Acquisitions and divestitures had no material effect. In Q2/2016, sales increased by 7% to €1,477 million (Q2/2015: €1,383 million). Organic sales growth was 6% (Q2/2015: 2%).
EBIT1 grew by 8% to €332 million (H1/2015: €307 million). The EBIT margin1 increased to 11.4% (H1/2015: 11.1%). In Q2/2016, EBIT1 increased by 8% to €173 million (Q2/2015: €160 million). Sequentially, the EBIT margin increased by 60 bps to 11.7%.
Net income2 increased by 16% to €262 million (H1/2015: €226 million). In Q2/2016, net income2 increased by 16% to €138 million (Q2/2015: €119 million).
Fresenius Helios confirms its outlook for 2016 and projects organic sales growth of 3% to 5%. EBIT is expected to increase to €670 to €700 million.
12015 before special items2Net income attributable to shareholders of HELIOS Kliniken GmbH; 2015 before special items
For a detailed overview of special items please see the reconciliation tables on page 13-14 of the pdf file.
Fresenius Vamed
Fresenius Vamed manages projects and provides services for hospitals and other health care facilities worldwide. The portfolio ranges along the entire value chain: from project development, planning, and turnkey construction, via maintenance and technical management, to total operational management.


- Sales development reflects typical quarterly fluctuations in the project business
- Strong order intake of €228 million in Q2
- 2016 outlook confirmed
Sales increased by 2% (2% in constant currency) to €472 million (H1/2015: €463 million). Organic sales growth was 3%. Sales in the project business decreased by 3% to €195 million (H1/2015: €202 million). Sales in the service business grew by 6% to €277 million (H1/2015: €261 million). In Q2/2016, sales remained nearly unchanged at €254 million (Q2/2015: €255 million). Organic sales growth was 1%.
EBIT remained unchanged at €16 million (H1/2015: €16 million). The EBIT margin was 3.4% (H1/2015: 3.5%). In Q2/2016, EBIT remained unchanged at €9 million (Q2/2015: €9 million). The EBIT margin of 3.5% was at prior-year level.
Net income1 grew by 10% to €11 million (H1/2015: €10 million). In Q2/2016, net income1 of €6 million was at prior-year level.
Order intake increased by 64% to €465 million (H1/2015: €284 million). As of June 30, 2016, order backlog grew to €1,917 million (December 31, 2015: €1,650 million).
Fresenius Vamed confirms its outlook for 2016 and expects organic sales growth in the range of 5% to 10% and EBIT growth of 5% to 10%.
1Net income attributable to shareholders of VAMED AG
Conference Call
As part of the publication of the results for the first half of 2016, a conference call will be held on August 2, 2016 at 2 p.m. CEDT (8 a.m. EDT). All investors are cordially invited to follow the conference call in a live broadcast over the Internet at www.fresenius.com/investors. Following the call, a replay will be available on our website.
For additional information on the performance indicators used please refer to pages 25, 40, 56f., 100f. and 194 of the Annual Report 2015 of Fresenius SE & Co. KGaA. Constant currencies for income and expenses are calculated using prior year average rates; constant currencies for assets and liabilities are calculated using the mid-closing rate on the date of the respective statement of financial position (cf. Annual Report 2015, page 111). (https://www.fresenius.com/financial_reporting/Fresenius_GB_US_GAAP_2015_englisch.pdf).
This release contains forward-looking statements that are subject to various risks and uncertainties. Future results could differ materially from those described in these forward-looking statements due to certain factors, e.g. changes in business, economic and competitive conditions, regulatory reforms, results of clinical trials, foreign exchange rate fluctuations, uncertainties in litigation or investigative proceedings, and the availability of financing. Fresenius does not undertake any responsibility to update the forward-looking statements in this release.
Fitch has upgraded the corporate credit rating of Fresenius from BB+ to BBB- with a stable outlook. The upgrade reflects Fitch's view that Fresenius' business profile has improved over the last years driven by increasing scale and diversification as well as strong profitability and cash generation. In addition, Fitch considers the underlying operations to be mature and defensive with low cyclicality and low volatility of earnings. Standard & Poor’s and Moody’s have upgraded the corporate credit rating of Fresenius to investment grade in 2015.