
February 22, 2017
Fresenius reports 13th consecutive record year and targets continued strong growth
-
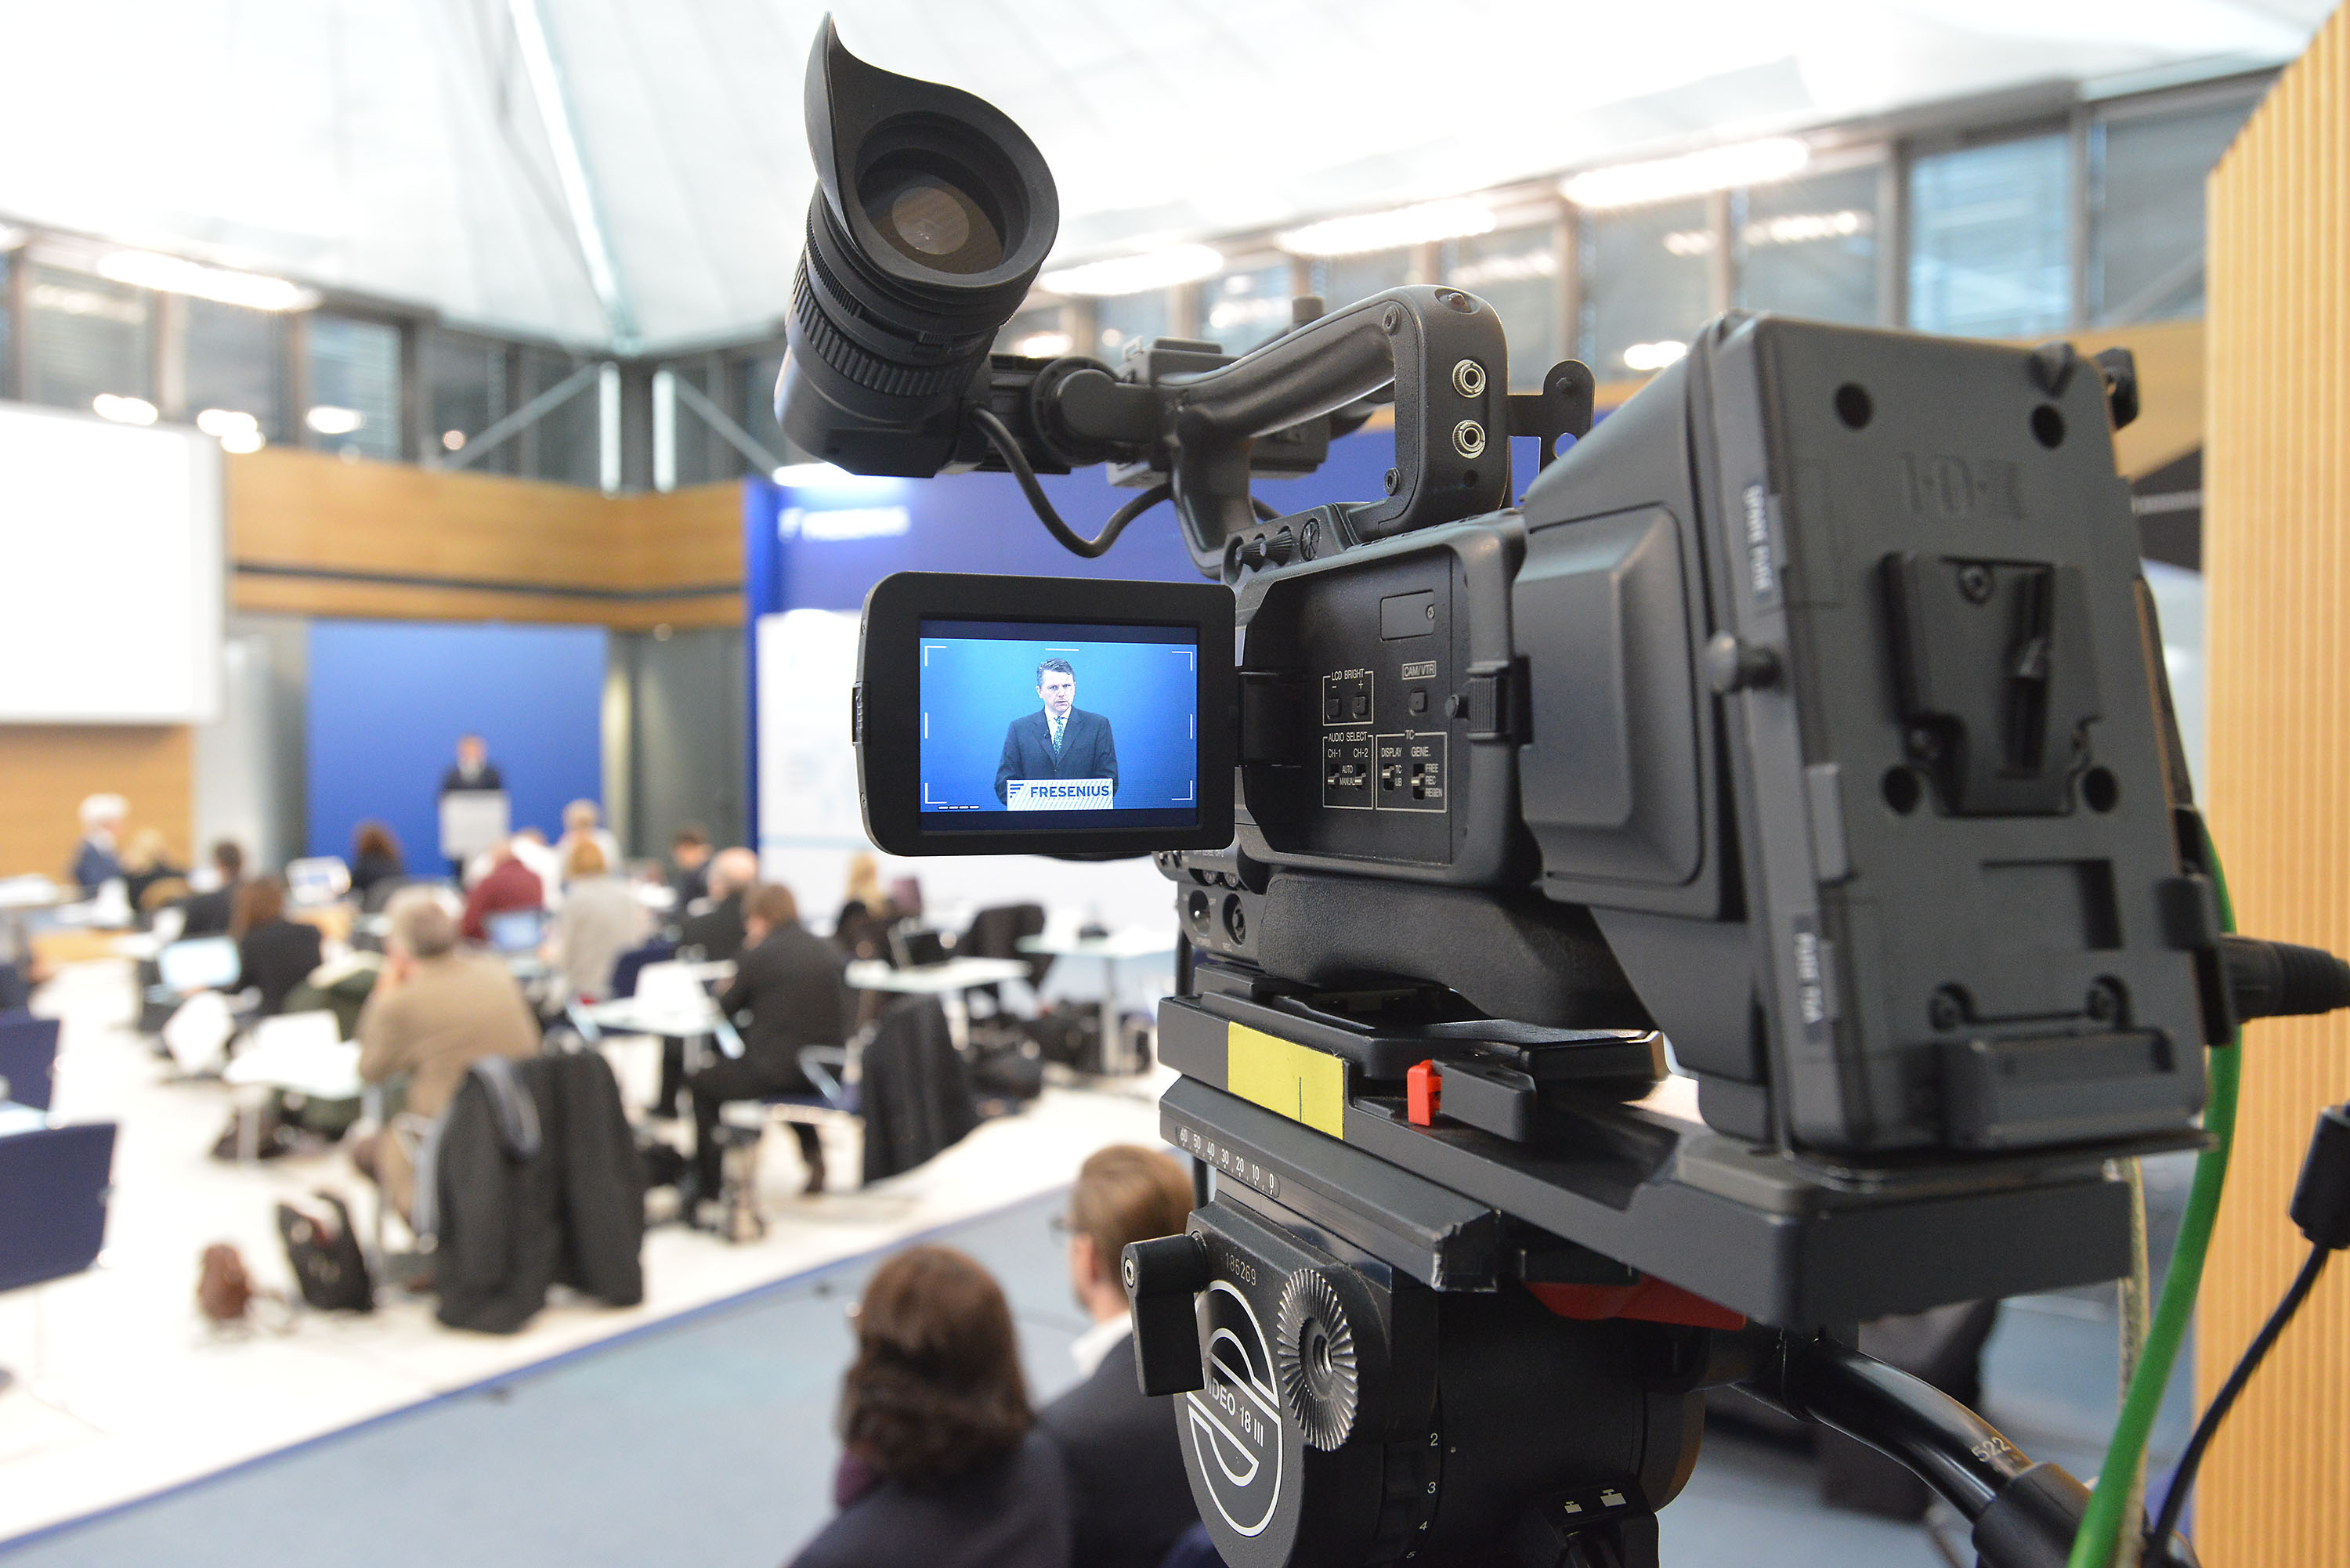
Press conference on the Full Year 2016 results on February 22, 2017 at Fresenius headquarters in Bad Homburg, Germany. Download Image (JPG 645 KB) -
![]()
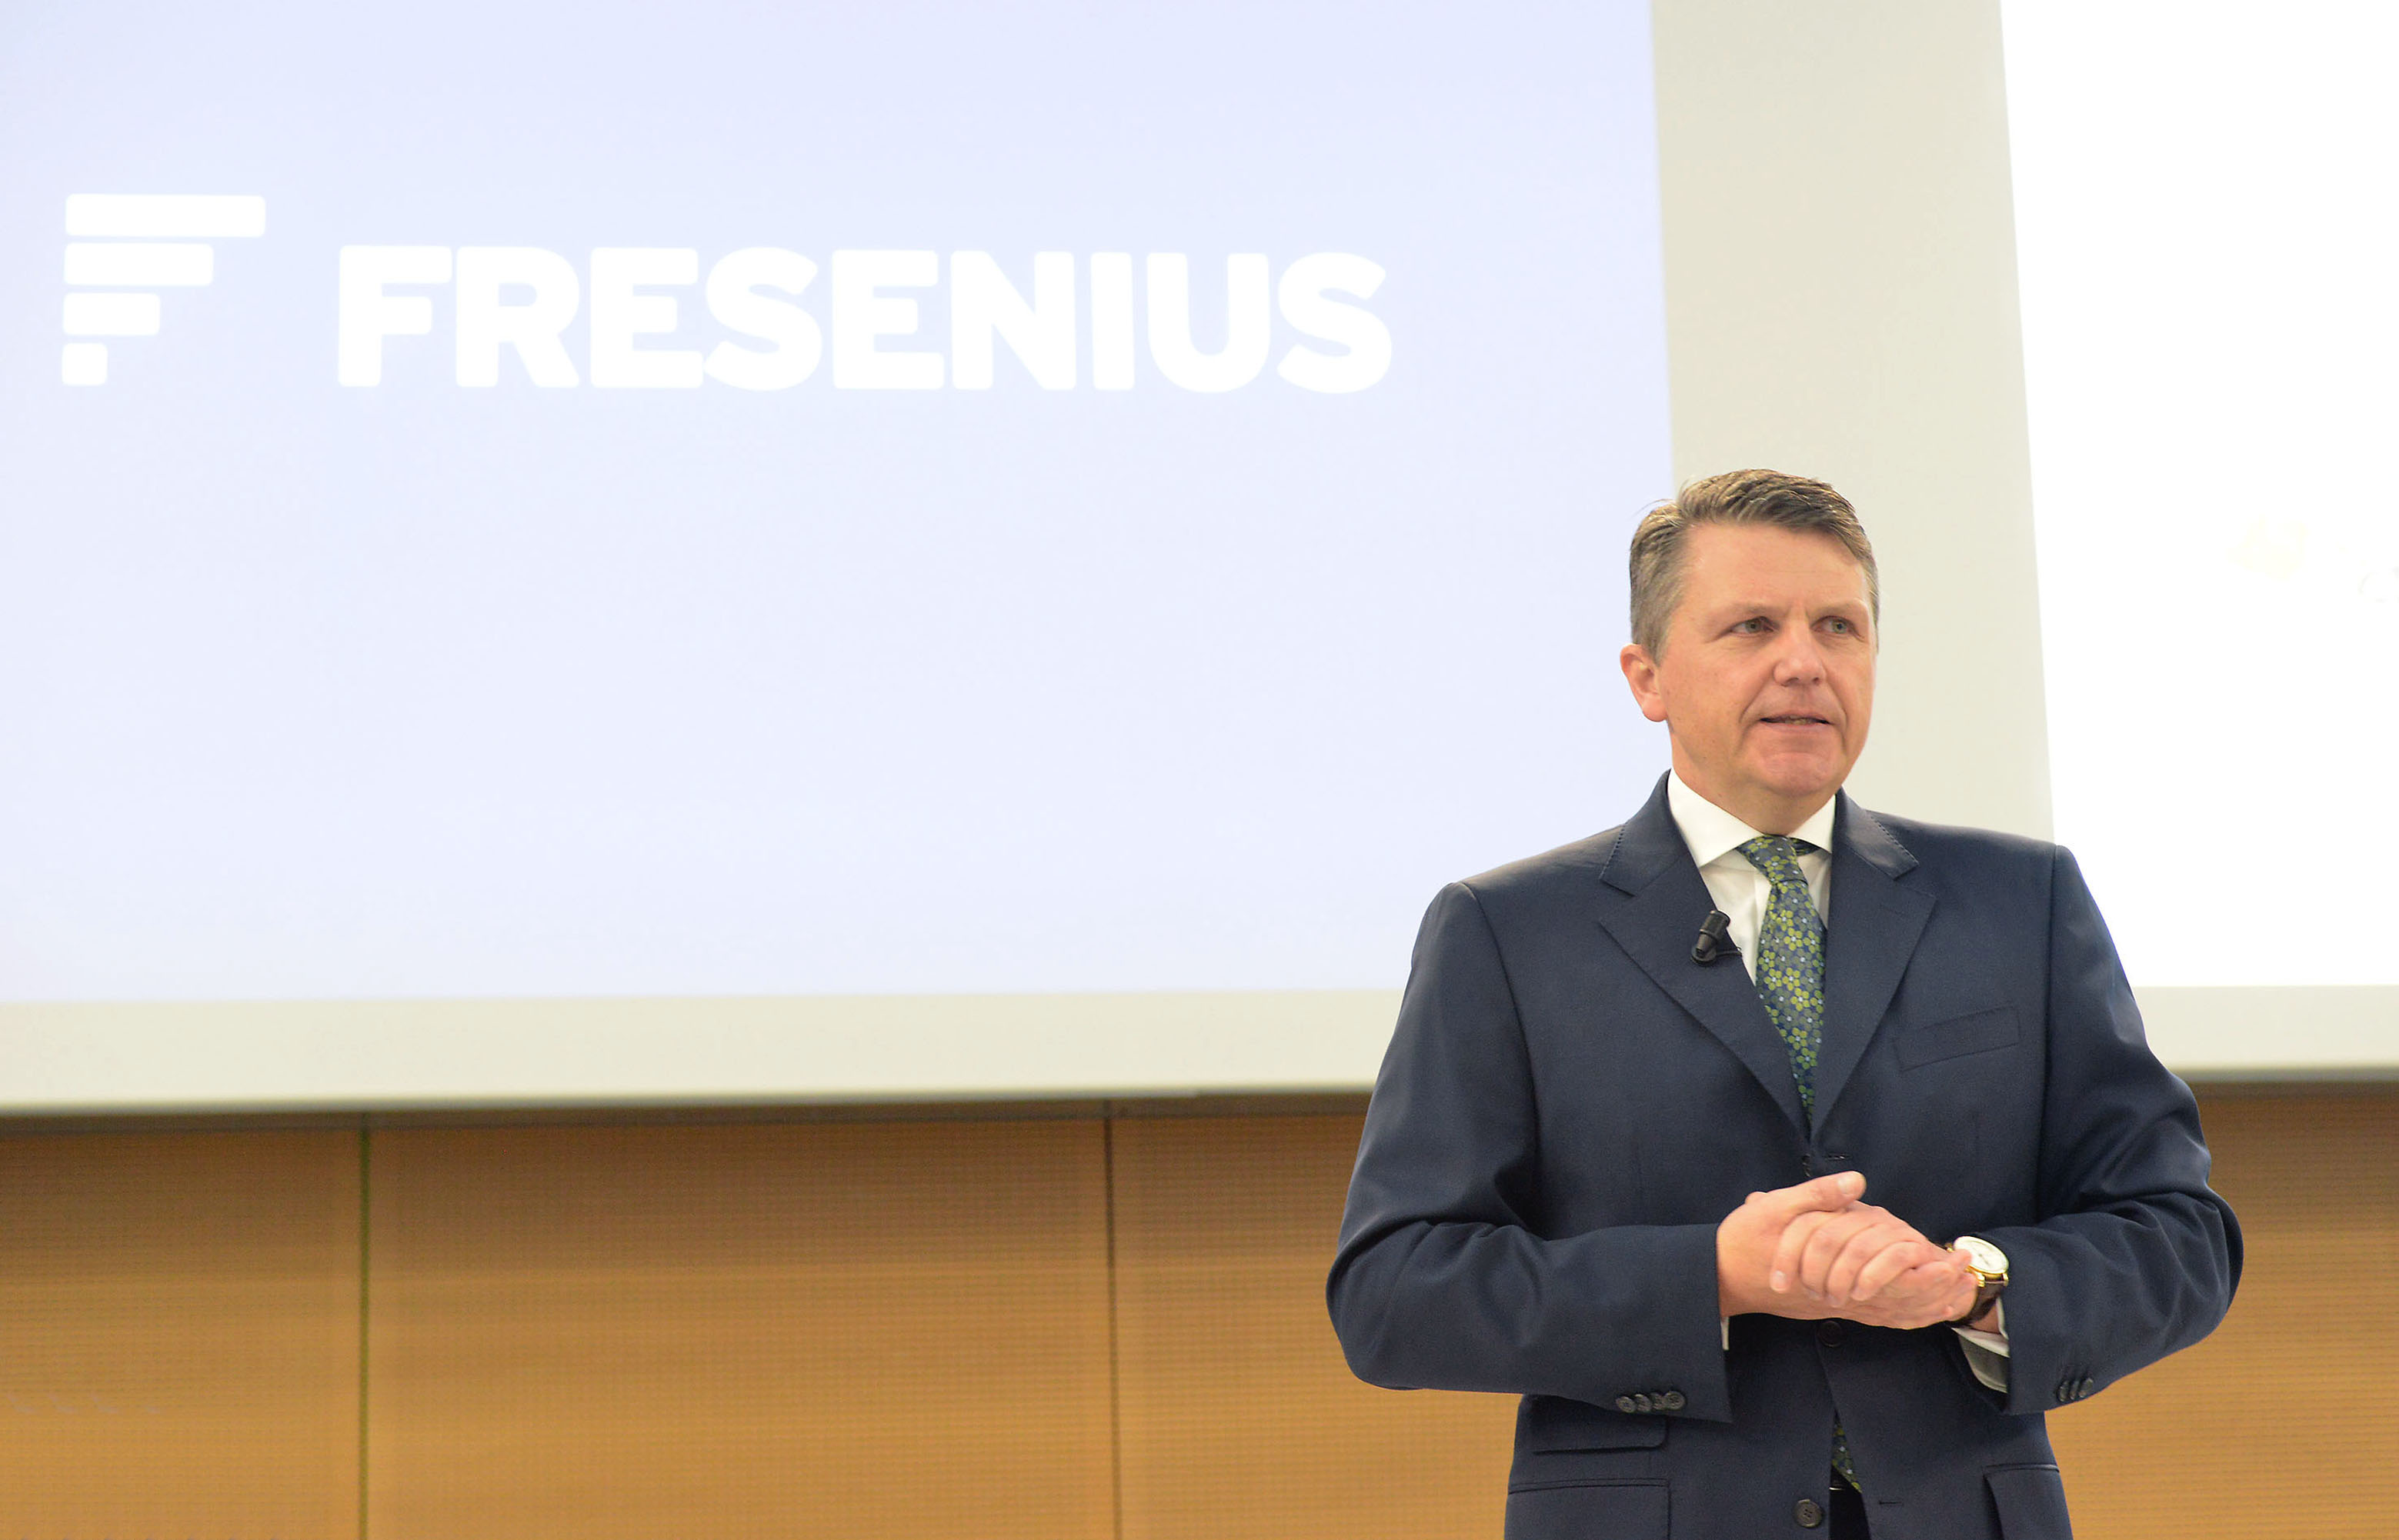
Stephan Sturm, CEO of Fresenius presenting the Full Year 2016 results at the press conference held at Fresenius headquarters in Bad Homburg, Germany. Download Image (JPG 402 KB) -
![]()
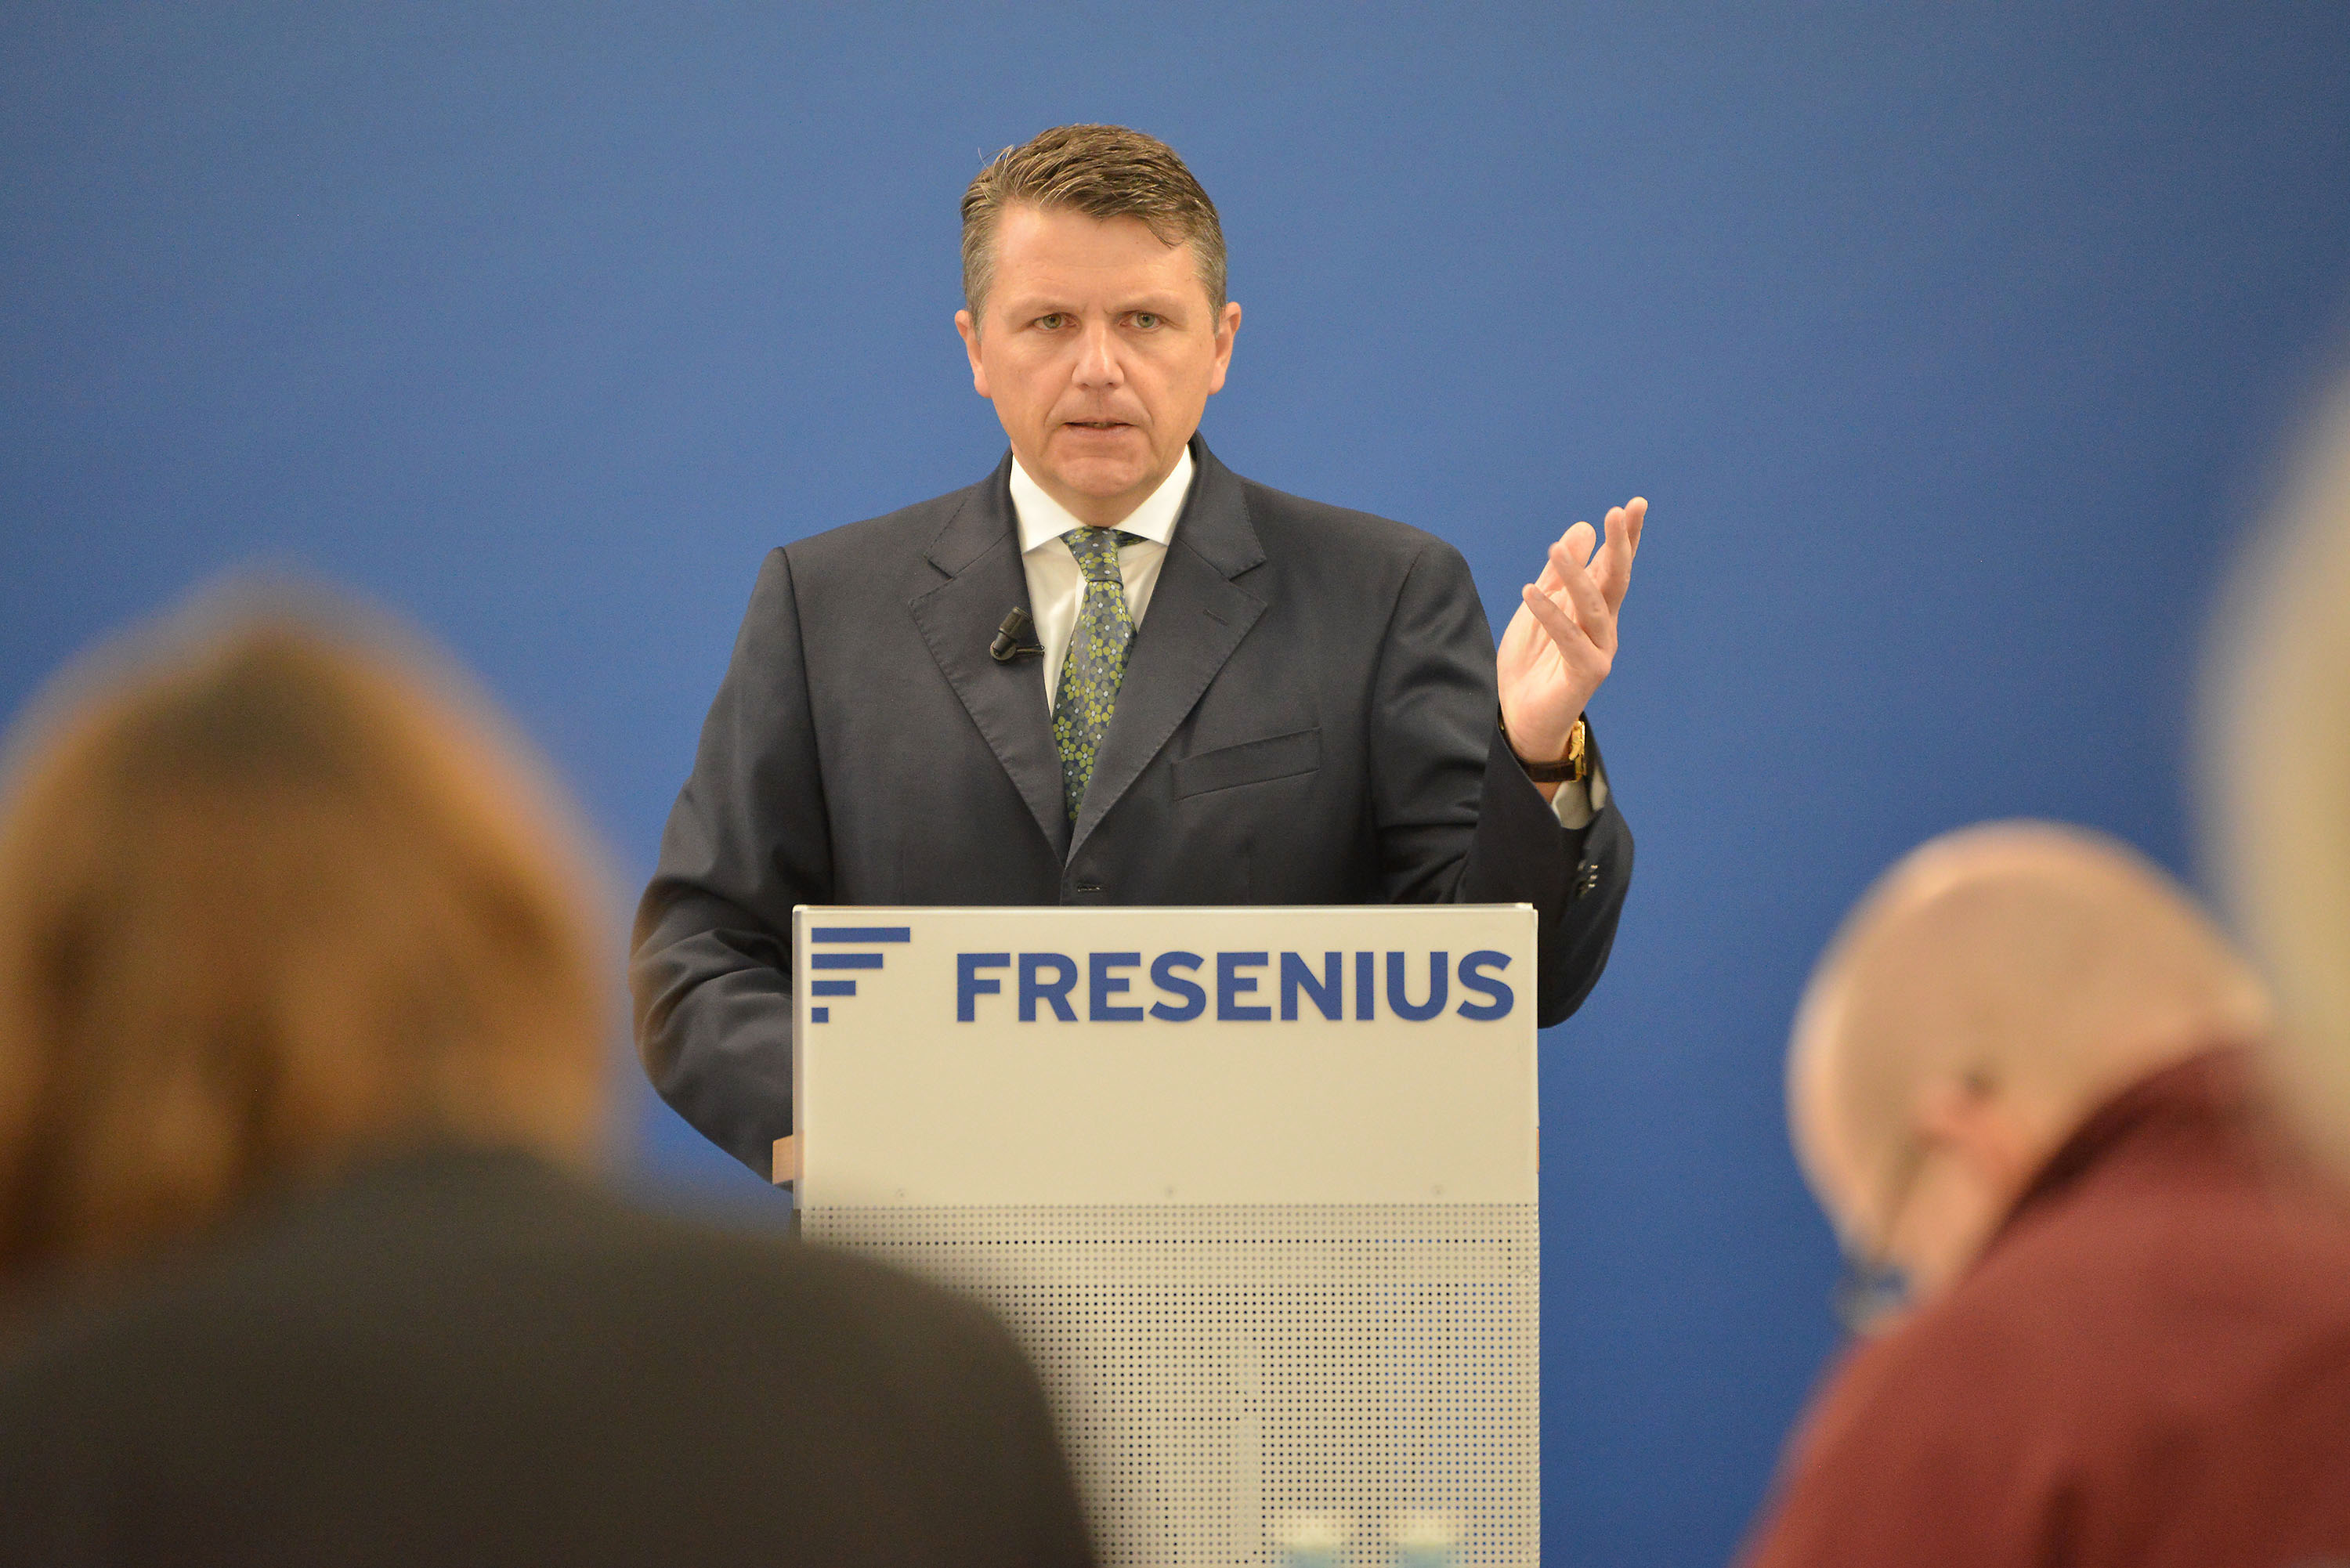
Stephan Sturm, CEO of Fresenius presenting the Full Year 2016 results at the press conference held at Fresenius headquarters in Bad Homburg, Germany. Download Image (JPG 710 KB) -
![]()
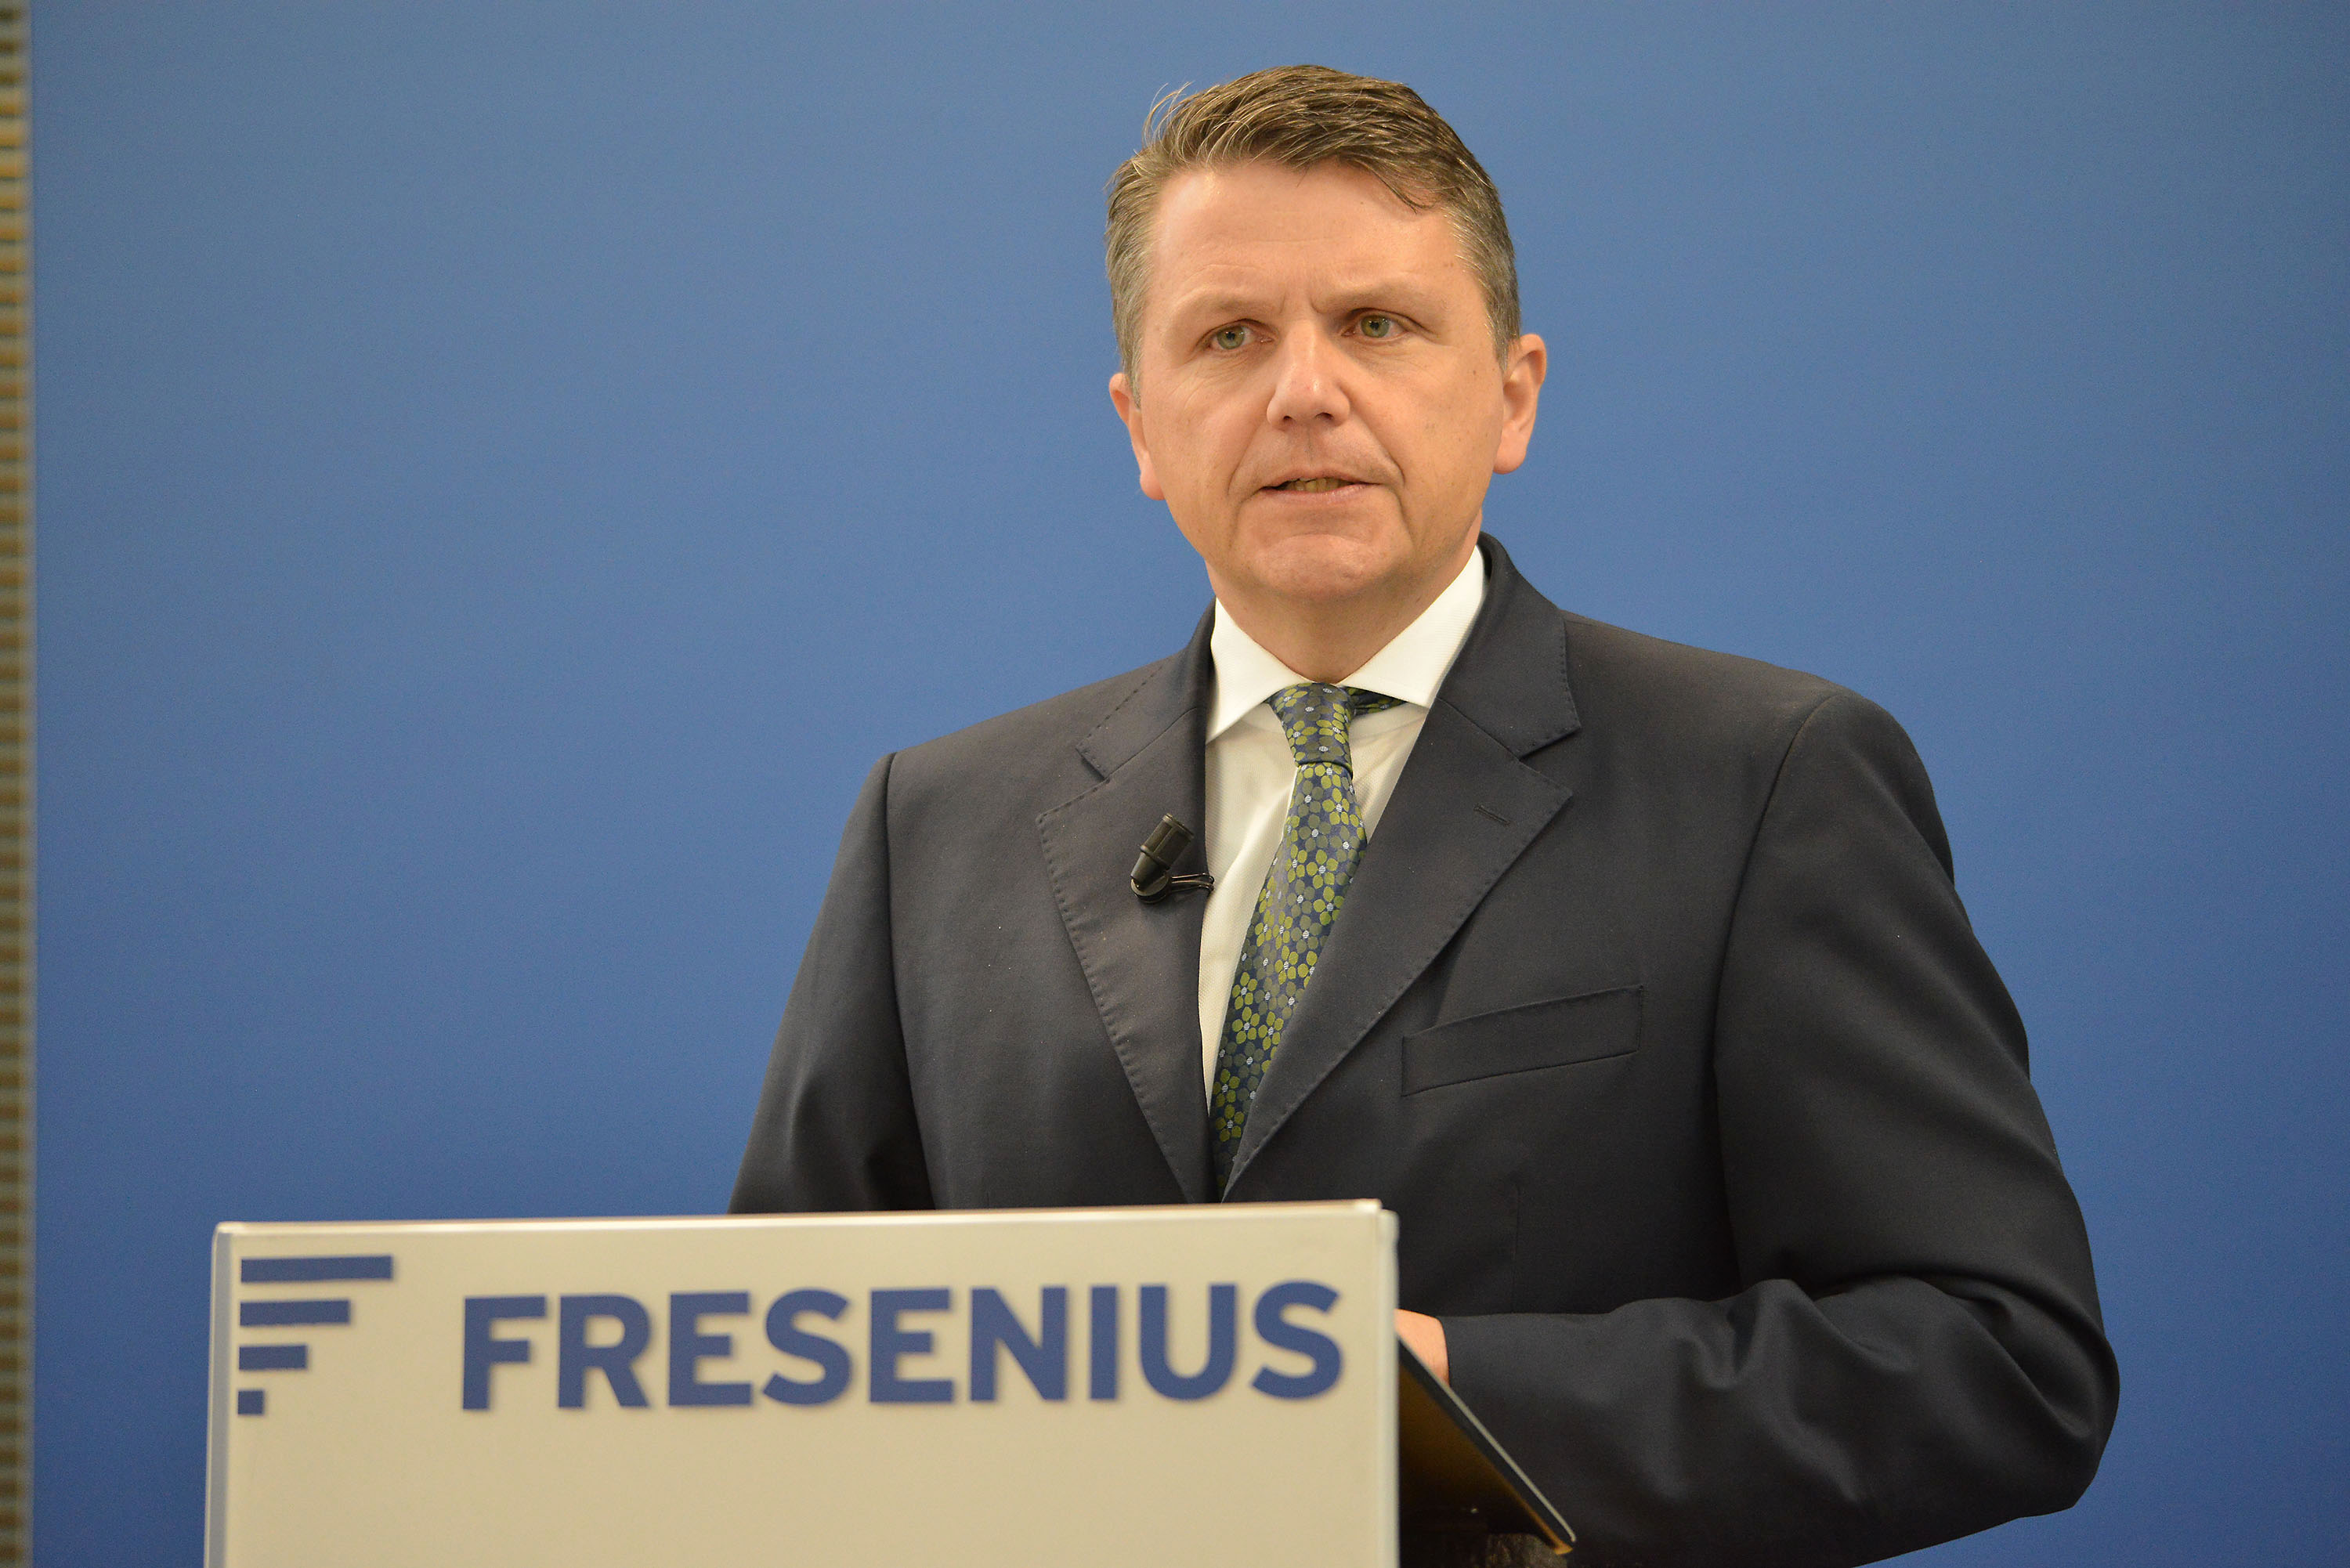
Stephan Sturm, CEO of Fresenius presenting the Full Year 2016 results at the press conference held at Fresenius headquarters in Bad Homburg, Germany. Download Image (JPG 634 KB) -
![]()
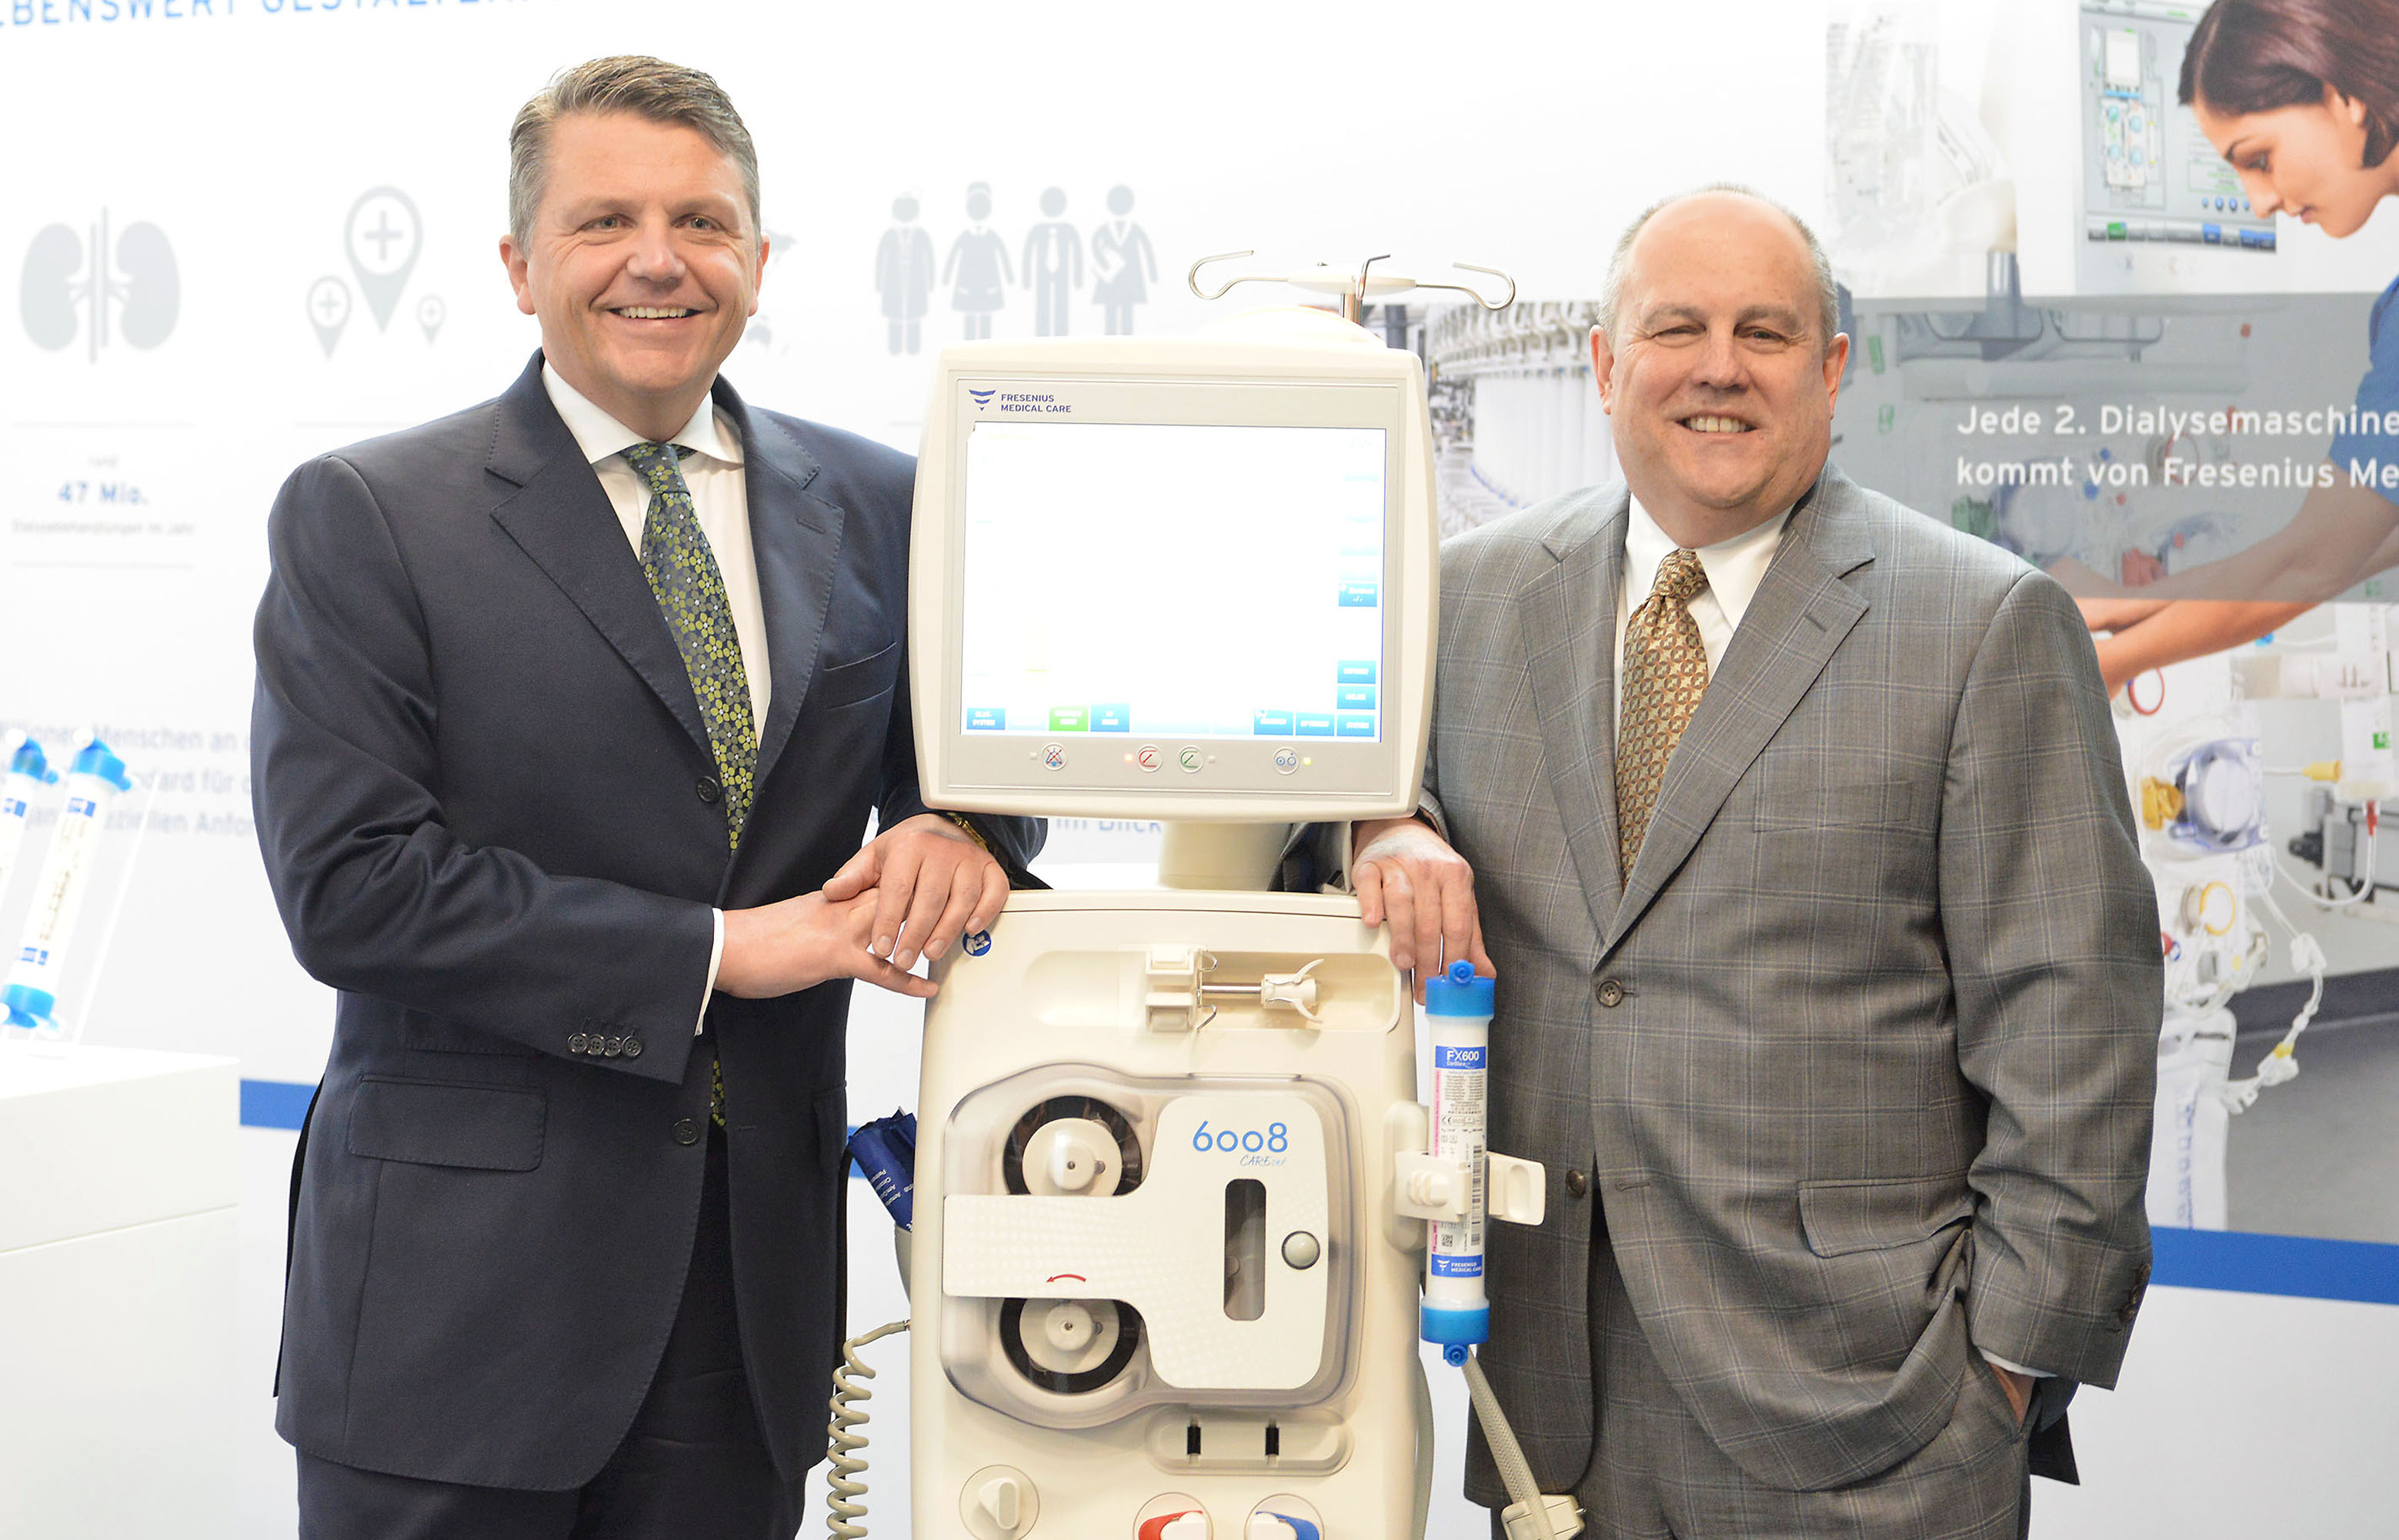
Stephan Sturm (left), CEO of Fresenius, and Rice Powell, CEO of Fresenius Medical Care, at the joint press conference. Download Image (JPG 676 KB) -
![]()
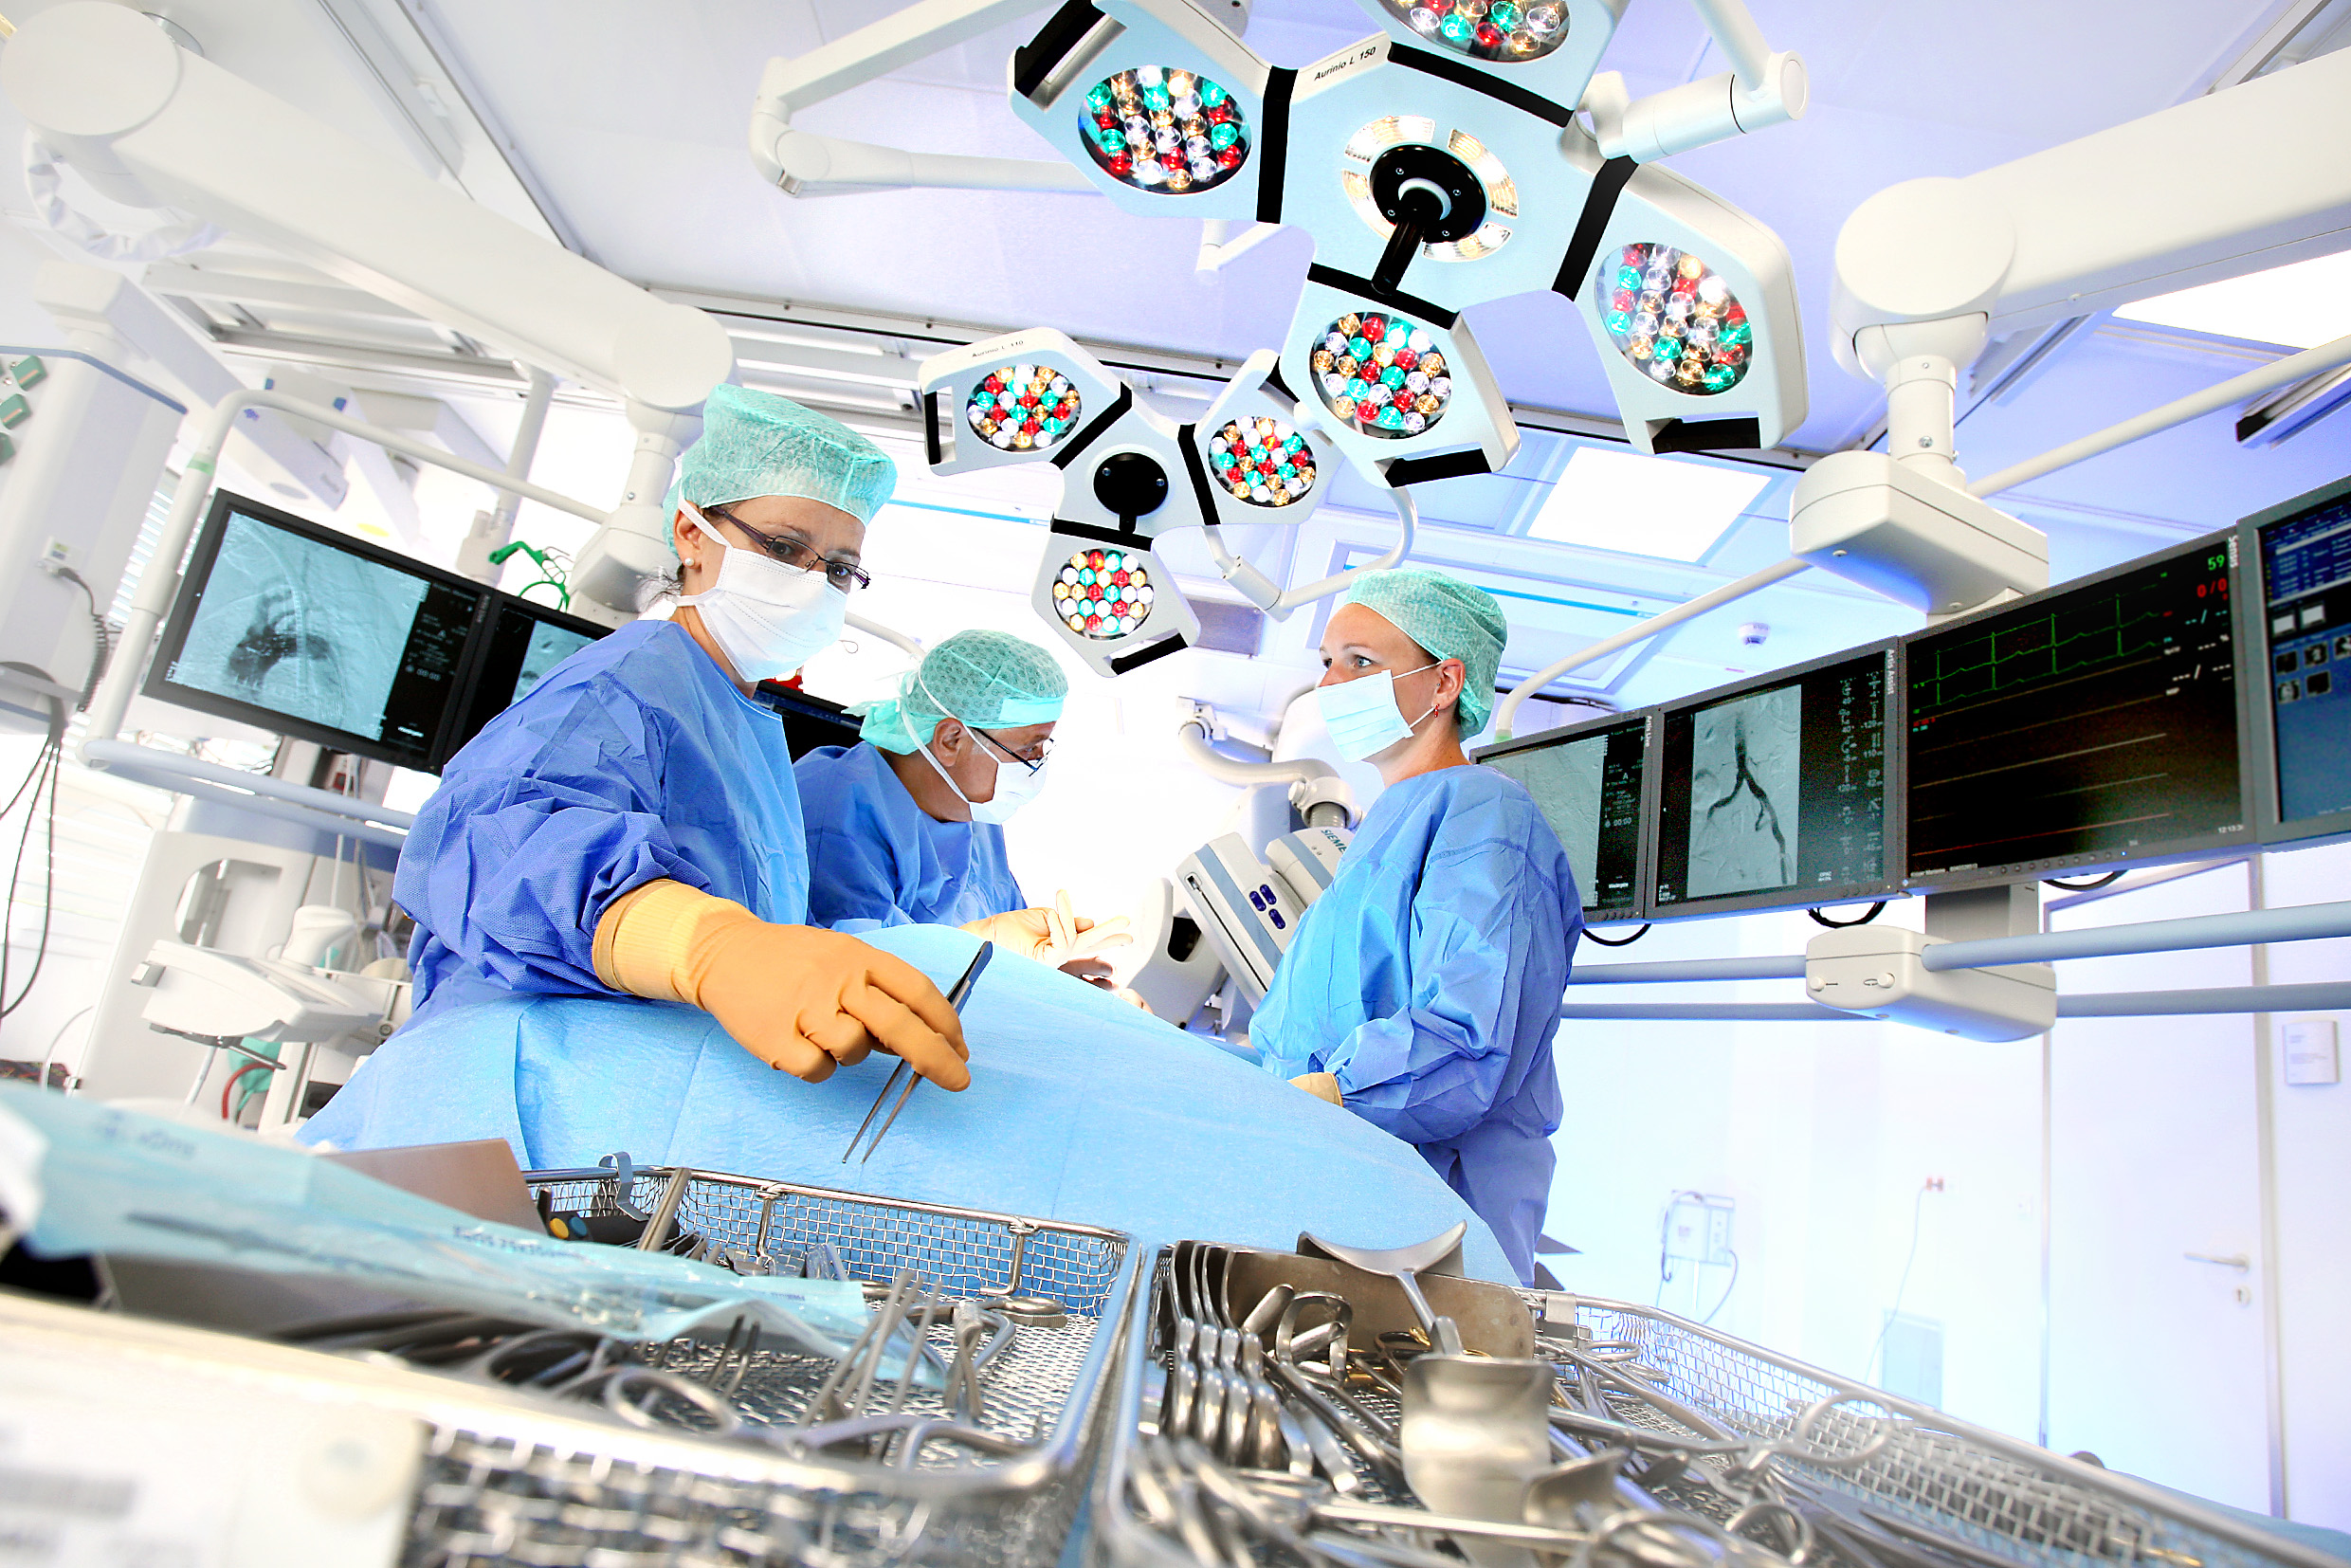
Operating room at a HELIOS clinic. More press photos can be found in our media center. Download Image (JPG 1.30 MB) -
![]()
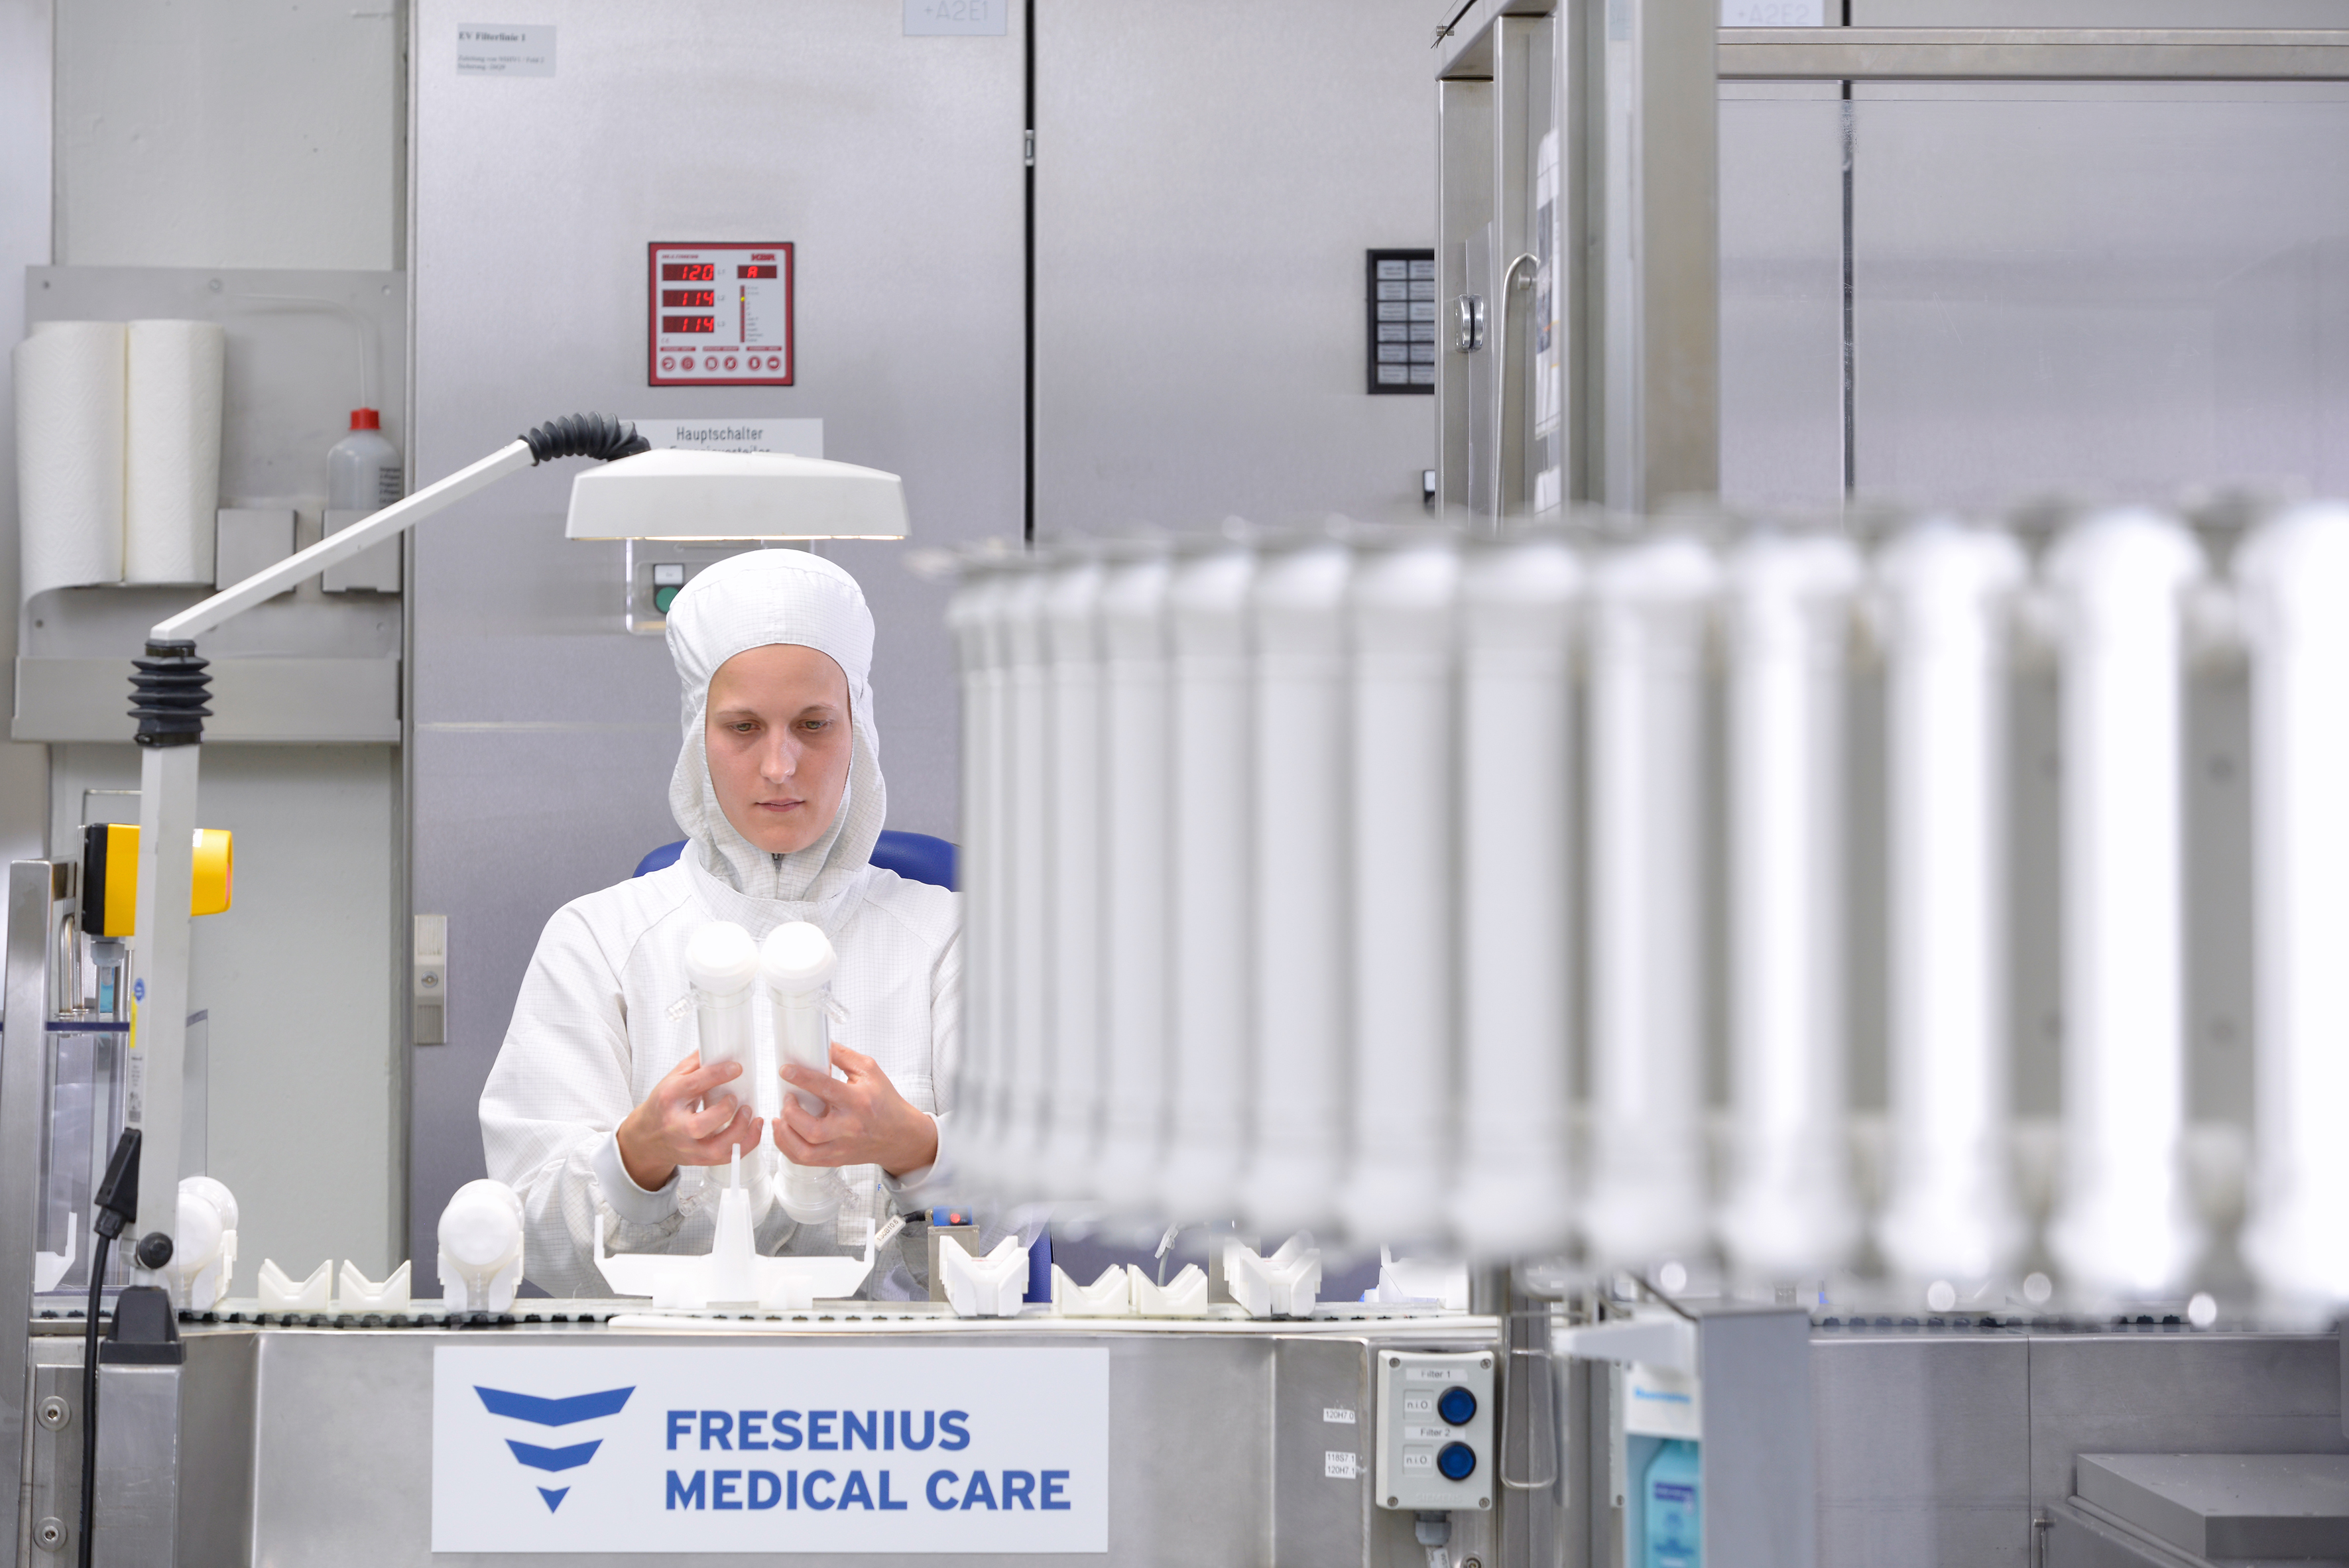
Fresenius Medical Care: Production of dialyzers at St. Wendel. More press photos can be found in our media center. Download Image (JPG 3.42 MB) -
![]()
Filling of glass bottles with liquid pharmaceuticals at the Fresenius Kabi plant in Melrose Park, USA. More press photos can be found in our media center. Download Image (JPG 271 KB)

If no timeframe is specified, information refers to fiscal year 2016.
Fiscal year 2016:
- Sales: €29.1 billion
(+5%, +6% in constant currency) - EBIT1: €4,327 million
(+9%, +10% in constant currency) - Net income1,2:€1,593 million
(+12%, +13% in constant currency) - Dividend proposal: +13% to €0.62 per share
Q4/2016:
- Sales: €7.7 billion
(+7%, +6% in constant currency) - EBIT1 €1,235 million
(+11%, +11% in constant currency) - Net income1,2 €439 million
(+6%, +7% in constant currency)
Group guidance 20173:
- Sales growth of 15% to 17% in constant currency
- Net income2 growth of 17% to 20% in constant currency
Targets 20203:
- Group sales4: between €43 billion and €47 billion
- Group net income2,4: between €2.4 billion and €2.7 billion
1 2015 before special items
2 Net income attributable to shareholders of Fresenius SE & Co. KGaA
3 Guidance according to IFRS; for a detailed overview of 2016 IFRS figures please see p. 14 of the pdf file
4 At comparable exchange rates; includes small and mid-size acquisitions; at current IFRS-rules
Stephan Sturm, CEO of Fresenius, said: “Fresenius had another truly outstanding year in 2016, setting new sales and earnings records. All four business segments again developed very successfully. The company’s prospects are excellent, and in the coming years Fresenius is targeting continued, dynamic growth. We never forget that patients are at the center of everything we do. Providing them with high-quality yet affordable healthcare around the world is the key to our business success."
Positive Group guidance for 20171
For 2017, Fresenius projects sales growth of 15% to 17% in constant currency. Net income2 is expected to grow by 17% to 20% in constant currency.
The net debt/EBITDA3 ratio is expected to be within the bottom half of Fresenius’ self-imposed target range of 2.5 to 3.0 at the end of 2017.
New ambitious targets for 20201,4
For 2020, Group sales are expected to reach €43 billion to €47 billion. Calculated on the basis of reported 2016 IFRS sales (€29,471 million) and the mid-point of the target range (€45 billion), this corresponds to a compounded annual growth rate (CAGR) of 11.2%. Based on the very strong guidance for 2017, this would result in a 2018-2020 CAGR of 8.7%.5
Group net income2 is expected to increase to €2.4 billion to €2.7 billion. Calculated on the basis of reported 2016 IFRS net income (€1,560 million) and the mid-point of the target range (€2,550 million) this corresponds to a CAGR of 13.1%. Based on the very strong guidance for 2017, this would result in a 2018-2020 CAGR of 10.5%.6
24th consecutive dividend increase proposed
Based on the strong financial results, the Management Board will propose to the Supervisory Board a dividend increase of 13% to €0.62 per share (2015: €0.55). The expected total dividend distribution is €343 million.
1 Guidance according to IFRS; for a detailed overview of 2016 IFRS figures please see p. 14of the pdf file
2 Net income attributable to shareholders of Fresenius SE & Co. KGaA
3 Calculated at expected annual average exchange rates, for both net debt and EBITDA; without large unannounced acquisitions
4 At comparable exchange rates; including small and mid-size acquisitions; at current IFRS rules
5 Based on the mid-point of the 2017 sales guidance, adjusted for current exchange rates (~€35 bn), and the mid-point of the 2020 sales target range (€45 bn)
6 Based on the mid-point of the 2017 net income guidance, adjusted for current exchange rates (~€1,890 m), and the mid-point of the 2020 net income target range (€2,550 m)
6% sales growth in constant currency
Group sales increased by 5% (6% in constant currency) to €29,083 million (2015: €27,626 million). Organic sales growth was 6%. Acquisitions contributed 1% and divestitures reduced sales by 1%. Slightly negative currency translation effects (1%) were mainly driven by the devaluation of Latin American currencies and the Chinese yuan against the Euro. In Q4/2016, Group sales increased by 7% (6% in constant currency) to €7,738 million (Q4/2015: €7,257 million). Organic sales growth was 5%. Acquisitions contributed 1%, while divestitures had no major impact on sales.
Group sales by region:


13% net income1,2 growth in constant currency
Group EBITDA2 increased by 8% (9% in constant currency) to €5,500 million (2015: €5,073 million). Group EBIT2 increased by 9% (10% in constant currency) to €4,327 million (2015: €3,958 million). The EBIT margin2 increased to 14.9% (2015: 14.3%).
In Q4/2016, Group EBIT2 increased by 11% (11% in constant currency) to €1,235 million (Q4/2015: €1,109 million), the EBIT margin2 improved to 16.0% (Q4/2015: 15.3%).
Group net interest decreased to -€582 million (2015: -€613 million), mainly due to favourable financing terms and interest savings on lower average debt. In Q4/2016, Group net interest increased to -€149 million (Q4/2015: -€137 million) mainly due to the bridge financing for the Quirónsalud acquisition.
The Group tax rate2 decreased to 28.1% (2015: 29.4%). The decrease is mainly due to released tax liabililities at Fresenius Medical Care in Q3/2016. In Q4/2016, the Group tax rate also decreased to 28.1% (Q4/2015: 28.8%).
Noncontrolling interest was €1,101 million (2015: €939 million), of which 96% was attributable to the noncontrolling interest in Fresenius Medical Care.
Group net income1,2 increased by 12% (13% in constant currency) to €1,593 million (2015: €1,423 million). Earnings per share1,2 increased by 12% (13% in constant currency) to €2.92 (2015: €2.61). In Q4/2016, Group net income1,2 increased by 6% (7% in constant currency) to €439 million (Q4/2015: €414 million). Earnings per share1,2 increased by 7% (8% in constant currency) to €0.81 (Q4/2015: €0.75).
Continued investment in growth
Spending on property, plant and equipment was €1,621 million (2015: €1,512 million), primarily for the modernization and expansion of dialysis clinics, production facilities and hospitals. This corresponds to 5.6% of sales.
Total acquisition spending increased to €926 million (2015: €517 million), mainly related to acquisitions at Fresenius Medical Care.
1 Net income attributable to shareholders of Fresenius SE & Co. KGaA
2 2015 before special items
For a detailed overview of special items please see the reconciliation tables on pages 17-18 of the pdf file.
Excellent cash flow development
Operating cash flow increased by 7% to €3,574 million (2015: €3,327 million) with a margin of 12.3% (2015: 12.0%). The excellent cash flow was driven by a strong cash flow generation at Fresenius Medical Care and especially the record cash flow at Fresenius Kabi. Operating cash flow in Q4/2016 increased by 12% to €1,315 million (Q4/2015: €1,176 million) with a margin of 17.0% (Q4/2015: 16.2%).
Free cash flow before acquisitions and dividends increased by 6% to €1,971 million (2015: €1,865 million), with a margin of 6.8% (2015: 6.8%). Free cash flow after acquisitions and dividends was €748 million (2015: €1,194 million).
Solid balance sheet structure
The Group’s total assets increased by 8% (6% in constant currency) to €46,447 million (Dec. 31, 2015: €42,959 million), driven by its growing scale of operations. Current assets grew by 13% (11% in constant currency) to €11,799 million (Dec. 31, 2015: €10,479 million). Non-current assets increased by 7% (5% in constant currency) to €34,648 million (Dec. 31, 2015: € 32,480 million).
Total shareholders’ equity increased by 13% (11% in constant currency) to €20,420 million (Dec. 31, 2015: €18,003 million). The equity ratio increased to 44.0% (Dec. 31, 2015: 41.9%).
Group debt remained nearly unchanged (-2% in constant currency) at €14,780 million (Dec. 31, 2015: € 14,769 million). Group net debt decreased by 4% (-5% in constant currency) to € 13,201 million (Dec. 31, 2015: € 13,725 million). As of December 31, 2016, the net debt/EBITDA ratio was 2.341 (December 31, 2015: 2.682). EBITDA growth and net debt reduction made an about equal contribution to this substantial improvement of the ratio.
Increased number of employees
As of December 31, 2016, the number of employees increased by 5% to 232,873 (Dec. 31, 2015: 222,305).
1 At LTM average exchange rates for both net debt and EBITDA; pro forma acquisitions
2 Before special items; at LTM average exchange rates for both net debt and EBITDA
For a detailed overview of special items please see the reconciliation tables on pages 17-18 of the pdf file.
Business Segments
Fresenius Medical Care
Fresenius Medical Care is the world's largest provider of products and services for individuals with renal diseases. As of December 31, 2016, Fresenius Medical Care was treating 308,471 patients in 3,624 dialysis clinics. Along with its core business, the company seeks to expand the range of medical services in the field of care coordination.


- 7% sales growth, 16% net income growth1,2
- Health Care services with positive growth momentum (sales +8%)
- 2017 outlook3: 8% to 10% sales growth in constant currency and 7 to 9% net income growth1,5 in constant currency expected
Sales increased by 7% (8% in constant currency) to US$17,911 million (2015: US$16,738 million). Organic sales growth was 7%. Acquisitions and divestitures increased sales by 1%. Currency translation effects reduced sales by 1%. In Q4/2016, sales increased by 8% (9% in constant currency) to US$4,687 million (Q4/2015: US$4,348 million).
Health Care services sales (dialysis services and care coordination) increased by 8% (9% in constant currency) to US$14,519 million (2015: US$13,392 million). Dialysis product sales increased by 1% (4% in constant currency) to US$3,392 million (2015: US$3,346 million).
In North America, sales increased by 9% to US$12,886 million (2015: US$11,813 million). Health Care services sales grew by 10% to US$11,982 million (2015: US$10,932 million). Dialysis product sales increased by 3% to US$904 million (2015: US$881 million).
1 Net income attributable to shareholders of Fresenius Medical Care AG & Co. KGaA
2 2016 before acquisitions (US$ 15 million after tax), 2015 before settlement costs for an agreement in principle for GranuFlo® / NaturaLyte® case (- US$ 37 million after tax), and acquisitions (US$ 9 million after tax)
3 Guidance according to IFRS and in Euro currency; for a detailed overview of 2016 IFRS figures please see p. 15 of the pdf file
4 Based on 2016 sales of €16,570 million. The effects of the agreement with the U.S. Departments of Veterans Affairs and Justice are excluded.
5 Based on 2016 net income of €1,144 million. The effects of the agreement with the U.S. Departments of Veterans Affairs and Justice are excluded.
Sales outside North America increased by 2% (7% in constant currency) to US$5,011 million (2015: US$4,897 million). Health Care services sales increased by 3% (9% in constant currency) to US$2,537 million (2015: US$2,459 million). Dialysis product sales increased by 2% (5% in constant currency) to US$2,474 million (2015: US$2,437 million).
EBIT increased by 13% (14% in constant currency) to US$2,638 million (2015: US$2,327 million). The EBIT margin was 14.7% (2015: 13.9%). Adjusted for one-time items1, EBIT increased by 10%. In Q4/2016, EBIT increased by 19% (19% in constant currency) to US$786 million (Q4/2015: US$662 million). The EBIT margin was 16.8% (Q4/2015: 15.2%).
Net income attributable to shareholders of Fresenius Medical Care AG & Co. KGaA excluding one-time items2 increased by 16% to US$1,228 million (2015: US$1,057 million). Net income5 including one-time items increased by 21% (21% in constant currency). Net income attributable to non-controlling interest increased by 8% to US$306 million. In Q4/2016, net income5 increased by 23% to US$388 million (2015: US$317 million).
Operating cash flow increased by 9% to US$2,140 million (2015: US$1,960 million), despite a discretionary cash contribution of US$100 million to Fresenius Medical Care’s pension plan assets in the United States in Q3/2016. The cash flow margin was 11.9% (2015: 11.7%). In Q4/2016, operating cash flow reached an excellent US$844 million (Q4/2015: US$548 million) with a margin of 18.0% (Q4/2015: 12.6%).
For 2017, Fresenius Medical Care expects sales to grow by 8% to 10%3,4 in constant currency. Net income attributable to shareholders of Fresenius Medical Care AG & Co. KGaA is expected to increase by 7% to 9%3,5,6 in constant currency in 2017. The effects of the agreement with the U.S. Departments of Veterans Affairs and Justice are excluded.
For further information, please see Fresenius Medical Care’s Press Release at www.freseniusmedicalcare.com.
1 2016 before acquisitions (US$39 million before tax), 2015 before settlement costs for an agreement in principle for GranuFlo® / NaturaLyte® case (- US$ 60 million before tax), and acquisitions (US$ 16 million before tax)
2 2016 before acquisitions (US$ 15 million after tax), 2015 before settlement costs for an agreement in principle for GranuFlo® / NaturaLyte® case (- US$ 37 million after tax), and acquisitions (US$ 9 million after tax)
3 Guidance according to IFRS and in Euro currency; for a detailed overview of 2016 IFRS figures please see p. 15 of the pdf file
4 Based on 2016 sales of €16,570 million.
5 Net income attributable to shareholders of Fresenius Medical Care AG & Co. KGaA
6 Based on 2016 net income of €1,144 million.
Fresenius Kabi
Fresenius Kabi offers intravenously administered generic drugs, clinical nutrition and infusion therapies for seriously and chronically ill patients in the hospital and outpatient environments. The company is also a leading supplier of medical devices and transfusion technology products.

- 5% organic sales growth, 5% EBIT1 growth in constant currency
- Operating cash flow and cash flow margin at all-time high
- 2017 outlook3: 5% to 7% organic sales growth and 5% to 7% EBIT growth in constant currency expected
Sales increased by 1% (4% in constant currency) to €6,007 million (2015: €5,950 million). Organic sales growth was 5%. Divestitures reduced sales by 1%. Negative currency translation effects (-3%) were mainly related to the devaluation of Latin American currencies and the Chinese yuan against the Euro. In Q4/2016, sales increased by 2% (3% in constant currency) to €1,550 million (Q4/2015: €1,519 million). Organic sales growth was 3%.
Sales in Europe grew by 1% (organic growth: 3%) to €2,135 million (2015: €2,123 million). Divestments, including the sale of the German oncology compounding business in February 2015, reduced sales by 1%.
Sales in North America increased by 4% (organic growth: 3%) to €2,170 million (2015: €2,093 million), mainly driven by new product launches. Asia-Pacific sales decreased by 3% (organic growth: 8%) to €1,108 million (2015: €1,141 million) due to currency translation effects. With €594 million (2015: €593 million), sales in Latin America/Africa was on prior year level (organic growth: 14%).
1 2015 before special items
2 Net income attributable to shareholders of Fresenius Kabi AG; 2015 before special items
3 Guidance according to IFRS; for a detailed overview of 2016 IFRS figures please see p. 15 of the pdf file
For a detailed overview of special items please see the reconciliation tables on pages 17-18 of the pdf file.
EBIT1 increased by 3% (5% in constant currency) to €1,224 million (2015: €1,189 million). The EBIT margin1 improved to 20.4% (2015: 20.0%). In Q4/2016, EBIT1 decreased by 3% ( 1% in constant currency) to €308 million (Q4/2015: €317 million). The EBIT margin1 was 19.9% (Q4/2015: 20.9%).
Net income2 increased by 7% (9% in constant currency) to €716 million (2015: €669 million). In Q4/2016, net income2 decreased by 3% (-2% in constant currency) to €184 million (Q4/2015: €190 million).
Operating cash flow reached an all-time high of €991 million (2015: €913 million). The cash flow margin increased to 16.5% (2015: 15.3%). In Q4/2016, operating cash flow increased by 6% to €345 million (Q4/2015: €324 million) driven by excellent operating results, lower sequential inventory and a reduction of the Days Sales Outstanding (DSO). The margin reached an outstanding 22.3% (Q4/2015: 21.3%).
For 2017, Fresenius Kabi expects organic sales growth of 5% to 7%3 and EBIT growth in constant currency of 5% to 7%3.
1 2015 before special items
2 Net income attributable to shareholders of Fresenius Kabi AG; 2015 before special items
3 Guidance according to IFRS; for a detailed overview of 2016 IFRS figures please see p. 15 of the pdf file
For a detailed overview of special items please see the reconciliation tables on pages 17-18 of the pdf file
Fresenius Helios
Fresenius Helios is Europe’s largest private hospital operator. In Germany, HELIOS operates 112 hospitals, thereof 88 acute care clinics (including seven maximum care hospitals in Berlin-Buch, Duisburg, Erfurt, Krefeld, Schwerin, Wiesbaden and Wuppertal) and 24 post-acute care clinics. Through Quirónsalud, Fresenius Helios operates 43 hospitals, 39 outpatient centers and around 300 Occupational Risk Prevention (ORP) centers in Spain.

- 4% organic sales growth, €682 million EBIT1
- Acquisition of Quirónsalud closed as of January 31, 2017
- 2017 outlook3: 3% to 5%4 organic sales growth, sales of ~€8.6 bn (thereof Quirónsalud €2.5 bn5) and EBIT of €1,020 to €1,070 million (thereof Quirónsalud €300 to €320 million5,6) expected
Sales increased by 5% to €5,843 million (2015: €5,578 million). Organic sales growth was 4%. Acquisitions contributed 1%. In Q4/2016, sales increased by 4% to €1,461 million (Q4/2015: €1,411 million), organic sales growth was 2%.
EBIT1 grew by 7% to €682 million (2015: €640 million). The EBIT margin1 increased to 11.7% (2015: 11.5%). In Q4/2016, EBIT1 increased by 4% to €175 million (Q4/2015: €168 million) with a margin1 of 12.0% (Q4/2015: 11.9%).
Net income2 increased by 12% to €543 million (2015: €483 million). In Q4/2016, net income2 increased by 8% to €141 million (Q4/2015: €131 million).
Operating cash flow increased by 1% to €622 million (2015: €618 million) with a margin of 10.6% (2015: 11.1%). In Q4/2016, operating cash flow reached a strong €185 million, but could not match the exceptional prior-year quarter (Q4/2015: €232 million). The same applies to the cash flow margin of 12.7% (Q4/2015: 16.4%).
1 2015 before special items
2 Net income attributable to shareholders of HELIOS Kliniken GmbH; before special items
3 Guidance according to IFRS; for a detailed overview of 2016 IFRS figures please see p. 15 of the pdf file
4 Helios Kliniken Germany, excluding Quirónsalud
5 Quirónsalud consolidated for 11 months
6 EBITDA of €480 to €500 million, Amortization of €80 million and depreciation of €100 million
For a detailed overview of special items please see the reconciliation tables on pages 17-18 of the pdf file.
For 2017, Fresenius Helios expects organic sales growth of 3% to 5%1,2 and sales of ~€8.6 bn2 (thereof Quirónsalud ~€2.5 bn3). EBIT is expected to increase to €1,020 to €1,070 million2 (thereof Quirónsalud €300 to €320 million3,4).
1 Helios Kliniken Germany, excluding Quirónsalud
2 Guidance according to IFRS; for a detailed overview of 2016 IFRS figures please see p. 15 of the pdf file
3 Quirónsalud consolidated for 11 months
4 EBITDA of €480 to €500 million, Amortization of €80 million and depreciation of €100 million
For a detailed overview of special items please see the reconciliation tables on pages 17-18 of the pdf file.
Fresenius Vamed
Fresenius Vamed manages projects and provides services for hospitals and other health care facilities worldwide. The portfolio ranges along the entire value chain: from project development, planning, and turnkey construction, via maintenance and technical management, to total operational management.

- 5% organic sales growth, 8% EBIT growth
- Order intake of €1,017 million at all-time high
- 2017 outlook1: 5% to 10% organic sales growth and 5% to 10% EBIT growth expected
Sales increased by 4% (4% in constant currency) to €1,160 million (2015: €1,118 million). Organic sales growth was 5%. Sales in the project business increased by 3% to €594 million (2015: €575 million). Sales in the service business grew by 4% to €566 million (2015: €543 million). In Q4/2016, sales increased to €420 million (Q4/2015: €387 million). Organic sales growth was 10%.
EBIT grew by 8% to €69 million (2015: €64 million). The EBIT margin increased to 5.9% (2015: 5.7%). In Q4/2016, EBIT increased by 12% to €38 million (Q4/2015: €34 million). The EBIT margin increased to 9.0%.
Net income2 grew by 2% to €45 million (2015: €44 million). In Q4/2016, net income2 remained unchanged at €24 million (Q4/2015: €24 million).
Order intake increased to €1,017 million (2015: €904 million), reaching an all-time high. As of December 31, 2016, order backlog was €1,961 million (Dec. 31, 2015: €1,650 million).
For 2017, Fresenius Vamed expects organic sales growth in the range of 5% to 10%1 and EBIT growth of 5% to 10%1.
1 Guidance according to IFRS; for a detailed overview of 2016 IFRS figures please see p. 15 of the pdf file
2 Net income attributable to shareholders of VAMED AG
Press Conference
As part of the publication of the results for fiscal year 2016, a press conference will be held on February 22, 2017 at 10 a.m. CET. You are cordially invited to follow the press conference in a live broadcast over the Internet at www.fresenius.com/media-calendar. Following the press conference, a replay will be available on our website.
This release contains forward-looking statements that are subject to various risks and uncertainties. Future results could differ materially from those described in these forward-looking statements due to certain factors, e.g. changes in business, economic and competitive conditions, regulatory reforms, results of clinical trials, foreign exchange rate fluctuations, uncertainties in litigation or investigative proceedings, and the availability of financing. Fresenius does not undertake any responsibility to update the forward-looking statements in this release.