

November 4, 2014
Fresenius posts strong Q3 results and confirms 2014 Group outlook
This Investor News and future issues will feature more detailed information on the individual quarter. If no timeframe is specified, information refers to the first nine months of 2014.
Q3/2014:
- Sales €6.0 billion (+20% in constant currency, +18% at actual rates)
- EBIT1 €820 million (+10% in constant currency, +9% at actual rates)
- Net income2 €281 million (+5% in constant currency, +4% at actual rates)
Q1-3/2014:
- Sales €16.7 billion (+14% in constant currency, +11% at actual rates)
- EBIT3 €2.2 billion (+3% in constant currency, +1% at actual rates)
- Net income4 €768 million (+4% in constant currency, +2% at actual rates)
Ulf Mark Schneider, CEO of Fresenius, said: "Fresenius had a strong third quarter with growth accelerating in all four business segments. Emerging markets stood out with double-digit organic sales growth. We confirm our full year Group guidance and remain optimistic about the fundamental growth trends in our markets."
1 before integration costs
2 Net income attributable to shareholders of Fresenius SE & Co. KGaA; before integration costs
3 2014 before integration costs and disposal gains (two HELIOS hospitals, Rhön stake); 2013 before integration costs
4 Net income attributable to shareholders of Fresenius SE & Co. KGaA; 2014 before integration costs and disposal gains (two HELIOS hospitals, Rhön stake); 2013 before integration costs
For a detailed overview of integration costs and disposal gains please see the reconciliation tables in the PDF on page 15f.
2014 Group outlook1 fully confirmed
Based on the Group's strong financial results in the first three quarters, Fresenius confirms its 2014 Group guidance. Sales are expected to increase by 14% to 16%, net income2 is expected to increase by 2% to 5% (both in constant currency).
The net debt/EBITDA ratio is expected to be approximately 3.25 at year-end.
14% sales growth in constant currency
Group sales increased by 11% (14% in constant currency) to €16,711 million (Q1-3/2013: €15,032 million). Organic sales growth was 4%. Acquisitions contributed 11%. Divestitures reduced sales growth by 1%. In Q3/2014, Group sales increased by 18% (20% in constant currency) to €5,978 million (Q3/2013: €5,045 million). Organic sales growth was 6%.
Group sales by region developed as follows:
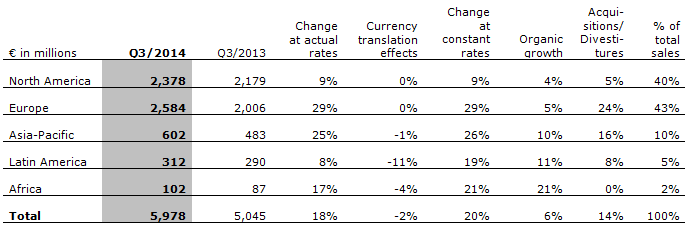
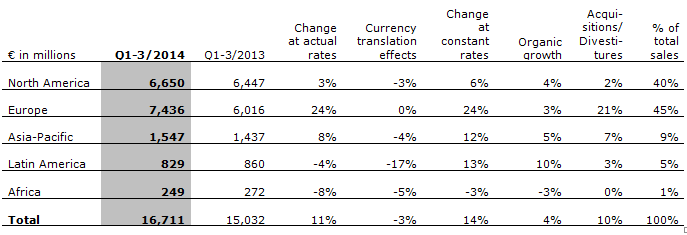

In the first nine months, organic sales growth was 4% in North America and 3% in Europe. In Asia-Pacific organic sales growth was 5%. In Latin America organic sales growth was 10%. In Africa, the decline in sales is mainly due to fluctuations in the project business at Fresenius Vamed. Adverse currency translation effects weighed on Group sales in Latin America (-17%), Asia-Pacific (-4%), Africa (-5%) and North America (-3%).
1 Includes contributions from the acquisition of hospitals from Rhön-Klinikum AG and acquisitions at Fresenius Medical Care
2 Net income attributable to shareholders of Fresenius SE & Co. KGaA; 2014 before integration costs and disposal gains (two HELIOS hospitals, Rhön stake)
4% net income growth in constant currency
Group EBITDA1 grew by 3% (5% in constant currency) to €2,905 million (Q1-3/2013: €2,824 million). Group EBIT1 increased by 1% (3% in constant currency) to €2,223 million (Q1-3/2013: €2,202 million). The EBIT margin was 13.3% (Q1-3/2013: 14.6%). In Q3/2014 Group EBIT2 was €820 million (Q3/2013: €754 million), the EBIT margin was 13.7% (Q3/2013: 14.9%).
Group net interest was -€431 million (Q1-3/2013:-€449 million). Improved financing terms as well as favorable currency effects contributed to the decrease.
The Group tax rate1 was 29.5% and above the prior-year level (Q1-3/2013: 28.3%). This is mainly due to a special tax effect at Fresenius Medical Care in Q2/2014.
Noncontrolling interest was €495 million (Q1-3/2013: €504 million), of which 95% was attributable to the noncontrolling interest in Fresenius Medical Care.
Group net income3 increased by 2% (4% in constant currency) to €768 million(Q1-3/2013: €753 million). Earnings per share3 increased by 1% (2% in constant currency) to €1.42 (Q1-3/2013: €1.41). The weighted average number of shares outstanding was 539,976,138 (Q1-3/2013: 535,366,314). In Q3/2014, Group net income4 increased by 4% (5% in constant currency) to €281 million (Q3/2013: €271 million).
Group net income attributable to shareholders of Fresenius SE & Co. KGaA (including special items) increased by 11% (13% in constant currency) to €810 million (Q1-3/2013: €727 million). Earnings per share increased by 10% (12% in constant currency) to €1.50 (Q1-3/2013: €1.36). In Q3/2014, Group net income attributable to shareholders of Fresenius SE & Co. KGaA (including special items) increased by 4% (6% in constant currency) to €276 million (Q3/2013: €265 million). Earnings per share increased by 2% (4% in constant currency) to €0.51 (Q3/2013: €0.50).
1 2014 before integration costs and disposal gains (two HELIOS hospitals, Rhön stake); 2013 before integration costs
2 2014 before integration costs; 2013 before integration costs
3 Net income attributable to shareholders of Fresenius SE & Co. KGaA; 2014 before integration costs and disposal gains (two HELIOS hospitals, Rhön stake); 2013 before integration costs
4 Net income attributable to shareholders of Fresenius SE & Co. KGaA; 2014 before integration costs; 2013 before integration costs
Reconciliations to earnings according to U.S. GAAP can be found on page 15f in the PDF of this Investor News.
Continued investment in growth
The Fresenius Group spent €854 million on property, plant and equipment (Q1-3/2013: €676 million). The Company primarily invested in the modernization and expansion of production facilities and hospitals as well as in the equipment of new, and the expansion of existing dialysis clinics.
Total acquisition spending was €1,861 million (Q1-3/2013: €442 million), including €805 million for the acquisition of hospitals from Rhön-Klinikum AG and €919 million for acquisitions at Fresenius Medical Care.
Strong cash flow margin increase in Q3
Operating cash flow increased by 8% to €1,695 million (Q1-3/2013: €1,566 million) with a margin of 10.1% (Q1-3/2013: 10.4%). The margin decrease was attributable to the payment for the W.R. Grace bankruptcy settlement of US$1151 million in Q1/2014 and increased working capital at Fresenius Medical Care. Operating cash flow in Q3/2014 increased to €945 million with a margin of 15.8% (Q3/2013: €619 million with a margin of 12.3%). The strong Q3/2014 margin is due to the very good sequential and year-on-year cash flow development in all business segments.
Net capital expenditure increased to €848 million (Q1-3/2013: €659 million). Free cash flow before acquisitions and dividends was €847 million (Q1-3/2013: €907 million). Free cash flow after acquisitions and dividends was -€1,154 million (Q1-3/2013: €151 million).
1 see Annual Report 2013, page 150 f.
Solid balance sheet structure
The Group's total assets increased by 15% (10% in constant currency) to €37,718 million (Dec. 31, 2013: €32,758 million). This increase is mainly attributable to the first-time consolidation of hospitals acquired from Rhön-Klinikum AG, acquisitions at Fresenius Medical Care and currency effects. Current assets grew by 20% (16% in constant currency) to €9,584 million (Dec. 31, 2013: €7,972 million). Non-current assets increased by 14% (8% in constant currency) to €28,134 million (Dec. 31, 2013: €24,786 million).
Total shareholders' equity increased by 12% (7% in constant currency) to €14,854 million (Dec. 31, 2013: €13,260 million). The equity ratio was 39.4% (Dec. 31, 2013: 40.5%).
Group debt grew by 16% (11% in constant currency) to €14,878 million (Dec. 31, 2013: €12,804 million). Net debt was €13,843 million (Dec. 31, 2013: €11,940 million). The increase is mainly due to the hospitals acquired from Rhön-Klinikum AG, the acquisitions at Fresenius Medical Care as well as currency effects.
As of September 30, 2014, the net debt/EBITDA ratio was 3.441 (Dec. 31, 2013: 2.512).
1 Pro forma including acquired Rhön hospitals, acquisition at Fresenius Medical Care and excluding two HELIOS hospitals; before integration costs and disposal gains (two HELIOS hospitals; Rhön stake)
2 Pro forma excluding advances made for the acquisition of hospitals from Rhön-Klinikum AG; before integration costs
Business Segments
Fresenius Medical Care
Fresenius Medical Care is the world's leading provider of services and products for patients with chronic kidney failure. As of September 30, 2014, Fresenius Medical Care was treating 283,135 patients in 3,349 dialysis clinics.

- 7% organic sales growth in Q3
- 17.3% operating cash flow margin in Q3
- 2014 guidance confirmed
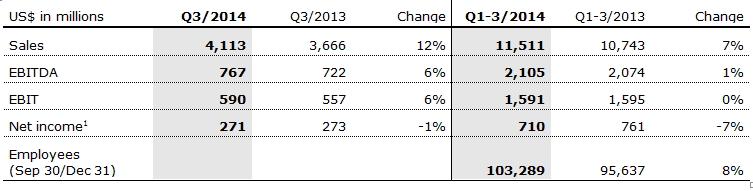
Sales increased by 7% (8% in constant currency) to US$11,511 million (Q1-3/2013: US$10,743 million). Organic sales growth was 5%. Acquisitions contributed 4%, while divestitures reduced sales growth by 1%. In Q3/2014, sales increased by 12% to US$4,113 (Q3/2013: US$3,666).
Sales in dialysis services increased by 8% (10% in constant currency) to US$8,928 million (Q1-3/2013: US$8,235 million). Dialysis product sales grew by 3% (3% in constant currency) to US$2,583 million (Q1-3/2013: US$2,508 million).
In North America, sales grew by 7% to US$7,624 million (Q1-3/2013: US$7,099 million). Dialysis services sales increased by 8% to US$7,015 million (Q1-3/2013: US$6,485 million). Dialysis product sales decreased by 1% to US$609 million (Q1-3/2013: US$614 million).
Sales outside North America ("International" segment) increased by 6% (9% in constant currency) to US$3,843 million (Q1-3/2013: US$3,619 million). Sales in dialysis services increased by 9% to US$1,913 million (Q1-3/2013: US$1,750 million). Dialysis product sales increased by 3% to US$1,930 million (Q1-3/2013: US$1,869 million).
EBIT was US$1,591 million (Q1-3/2013: US$1,595 million). The EBIT margin was 13.8% (Q1-3/2013: 14.8%). EBIT was impacted by sequestration and rebasing of Medicare's reimbursement rate in the United States. In Q3/2014, EBIT increased by 6% to US$590 million (Q3/2013: US$557 million). EBIT margin was 14.3% (Q3/2013: 15.2%).
Net income attributable to shareholders of Fresenius Medical Care AG & Co. KGaA was US$710 million (Q1-3/2013: US$761 million). In Q3/2014, net income was US$271 million (Q3/2013: US$273 million).
Operating cash flow was US$1,274 million (Q1-3/2013: US$1,446 million). The decrease was mainly attributable to the payment for the W.R. Grace bankruptcy settlement of US$115 million and increased working capital in Q1/2014. The cash flow margin was 11.1% (Q1-3/2013: 13.5%). In Q3/2014, operating cash flow increased to US$712 million (Q3/2013: US$605 million), the cash flow margin was 17.3% (Q3/2013: 16.5%).
Fresenius Medical Care confirms its outlook for 2014. Fresenius Medical Care expects sales of approximately US$15.2 billion, translating into a growth rate of around 4%. This outlook excludes sales of approximately US$500 million from acquisitions completed during the first nine months of 2014. Net income attributable to shareholders of Fresenius Medical Care AG & Co. KGaA is expected to be unchanged between US$1.0 to US$1.05 billion. The company has initiated a global efficiency program designed to enhance its performance over a multi-year period. Potential cost savings before income taxes of up to US$60 million generated from this program are not included in the outlook for 2014.
For further information, please see Fresenius Medical Care's Investor News at www.fmc-ag.com.
1 Net income attributable to shareholders of Fresenius Medical Care AG & Co. KGaA
Fresenius Kabi
Fresenius Kabi offers infusion therapies, intravenously administered generic drugs and clinical nutrition for seriously and chronically ill patients in the hospital and outpatient environments. The company is also a leading supplier of medical devices and transfusion technology products.

- 5% organic sales growth in Q3
- Sequential EBIT margin increase by 40 bps to 17.2% in Q3
- 2014 guidance: 4 % to 6 % organic sales growth confirmed,
EBIT-margin of approximately 17% expected
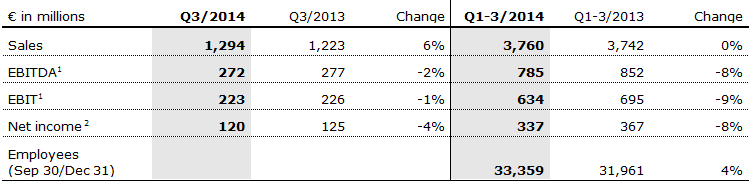
Sales were €3,760 million (Q1-3/2013: €3,742 million). In constant currency, sales increased by 4%. Organic sales growth was 3%. Acquisitions contributed 1% sales growth. Adverse currency translation effects (-4%) were mainly driven by the weaker currencies in the United States and Argentina against the Euro. In Q3/2014, sales increased by 6% (7% in constant currency) to €1,294 million (Q3/2013: €1,223 million). Organic sales growth was 5%.
Sales in Europe grew by 1% (organic sales growth: 2%) to €1,538 million (Q1-3/2013: €1,524 million). Sales in North America decreased by 3% (organic sales growth: 0%) to €1,118 million (Q1-3/2013: €1,158 million). Asia-Pacific sales increased by 5% (organic sales growth: 7%) to €723 million (Q1-3/2013: €689 million). Sales in Latin America/Africa increased by 3% (organic sales growth: 13%) to €381 million (Q1-3/2013: €371 million).
EBIT1 was €634 million (Q1-3/2013: €695 million), a decrease of 6% in constant currency. Besides currency headwinds, EBIT was impacted by lower HES sales and the easing of drug shortages in North America. The EBIT margin of 16.9% was in line with expectations and our guidance range. In Q3/2014, EBIT1 was €223 million (Q3/2013: €226 million), an increase of 1% in constant currency. Sequentially, the EBIT margin improved by 40 bps to 17.2% in Q3/2014.
Net income2 was €337 million (Q1-3/2013: €367 million). In Q3/2014, net income2 was €120 million (Q3/2013: €125 million).
Operating cash flow was €432 million (Q1-3/2013: €303 million) with a margin of 11.5% (Q1-3/2013: 8.1%). In Q3/2014, operating cash flow was €217 million (Q3/2013: €65 million) with a margin of 16.8% (Q3/2013: 5,3%).
Integration costs for Fenwal were €6 million (pre-tax) in Q1-3 2014. These costs are reported in the Group Corporate/Other segment.
Fresenius Kabi confirms its 2014 organic sales growth outlook of 4% to 6%. The EBIT margin is now confirmed at approximately 17%, so within the previously guided range of 16.5% to 18%.
1 before integration costs
2 Net income attributable to shareholders of Fresenius Kabi AG; before integration costs
For a detailed overview of integration costs please see the reconciliation tables on page 15f in the PDF. Fresenius Kabi guidance excludes €40-50 million pre-tax Fenwal integration costs (€30-40 million after tax); see Group guidance.
Fresenius Helios
Fresenius Helios is Germany's largest hospital operator. HELIOS owns 110 hospitals, thereof 86 acute care clinics including seven maximum care hospitals in Berlin-Buch, Duisburg, Erfurt, Krefeld, Schwerin, Wiesbaden and Wuppertal and 24 post-acute care clinics. HELIOS treats more than 4.2 million patients p.a., thereof more than 1.2 million inpatients, and operates more than 34,000 beds.


- 6% organic sales growth in Q3
- Sequential EBIT margin increase of 30 bps to 10.8% in Q3
- 2014 guidance fully confirmed
Sales increased by 53% to €3,883 million (Q1-3/2013: €2,537 million). The strong increase is mainly due to the acquired hospitals from Rhön-Klinikum AG. The divestment of two HELIOS hospitals reduced sales growth by 2%. Organic sales growth was 4%. In Q3/2014, sales increased by 62% to €1,362 million (Q3/2013: €842 million), organic sales growth was 6%.
EBIT2 grew by 41% to €397 million (Q1-3/2013: €282 million). The EBIT margin was 10.2% (Q1-3/2013: 11.1%). The margin decline is due to the consolidation of the newly acquired hospitals. In Q3/2014, EBIT1 was €147 million (Q3/2014: €103 million). Sequentially, the EBIT margin increased by 30 bps from 10.5% in Q2/2014 to 10.8% in Q3/2014.
Net income2,3 increased by 47% to €286 million (Q1-3/2013: €194 million). In Q3/2014, net income1,3 increased by 43% to €107 million (Q3/2013: €75 million).
Sales of the established hospitals grew by 4% to €2,583 million. EBIT improved by 4% to €287 million. The EBIT margin was 11.1% (Q1-3/2013: 11.1%).
Sales of the acquired hospitals were €1,300 million, EBIT was €110 million and EBIT margin was 8.5%. Q3/2014 EBIT margin decreased by 20 bps sequentially to 8.9% due to the first time consolidation of the acquired hospital in Wiesbaden (HSK) as of June 30, 2014.
The integration of the acquired hospitals is progressing as planned. Integration costs are now expected to be between €60-80 million (before: approximately €80 million) in total for 2014 and 2015. Fresenius Helios confirms expected cost synergies of approximately €85 million p.a. by 2015.
Fresenius Helios fully confirms its 2014 outlook, and projects organic sales growth of 3% to 5%. The acquired hospitals are also expected to show 3% to 5% organic growth and to contribute sales of approximately €1.8 billion. EBIT for HELIOS including the acquired hospitals is expected to increase to €540-560 million.
1 2014 before integration costs
2 2014 before integration costs and disposal gains (two HELIOS hospitals, Rhön stake)
3 Net income attributable to shareholders of HELIOS Kliniken GmbH
For a detailed overview of integration costs and disposal gains please see the reconciliation tables on page 15f in the PDF.
Fresenius Helios guidance before integration costs for the hospitals acquired from Rhön-Klinikum AG and disposal gains of two HELIOS hospitals and Rhön stake. The integration costs will be reported in the Group Corporate/Other segment, see Group guidance.
Fresenius Vamed
Fresenius Vamed manages projects and provides services for hospitals and other health care facilities worldwide.

- 7% organic sales growth in Q3
- Record quarterly order intake of €378 million in Q3
- 2014 guidance: flat organic sales growth expected
5% - 10% EBIT growth expectation confirmed
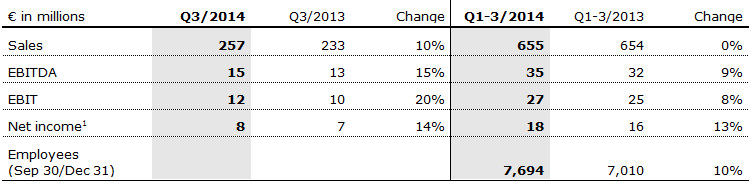
Sales were €655 million (Q1-3/2013: €654 million). Organic sales growth was -2%, acquisitions contributed 2%. Sales in the project business decreased by 8% to €306 million (Q1-3/2013: €332 million), mainly due to project delays in Russia and Ukraine. Sales in the service business grew by 8% to €349 million (Q1-3/2013: €322 million). Sales in Q3/2014 were €257 million (Q3/2013: €233 million). Organic sales growth was 7%.
EBIT grew by 8% to €27 million (Q1-3/2013: €25 million) with a margin of 4.1% (Q1-3/2013: 3.8%). In Q3/2014, EBIT increased by 20% to €12 million (Q3/2013: €10 million) with a margin of 4.7% (Q3/2013: 4.3%).
Net income1 increased by 13% to €18 million (Q1-3/2013: €16 million). In Q3/2014, net income1 increased by 14% to €8 million (Q3/2013: €7 million).
Order intake increased by 78% to €678 million (Q1-3/2013: €380 million). Q3/2014 order intake was at a record level of €378 million, mainly driven by the modernization contract with the University Hospital Schleswig-Holstein in Germany. As of September 30, 2014, order backlog increased to €1,504 million (Dec. 31, 2013: €1,139 million).
Due to project delays in Russia and Ukraine Fresenius Vamed now expects flat organic sales growth (before: 5% to 10%). The EBIT growth guidance of 5% to 10% for 2014 remains unchanged.
1 Net income attributable to shareholders of Vamed AG.
Analyst-/Investor Conference Call
As part of the publication of the results for the first three quarters of 2014, a conference call will be held on November 4, 2014 at 2 p.m. CET (8 a.m. EST). All investors are cordially invited to follow the conference call in a live broadcast via the Internet at www.fresenius.com, see Investor Relations, Presentations. Following the call, a replay of the conference call will be available on our website.
This release contains forward-looking statements that are subject to various risks and uncertainties. Future results could differ materially from those described in these forward-looking statements due to certain factors, e.g. changes in business, economic and competitive conditions, regulatory reforms, results of clinical trials, foreign exchange rate fluctuations, uncertainties in litigation or investigative proceedings, and the availability of financing. Fresenius does not undertake any responsibility to update the forward-looking statements in this release.